

Every savvy social media manager knows how important it is to stay on top of trends.
Research shows that more than 2 billion photographs and videos are uploaded on social media daily, underscoring the fact that users gravitate more toward visuals than text online. Additionally, a staggering 70% of users acknowledge having FOMO, which influences their decision making and behavior.
Therefore, having a good grasp of all the latest social media trends and associated data, that could potentially have a bearing on your social media marketing efforts, is crucial to do your job effectively.
So, are you ready for a quick rundown of all the pertinent social media statistics you need to be aware of in 2024?
Top social media statistics for 2024
In this section, we will look at statistics categorized by usage and demographics. We’ve also included a sub-section on social media marketing-specific data.
Global reach and usage
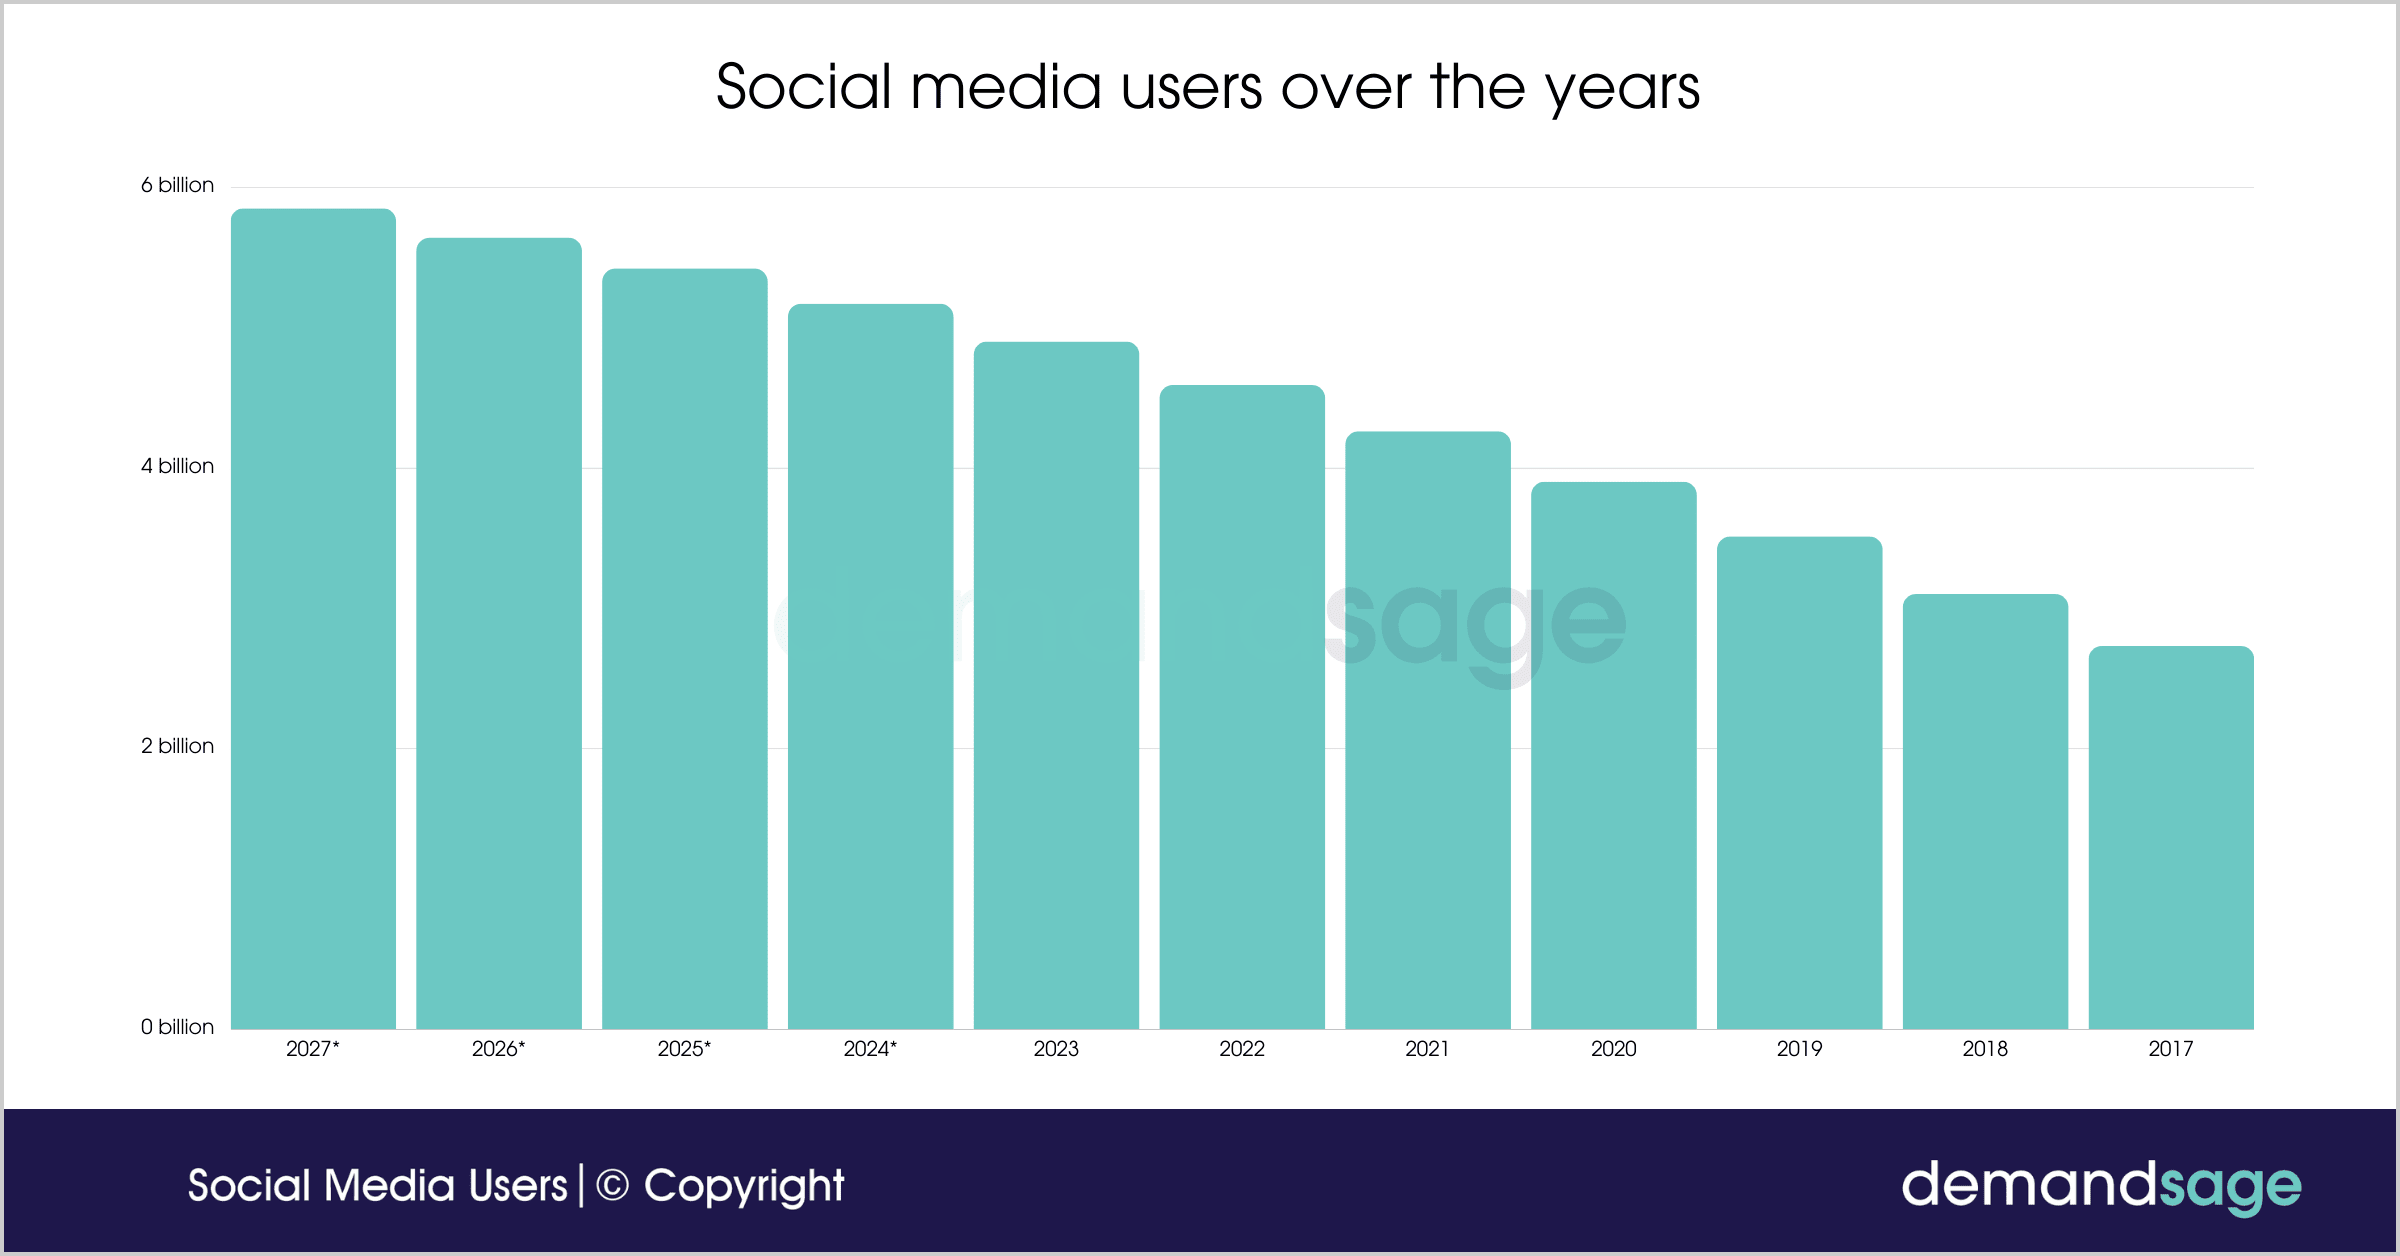
As of today, there are 4.95 billion active social media users worldwide, representing an astounding 60% of the global population. This staggering figure underscores the extensive influence of social media on society, highlighting its role as a powerful tool for communication, marketing, and personal expression.
Demographics and user base
In 2023, significant changes were observed in the demographics of social media users, making these trends important to consider this year.
In the U.S., women represented 53.9% of social media users, surpassing men, who accounted for 46.1%. This trend is consistent across various platforms with minor variations. As for age distribution among social media platforms:
Ages 18 to 29: 84%
Ages 30 to 49: 81%
Ages 50 to 64: 73%
65 and older: 45%
This data indicates that while younger individuals remain the predominant users of social media, older age groups are increasingly engaging with these platforms as they become more comfortable with technology.
Social media marketing stats
Social media marketing is poised to play a crucial role in digital marketing in 2024, as evidenced by the following statistics:
Global ad spend: In 2024, spending on global social media advertising is expected to reach a remarkable $219.8 billion, emphasizing the significant impact and worldwide reach of social media for businesses.
Return on Investment (ROI): Around 75% of marketers report that their social media advertising campaigns have yielded profitable ROI. This suggests that investments in these platforms are generating favorable outcomes for businesses.
Video dominance: Social media advertising continues to be dominated by video content. A startling 66% of marketers use video in their advertising initiatives. This preference is attributed to video content's ability to generate higher customer engagement and superior conversion rates compared to other formats.
Influencer marketing: Nearly 71% plan to increase their influencer marketing budget in 2024. Collaborating with influencers, particularly those with a loyal following, has proven to be an effective method for reaching potential customers authentically. Consequently, there is a growing interest in influencer marketing platforms.
Ad targeting: Social media advertising has undergone a significant transformation with the advent of modern ad targeting techniques. Advertisers can now target their audience with greater precision, using behavioral targeting, geolocation targeting and demographic targeting. This accuracy not only enhances conversion rates but also boosts the effectiveness of advertising campaigns.
Mobile advertising: With the increasing prevalence of social media usage on mobile devices, mobile advertising has gained considerable popularity. It is projected that global mobile ad spend will reach $402 billion in 2024.
E-commerce integration: The integration of e-commerce services into social media platforms is simplifying the process for users to make purchases directly from posts and ads. In 2023, nearly 87% of social media users made an online purchase, underscoring the growing importance of social commerce.
Popular social media statistics for each platform
Here’s some platform-specific data that you should be aware of.
Monthly active users: Over 3 billion users worldwide
Daily active users: Over 2 billion users
Average time spent on Facebook per user: Approximately 34 minutes
Monthly active users: Over 2 billion
Daily active users: 500+ million users
Average time spent on Instagram per user: Approx. 30 minutes
Monthly active users: 463 million
Average time spent on Pinterest per user: Approx. 14.2 minutes
X (formerly Twitter)
Monthly active users: 372.9 million
Average number of daily posts: 500 million
YouTube
Monthly active users: 2.527 billion logged-in users
Daily video views: Over 1 billion hours of video content
Monthly active users: 2+ billion
Daily voice and video calls: 2+ billion minutes of calls
TikTok
Monthly active users: 1.081 billion
Average time spent on TikTok per user: Approx. 52 minutes
Snapchat
Daily active users: 750+ million
Daily video views: 5+ billion
Learn More: 5 Tips for Leveraging Snapchat for Influencer Marketing
Ideal time to publish a social media post
Mastering the art of social media marketing involves more than just crafting compelling content; it's also about timing. Knowing the ideal time to publish a social media post can significantly amplify its reach, engagement and impact. We’ve compiled the latest research and insights regarding the best times to post across various social media platforms below.
With over 2.94 billion monthly active users, Facebook is still a potent tool for businesses to interact with their customers. The ideal times to post on Facebook are typically:
Weekdays: The mid-morning (9 AM to 11 AM) and mid-afternoon (1 PM to 3 PM) are often great times because people commonly check social media during work breaks
On Thursdays and Fridays, engagement is typically higher as people look forward to the weekend
The platform known for its visual content, Instagram, has its own specific posting times:
Weekdays: Lunchtime (11 AM–1 PM) and the early evening (7 PM–9 PM) are frequently the best times to post
Wednesdays: You should schedule important items here due to the high attention on this day
X
It's crucial to schedule posts in advance on X:
Weekdays: Late morning (10 to 11) and early evening (6 to 7 PM) are the greatest times to capture users
On Wednesday and Thursday, there is increased activity as people discuss trending topics
The most popular social media platform for business networking, LinkedIn has its own posting times:
Weekdays: On Tuesdays, Wednesdays and Thursdays, the best outcomes are typically during midday (7 to 8 AM) and at lunch (5 to 6 PM)
The busiest days on LinkedIn are Wednesday and Thursday
TikTok
The newest social media phenomenon, TikTok, has its own unique schedule:
Evenings: From 8 to 11 PM, when customers unwind and browse through amusing content
Weekends: Thursday and Friday evenings, in particular, are popular
YouTube
Uploading on YouTube should correspond with the viewing schedule of your desired audience since it is the primary space for video content:
Weekdays: When people go home from work or school, late afternoon (2 PM to 4 PM) and early evening (7 PM to 10 PM), are the best viewing hours
Since individuals have more free time on Saturdays and Sundays, weekends are the next best option for posting
How to leverage social media statistics to boost brand visibility
Harnessing insights from social media statistics can significantly boost your brand's visibility. These insights are key to refining your social media strategy and content creation, ultimately enhancing brand awareness.
Below, we outline effective ways to use these insights for maximum impact:
Understand your audience
Analyze the demographics of each platform's users who follow you. Consider age, gender, place of residence and interests.
Determine the times of day when your target audience is online the most. Plan your posts accordingly.
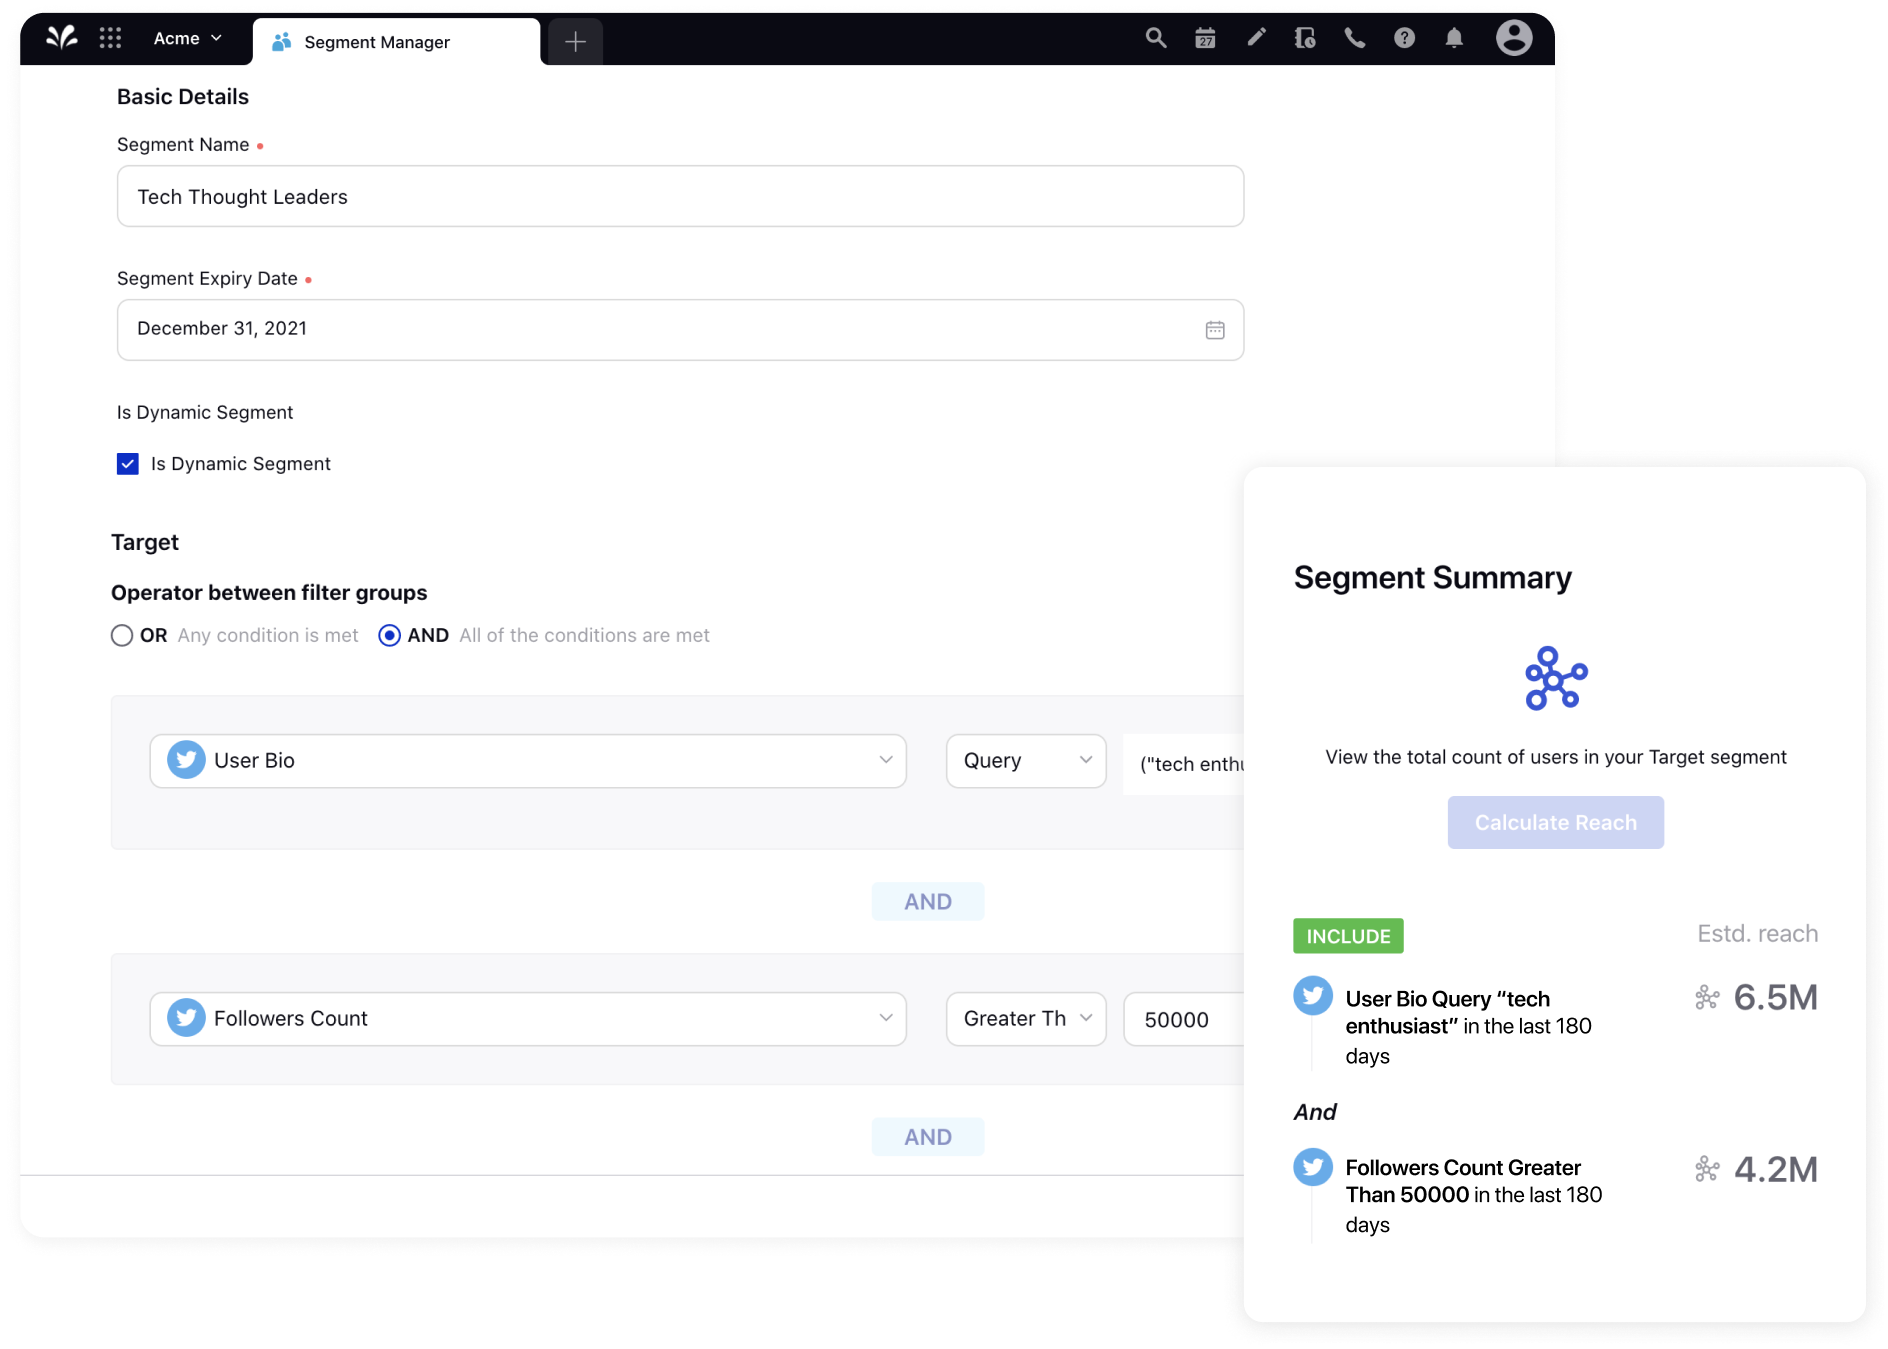
Quick Tip: You don’t have a pulse on your audiences’ needs and preferences? Guess what, with Sprinklr’s AI-powered audience insights, you can create custom audience segments off of social signals, audience profiles and engagement metrics. Once segmented, you can zoom in on what holds audiences together to identify and target relevant audience tribes.
Content optimization
Identify the social media content categories (such as photographs, videos and infographics) that perform well on popular platforms.
Pay careful attention to engagement indicators such as likes, shares and comments to determine the impact of your content.
Tailor your material to the preferences and needs of your audience.
Platform selection
Pay attention to the social media channels where your target market is most engaged. Prioritize those platforms or publish only on those platforms if you're short on resources.
Think about the content types that work well for each platform. For instance, X is text-heavy, whereas Instagram is image-centric.
Posting frequency and timing
Plan your content to go live at times when engagement is at its highest.
Depending on the platform's activity, change the posting frequency.
Hashtag strategy
Examine the hashtags that are popular or used often in your niche. Add appropriate hashtags to your posts.
To promote your content and make the most of user-generated content, create branded hashtags.
Engagement and interaction
Respond quickly to messages and comments. Make sure you engage with your target audience to grow your following and improve customer retention rates.
Determine which of your posts lead to the most interactions, then replicate that interaction.
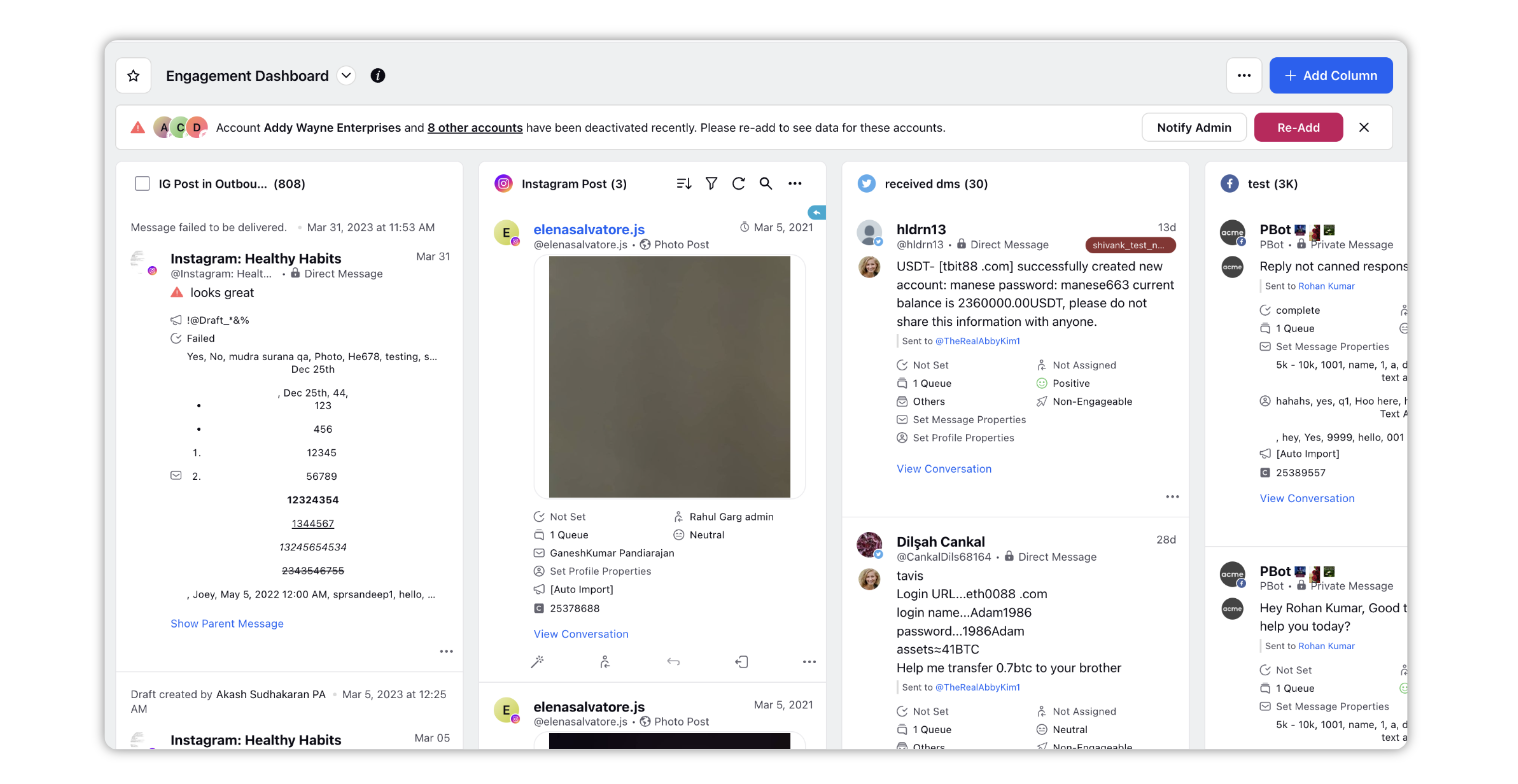
Did you know? Sprinklr’s engagement dashboards allow you to create customized channel dashboards in which messages can be viewed, acted upon, engaged with, and assigned. From the Engagement Dashboards, your team can view and act on messages in columns custom configured to display the content they need to be able to see and act on.
Competitor analysis
Look into the social media strategy and presence of your closest competitors.
Identify gaps or opportunities in the content that the competitors are not addressing and use it to your advantage.
Paid advertising
Use the targeting tools offered by most popular social platforms to reach a more targeted audience based on the demographics and interests you've determined.
To make your campaigns more effective, A/B test various ad creatives and targeting choices.
Monitor trends
Follow social media trends and, where appropriate, incorporate them into your approach.
Use popular hashtags and subjects to boost the exposure of your content.
Track key performance indicators (KPIs)
Keep track of KPIs like follower growth, click-through, conversion and engagement rates.
Based on how well your posts and campaigns perform, modify your plan for the best results.
User-Generated Content (UGC)
Users should be encouraged to produce content highlighting your brand and its products.
Research has shown that UGC increases credibility and visibility of a business if used strategically.
Content calendar
Put together a social content calendar that is in line with your objectives and findings. This will help with the implementation of your content strategy.
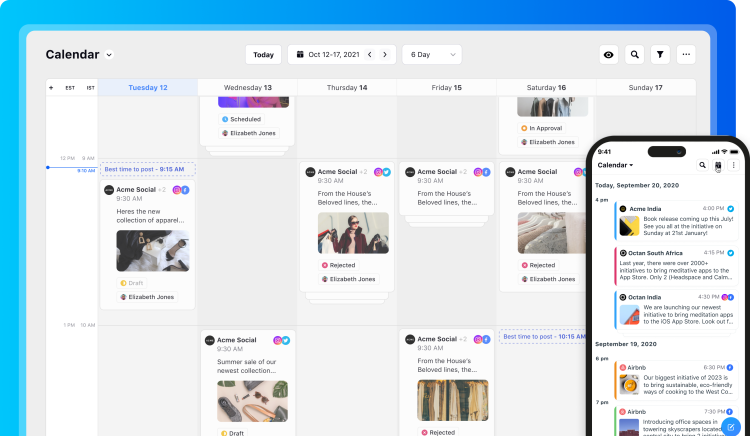
Quick Tip: Are you finding it difficult to manage cross-channel collaboration and scheduling? Sprinklr’s Unified Calendar gives you full visibility into all campaign activities — helping you identify top content you can re-use to drive down production costs and free up budget for other social media investments.
Evaluate and adapt
Review your social media statistics frequently and change your plan as necessary.
To determine what strategies work best for your brand, be willing to experiment and explore different ideas.
Must Read: Social Media Management: A Comprehensive Guide
Wrap up
Success in the ever-changing world of social media depends on knowledge, adaptability and foresight. One thing is certain: keeping up with the latest social media statistics is not simply an option; it's a strategic need to succeed in 2024 and beyond.
Sprinklr Social can be your reliable partner by decoding the constantly changing algorithms to predict new trends and create content that resonates with your target audience, enabling you to see your brand's narrative unfold in ways you never anticipated.
Discover more by booking a demo today!
Frequently Asked Questions
Article Author


Related Articles


Discover the top benefits of using AI for content marketing, along with some of the best AI tools around for a winning marketing strategy.
Karishma Borkakoty
May 16, 202411 min read


Discover 8 social media strategies that elevate product visibility and user engagement for banks. Get the word out about your bank's latest offerings to get that competitive edge.
Shubham Gupta
May 16, 202410 min read


Realize the true potential of social media brainstorming. Uncover its objectives, along with top-notch techniques and best practices, to amplify brand growth.
Bhavya Aggarwal
May 15, 202413 min read