Evaluate Reporting Data with Summaries
Updated
Summaries are mathematical functions that you can apply to numeric columns in a report. Apply summaries to find the sum, average, minimum, or maximum value. Summaries evaluate data and show subtotals for each report widget, plus a grand total for all data in the widget. No need to write a formula to find these essential math functions; instead, just apply them.
Apply a summary to answer business questions like these:
Which of our social media accounts has the most engagement, and which has the least?
What is the average engagement of all our social media accounts?
To Summarize Reporting Widget Data
Click the New Tab icon
. Under the Sprinklr Social tab, click Reporting within Analyze.
From the Reporting Home window, select the desired dashboard.
In the top right corner of the Reporting Dashboard, click Add Widget.
In the Add Widget window, enter a name for your widget and select the desired Data Source.
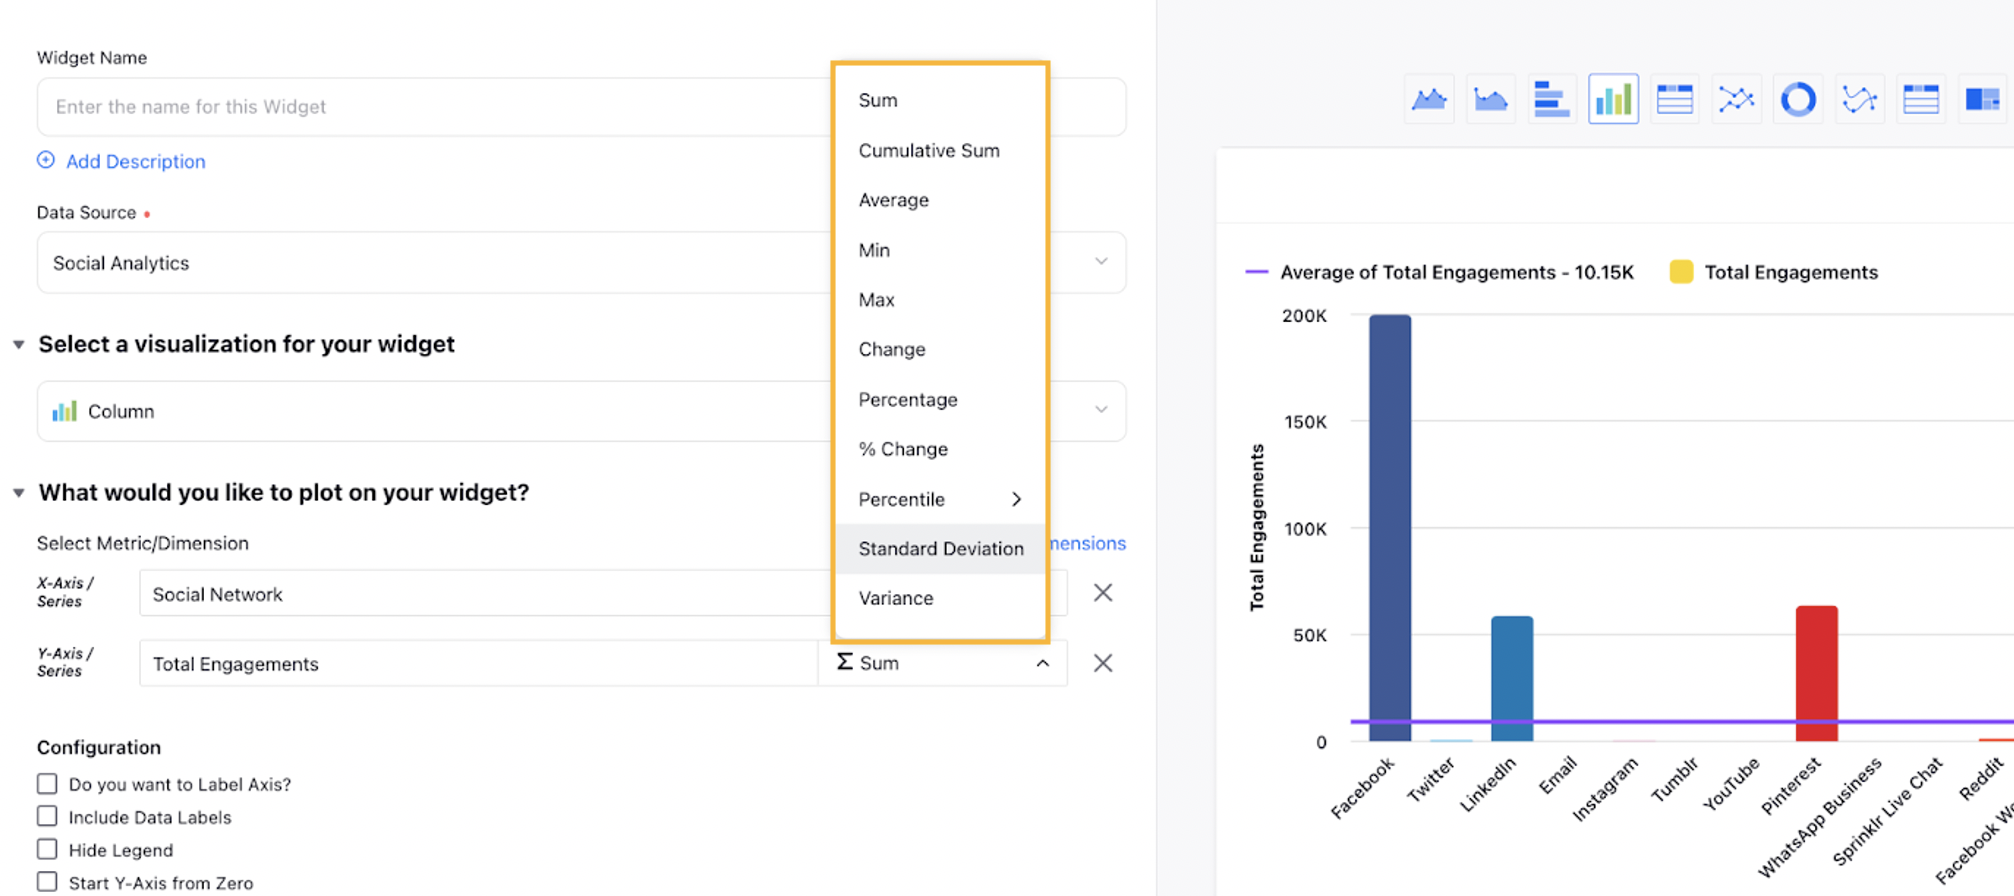
Next, select the desired visualization and metrics for your widget.
Once you have selected the metrics and dimensions, you can use the summaries option alongside the respective metrics & dimensions.
Click Add to Dashboard in the bottom right corner to add your widget to the Dashboard. You can also scroll to the bottom of the dashboard to view the newly created widget. Additionally, rearrange by dragging and dropping the widget into a preferred slot.
Available Summaries in Sprinklr
Summaries | Description |
Sum | |
Cumulative Sum | |
Average | |
Aggregate Averages over Time Periods | Averages can be calculated over a specific time period. For eg, you can now understand the average number of posts published over a week/month/year. |
Min | |
Max | |
Change | |
Percentage | |
% Change | |
Percentile | |
Standard Deviation | |
Variance |
Note: Standard Deviation & Variance summeries does not work with calculated and custom metrics. |