View Reporting for Omni-Channel Journeys
Updated
Once you have deployed a customer journey, you may want to evaluate the engagement of the audience. Sprinklr provides you with the ability to check reporting for the audience activity on its Reporting dashboard. It enables you to get detailed reports for various types of audience activities, both at an aggregate as well as individual level. Based on this reporting on the performance of the communications you send out through customer journeys, you can modify your strategy, as necessary.
To View Reporting on Journey Emails
Click the New Tab icon and select Reporting within Analyze under Sprinklr Marketing → Marketing tab.
Click the Dashboards dropdown in the top left corner of the Dashboard and select the desired reporting dashboard.
Click Add Widget in the top right corner of the desired reporting dashboard.
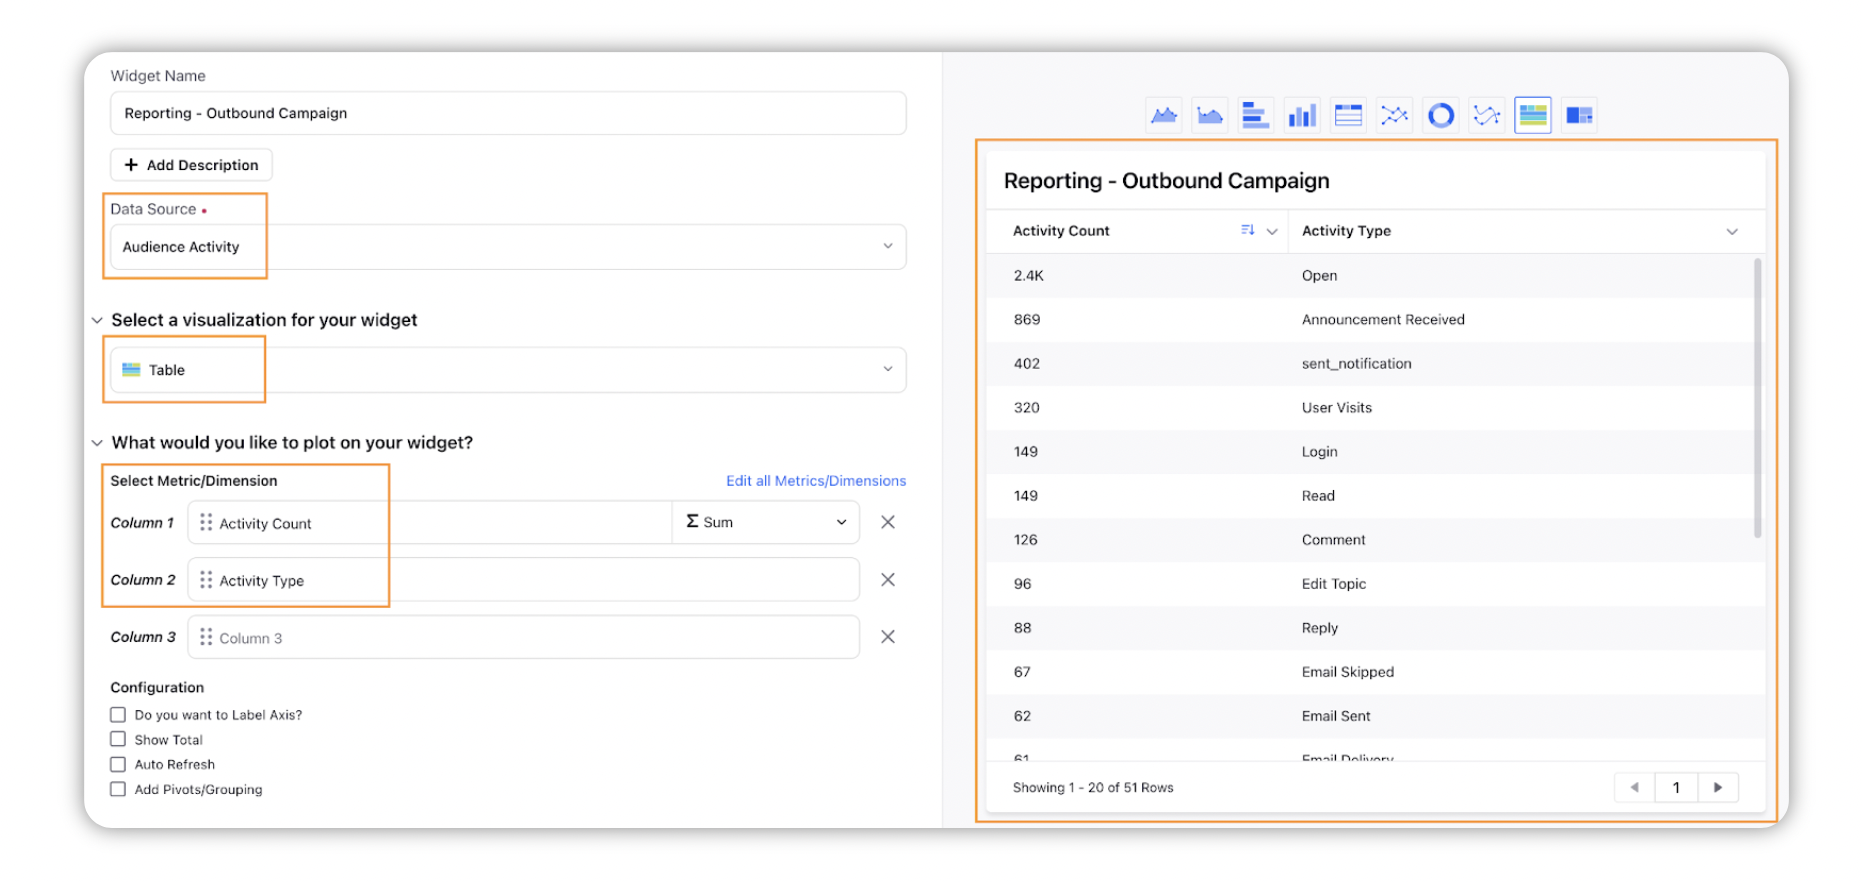
On the Add Widget window, enter a name for your widget.
Select Audience activity as the Data Source.
Select the desired Visualization for your widget.
Select the Metric or Dimension in the given fields.
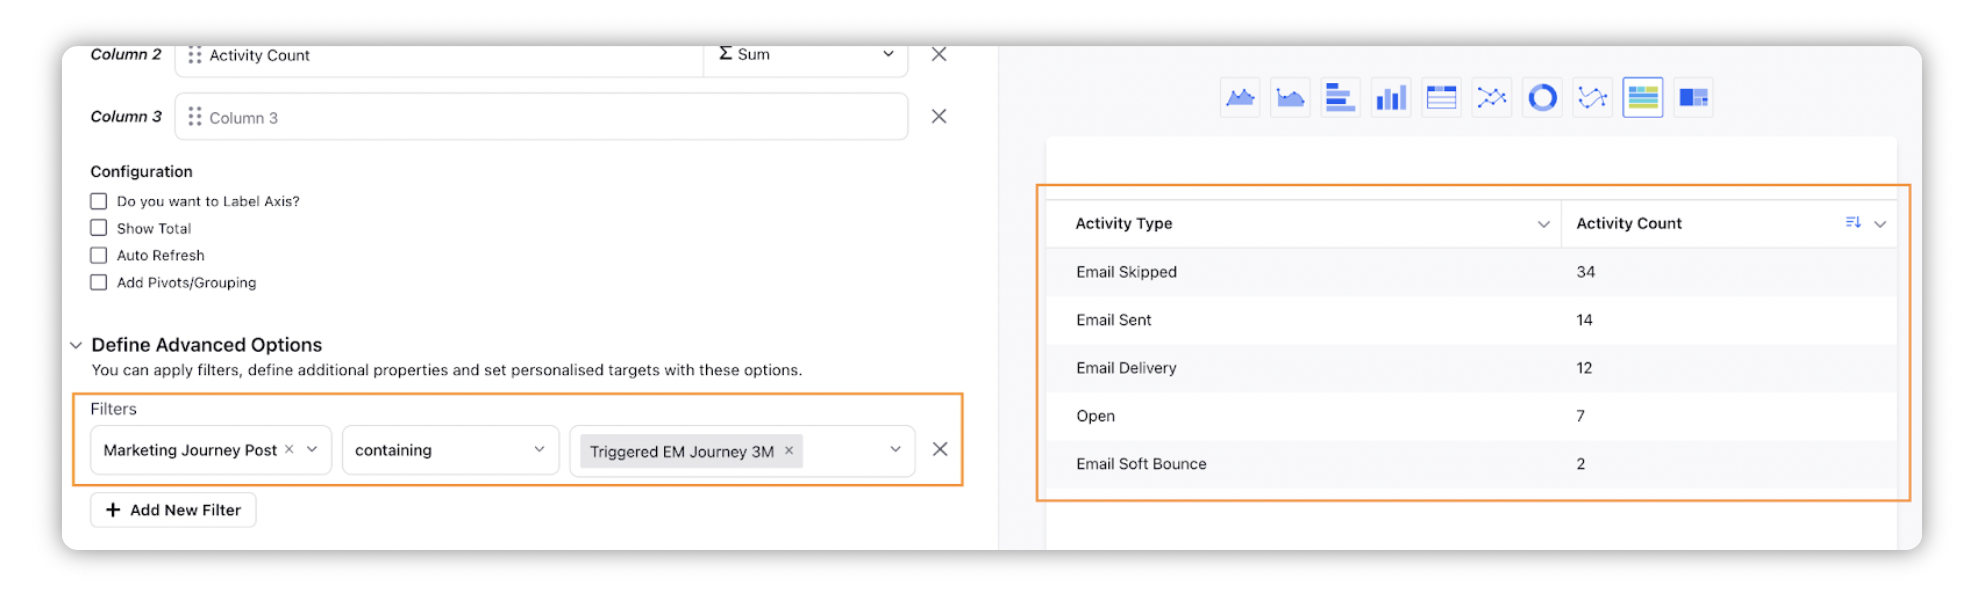
Under the Define Advanced Options section, select the Filters according to your requirement.
Click Add to Dashboard in the bottom right corner to add the widget to the reporting dashboard.
To View Reporting on Modern Channel Messages and Posts in a Journey (WhatsApp or SMS)
You can view reporting for the journeys in two types of Data Source:
Inbound Analytics
Outbound Message Data source tells you about the messages sent from Sprinklr and their status whereas Inbound Analytics reports the status marked by the Channel which is WhatsApp or SMS in this case.
To View Outbound Message Reporting
Click the New Tab icon and select Reporting within Analyze under Sprinklr Marketing → Marketing tab.
Click the Dashboards dropdown in the top left corner of the Dashboard and select the desired reporting dashboard.
Click Add Widget in the top right corner of the desired reporting dashboard.
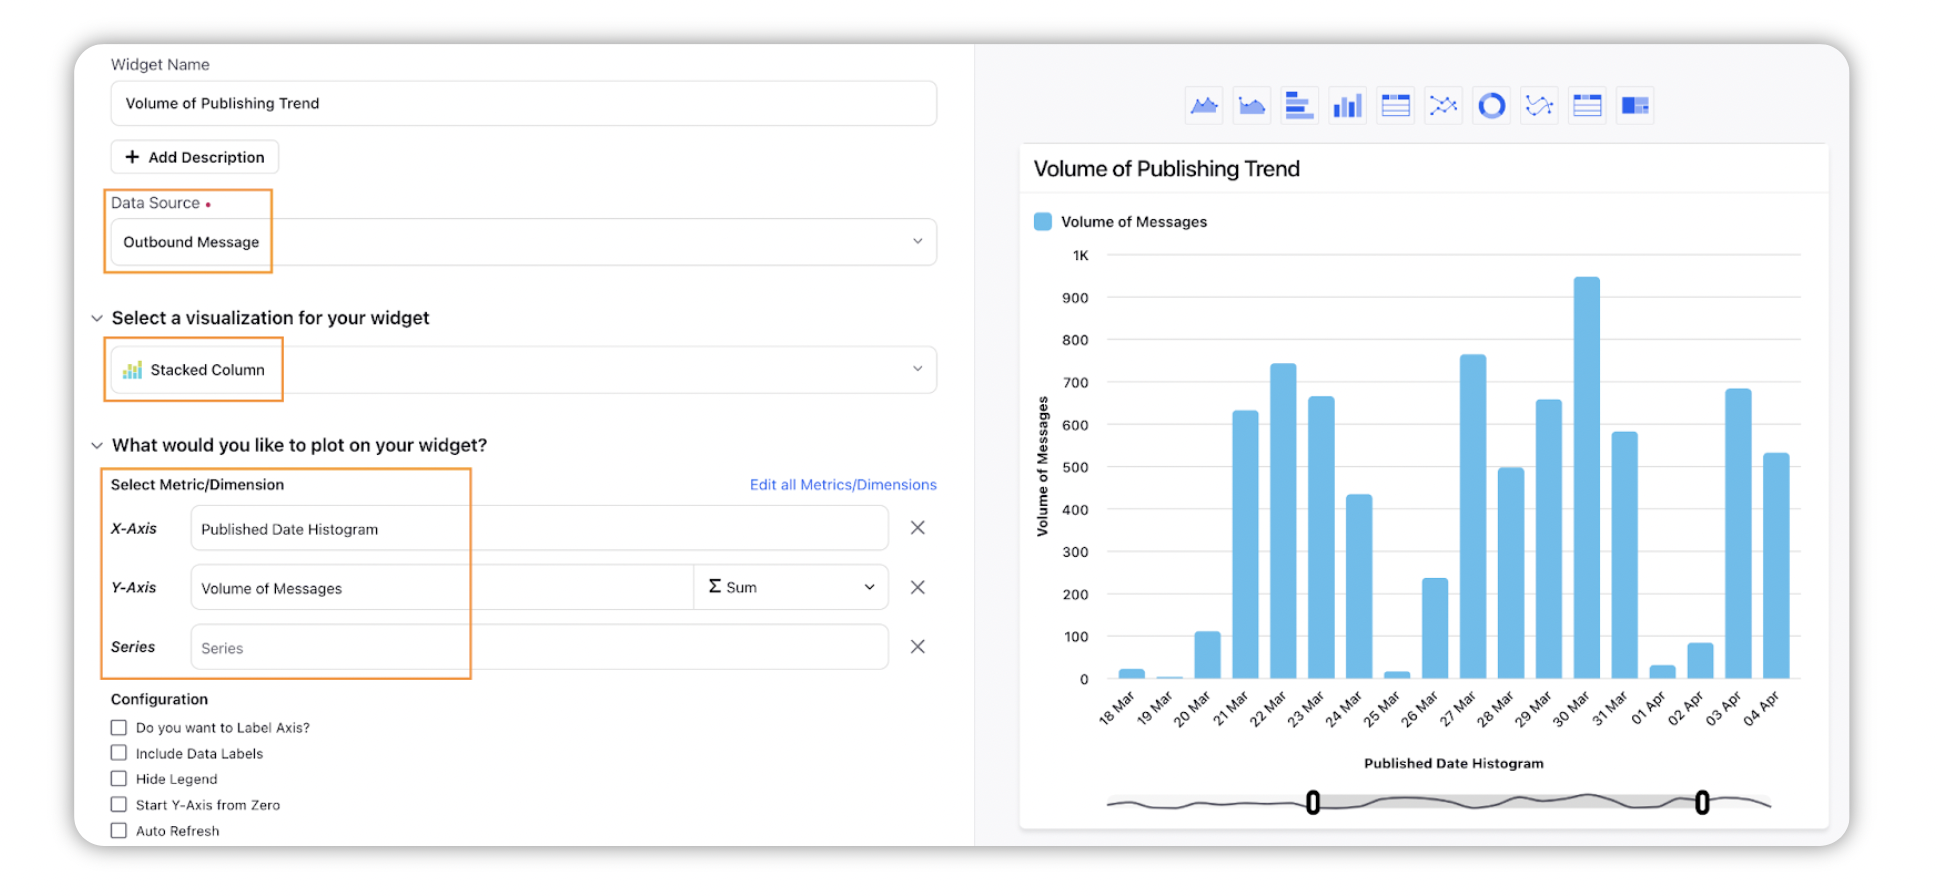
On the Add Widget window, enter a name for your widget.
Select Outbound Message as the Data Source.
Select the desired Visualization for your widget.
Select the Metric or Dimension in the given fields.
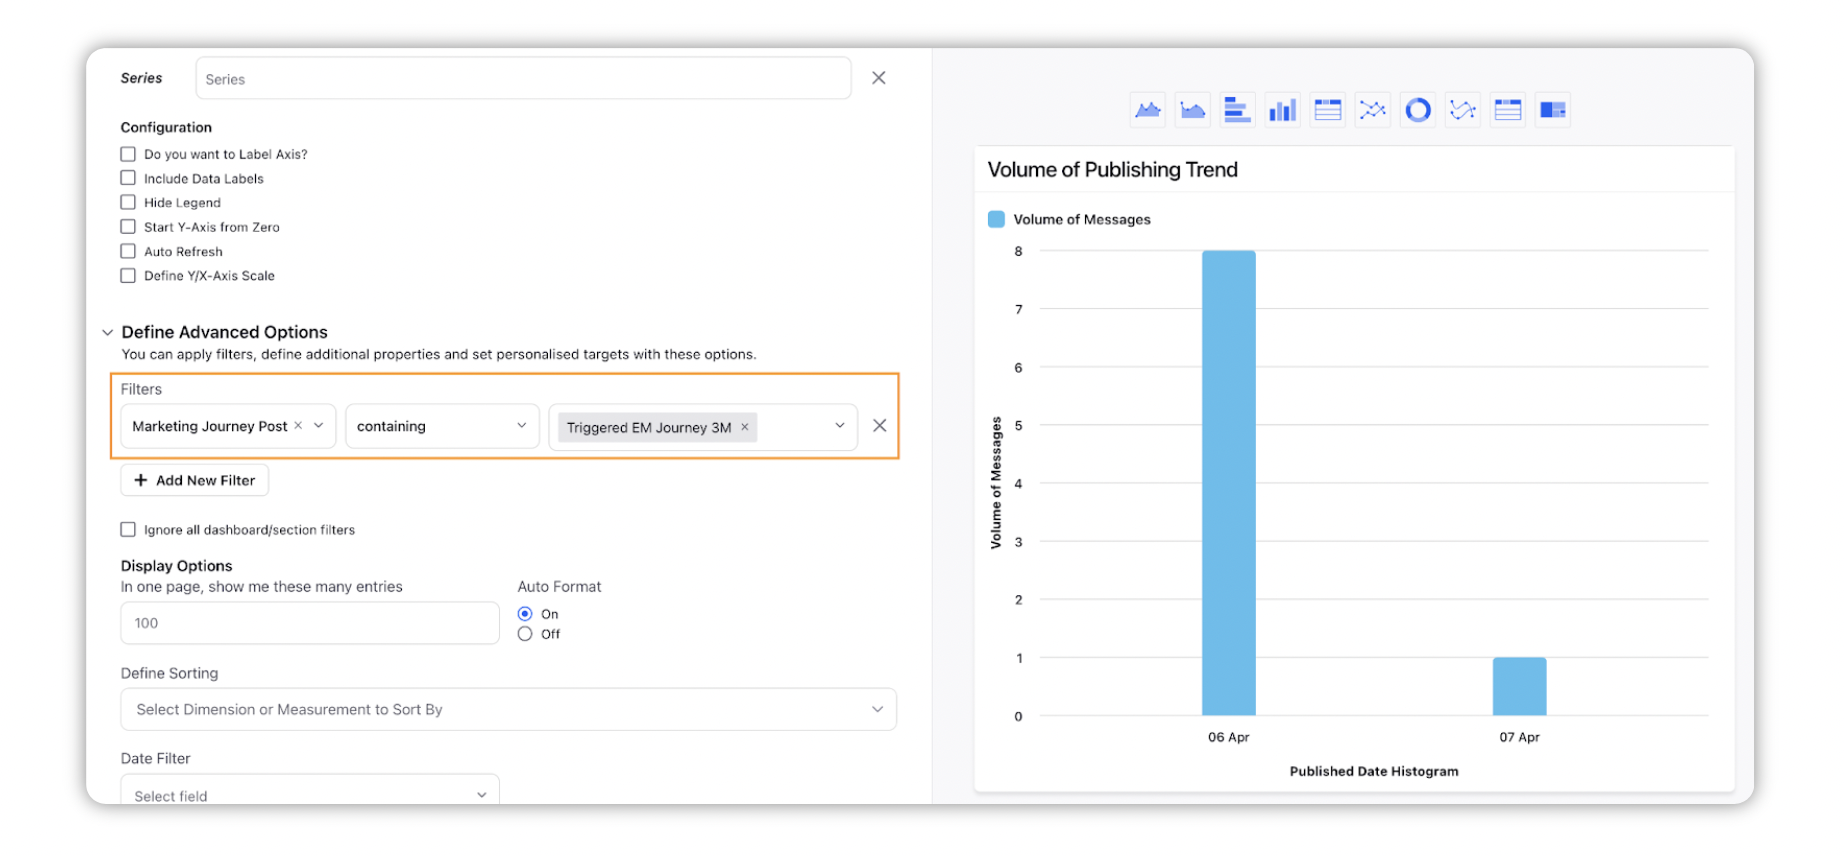
Under the Define Advanced Options section, select the Filters according to your requirement.
Click Add to Dashboard in the bottom right corner to add the widget to the reporting dashboard.
To View Inbound Analytics Reporting
Click the New Tab icon and select Reporting within Analyze under Sprinklr Marketing → Marketing tab.
Click the Dashboards dropdown in the top left corner of the Dashboard and select the desired reporting dashboard.
Click Add Widget in the top right corner of the desired reporting dashboard.
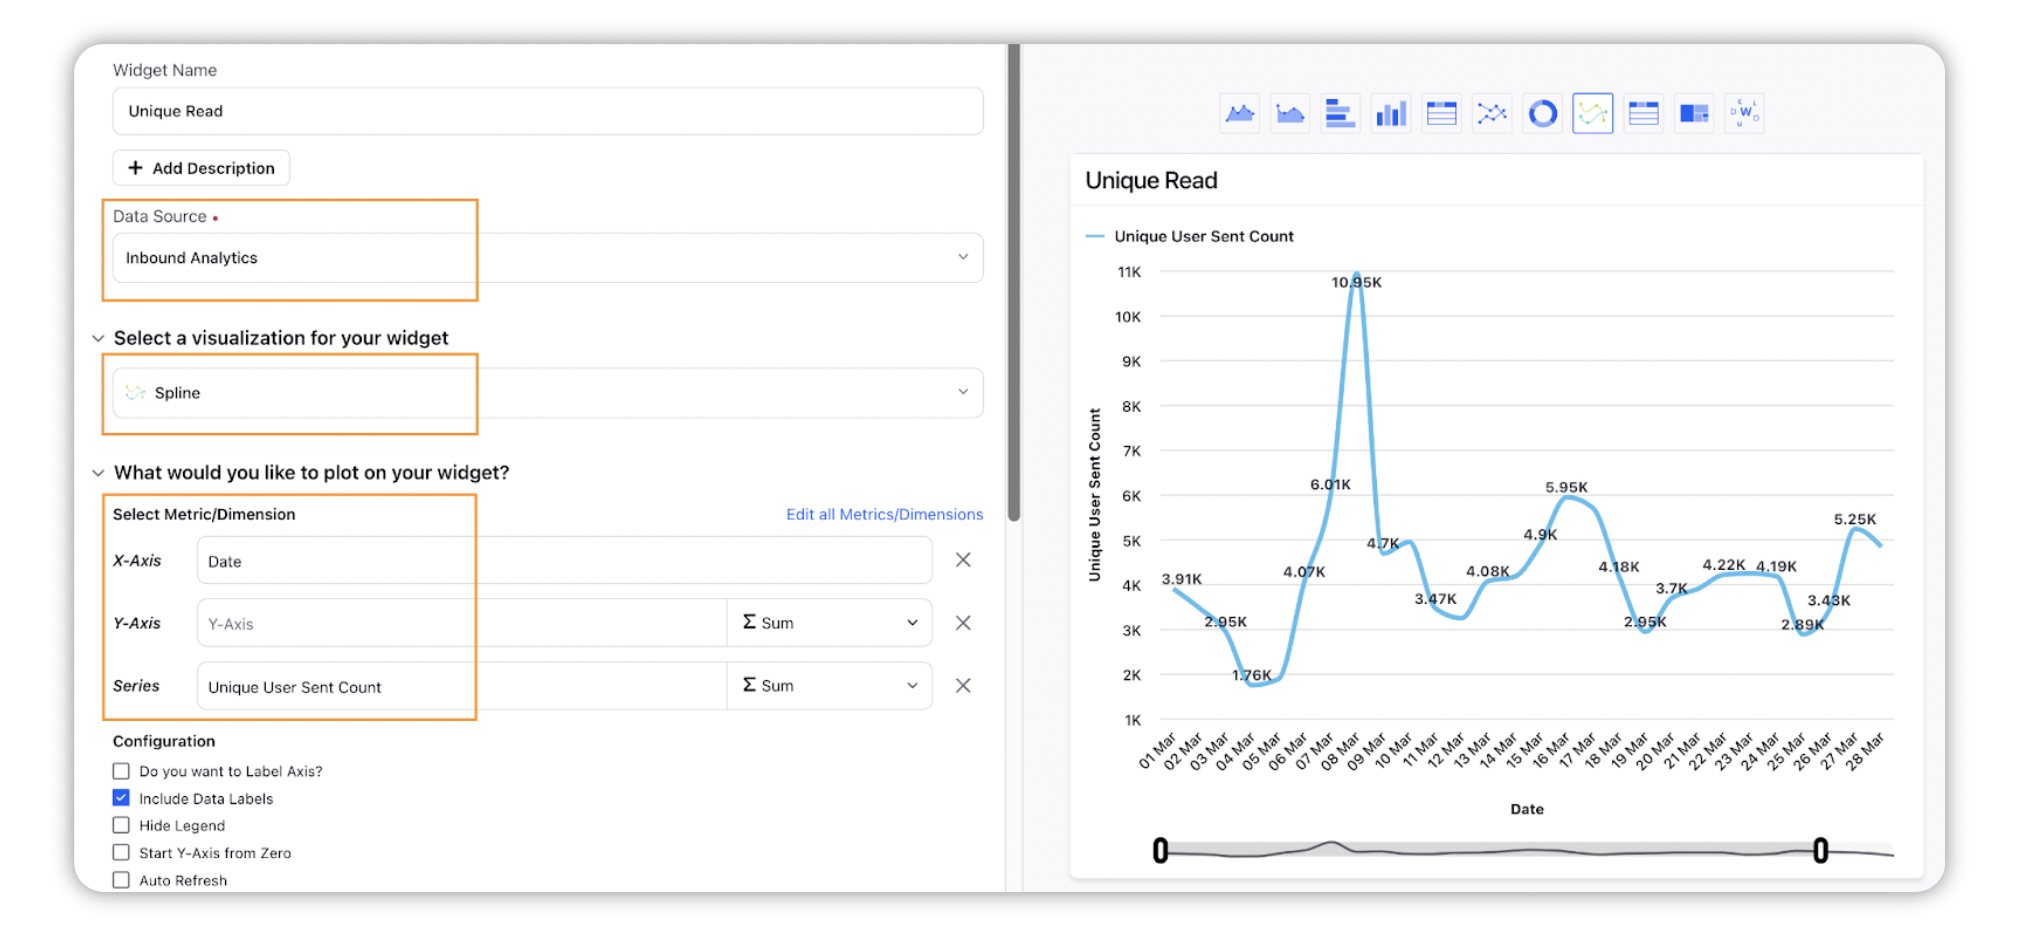
On the Add Widget window, enter a name for your widget.
Select Inbound Analytics as the Data Source.
Select the desired Visualization for your widget.
Select the Metric or Dimension in the given fields.
Under the Define Advanced Options section, select the Filters according to your requirement.
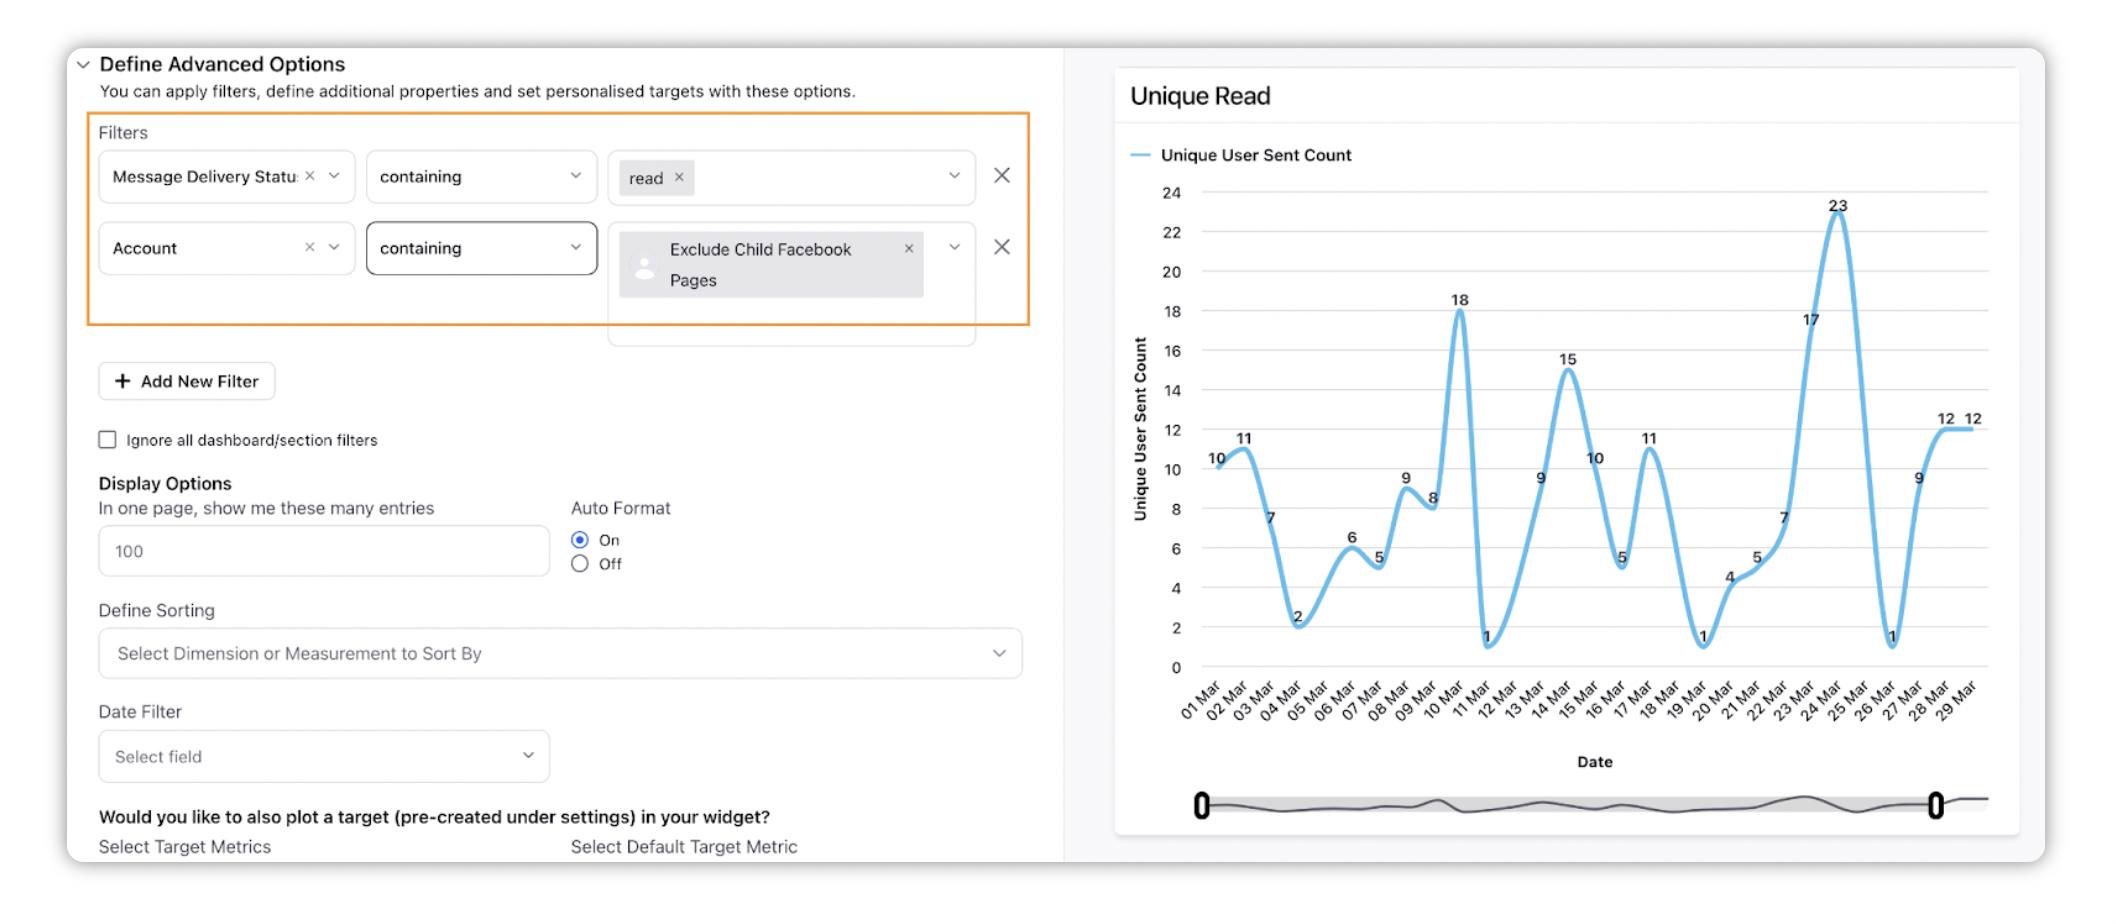
Click Add to Dashboard in the bottom right corner to add the widget to the reporting dashboard.