Dashboard/Column Pane
Updated
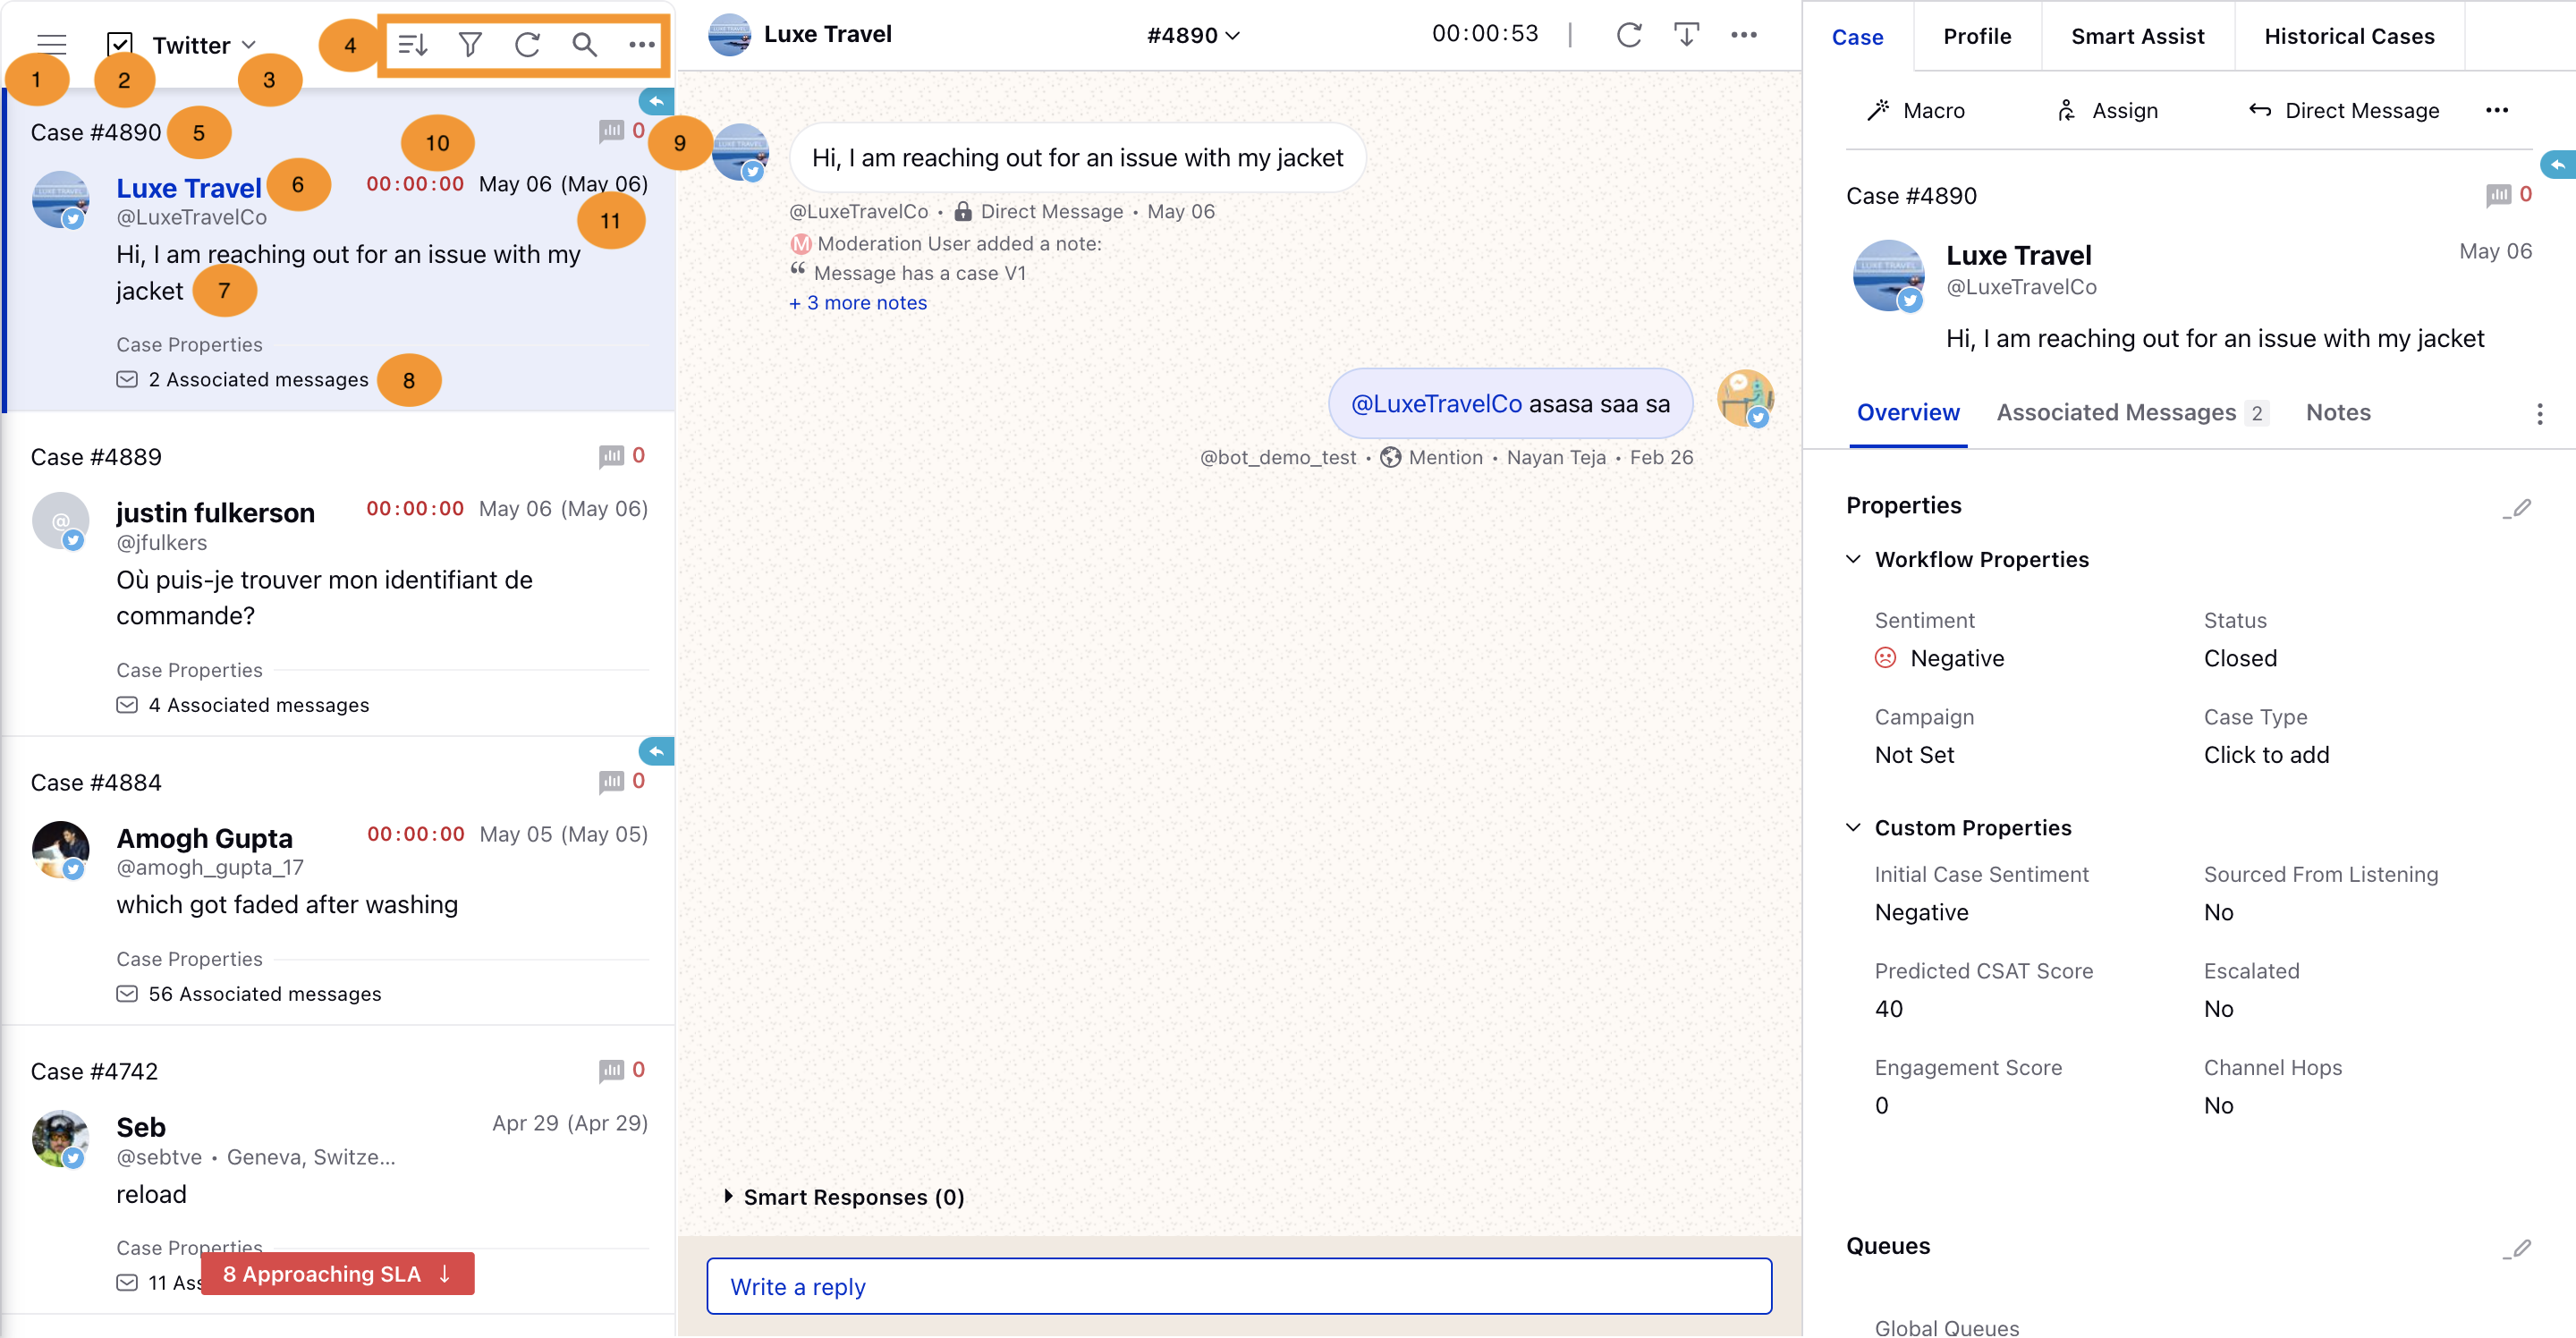
In the left pane of the Agent Console, you will find the Dashboard Console. Here, you can view and process the messages and cases in your workflow.
The Agent Console provides a unified view of all the incoming messages, mentions, and comments across social media channels, allowing agents to quickly respond to customer inquiries, comments, and complaints in real-time. The console also provides tools for routing, prioritizing, and tagging messages, as well as tracking agent performance and response times.
Message Level Columns
# | Term | Description | ||||||||||
1 | Dashboard Menu | Click the Dashboard Menu icon to open the dashboard menu where you can select a dashboard. | ||||||||||
2 | Select All | This option allows you to select all messages in the column and perform bulk actions like applying a macro, assigning messages, archiving messages, changing the sentiment, setting reminders, applying tags, and changing message properties. | ||||||||||
3 | Column Selector | Select a column. Here you can change the column that is currently being displayed. You can also add new columns. You can also view the selected dashboard name beneath it. To get this capability enabled, reach out to support at tickets@sprinklr.com.
| ||||||||||
4 | Dashboard Column Actions |
| ||||||||||
5 | Sender/Message Details | View the sender and type of message. Hover over the sender icon to view the Audience Profile. | ||||||||||
6 | Body of Message | View the body of the message. | ||||||||||
7 | View Activity | View the activities being done on the message. | ||||||||||
8 | Timestamp | Click the timestamp to view the message natively. |
Case Level Columns

# | Term | Description | ||||||||
1 | Dashboard Menu | Click the Dashboard Menu icon to open the dashboard menu where you can select a dashboard. The dashboards you'll find here are the same ones that you'll see in the Engagement Dashboards. | ||||||||
2 | Select All | This option allows you to select all items in the column and perform bulk actions like applying a macro, assigning cases, archiving cases, changing the sentiment, setting reminders, applying Tags, prioritizing the case, and changing case properties. | ||||||||
3 | Column Selector | Select a Column. Here you can change the column that is currently being displayed. You can also add new columns from here. | ||||||||
4 | Dashboard Column Actions |
| ||||||||
5 | Case ID | View the case ID. | ||||||||
6 | Sender Details | View the sender and type of Case. Hover over the sender icon to view the Audience Profile. | ||||||||
7 | Body of Message | View the body of the message. | ||||||||
8 | Associated Message | View the associated messages with the case. | ||||||||
9 | Engagement Score | The Engagement Score helps in evaluating how engaged your existing customers are based upon the activities performed by them that include likes, comments, and shares on their social media channels like Facebook. For more information, see Engagement Score on Cases. | ||||||||
10 | Agent Inactive Timer/SLA Timer | The Agent Inactive Timer will show how long has it been since the last brand response was made on a case. This timer will be reset after every new brand response. To enable this, you have to check the box alongside "Cases Show Agent Inactive Timer" while creating a Case Management column or editing an existing column.
| ||||||||
11 | Timestamp | View the case creation time. | ||||||||
12 | Survey Status Indicator | Survey Sent indicator when a survey is sent on a case. Survey Completed indicator when the survey is submitted.
| ||||||||
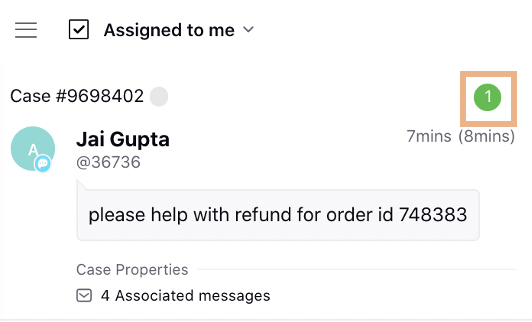
13 | New Message Indicator | This shows the count of unread message(s) in a case when a new message is added to a case in the open queue. It is visible in the ‘Assigned to Me’ column for case(s) that is not open in the middle conversation pane. To learn more about getting this capability enabled in your environment, please work with your success manager.
|
.png)
