Advocacy Reporting Metrics and Dimensions
Updated
Advocacy reporting metrics and dimensions allow you to track engagement on content that is published from your Advocacy site. In this guide, you will learn about:
![]() Note: The use of this capability requires Advocacy Marketing to be enabled in your environment. To learn more about Advocacy Marketing, please contact your Success Manager.
Note: The use of this capability requires Advocacy Marketing to be enabled in your environment. To learn more about Advocacy Marketing, please contact your Success Manager.
Advocacy Dimensions
![]() Note: While plotting Table widgets, we recommend you to plot Dimensions first for better Advocacy analytics results.
Note: While plotting Table widgets, we recommend you to plot Dimensions first for better Advocacy analytics results.
Dimensions | Description |
Activity Date | It will signify the date on which any advocate had done a certain activity on the Advocacy site. |
Actual Post | This displays the text and media of the original message to which a comment or reply was added. This dimension should be used to filter the Outbound Post to determine the original source of the message. |
Actual Post on Channel | This shows the post as it was shared by the advocate on their social channels. The date hyperlink will redirect you to the post on channel. |
Campaign | A Campaign is a categorization given to all outbound messages. A Campaign must be selected for all messages you publish in Sprinklr. Associating a Campaign to an outbound post allows you to track metrics of these Campaigns in Reporting Insights and gives valuable insight into how your social campaigns are performing. |
City* | The city of the person who clicked on a link that has been shared to social. |
Client | The name of the Sprinklr Client containing an Account, Account Group, User, Custom Property, etc. |
Date | The calendar date on which the activity occurred. |
Day of Week | The name of the day of the week on which the activity occurred. |
Joining Date | The date on which the user logged into the advocacy site for the first time |
Month of Year | The name of the calendar month on which the activity occurred. |
Outbound Post | This displays the text and media of an Outbound Message sent from an Account. |
Parent Post ID | The parent post ID is a unique number generated by the Advocacy system to help you to identify each post on the site. |
Published Date | The exact calendar date on which the message was published. |
Shared Post | This shows the post as it was shared by the advocate on their social channels. The date hyperlink will redirect you to the post on channel. |
Is Edited Post | If the post has been edited before sharing, the value for this dimension would be True. If the post has been shared exactly as the original post, the value for this dimension would be False. |
Author | If the post is published from the Quick Publisher in Space, it will be counted under Author. |
Author(Site) | If the post is published from the Advocacy site publisher, it will be counted under Author(Site). |
Social Network | The name of the social network. This dimension can be used to segment a common metric across multiple social networks (e.g.: Total Engagements) or can be used as a filter to limit a widget to display only one type of social network. For Case Reporting, this will list the social network of the first message associated with the case. |
Time of Day | The hour of the day on which the activity occurred. This is generally displayed according to the 24-hour clock and should display based on the time zone of the Sprinklr user. |
Account | The account from which the post was originally published. |
Media Asset Tags | You can plot reporting widgets with Media Asset Tag for details on assets shared in Advocacy posts(The asset has to be uploaded from the Asset Manager in Sprinklr.). |
External Share Attempt (Share Via) | When using the Sprinklr Extend mobile app to share posts to social accounts like WhatsApp or Email through the "Share Via" feature, the associated account can be tracked in the "Share Via" dimension under the Activity type "External Share Attempt." |
Universal Message Expired (Filter) | Fetch reporting on Advocacy posts which are already expired. While creating the reporting widget for expired Advocacy posts, select this filter under Define Advanced Options. |
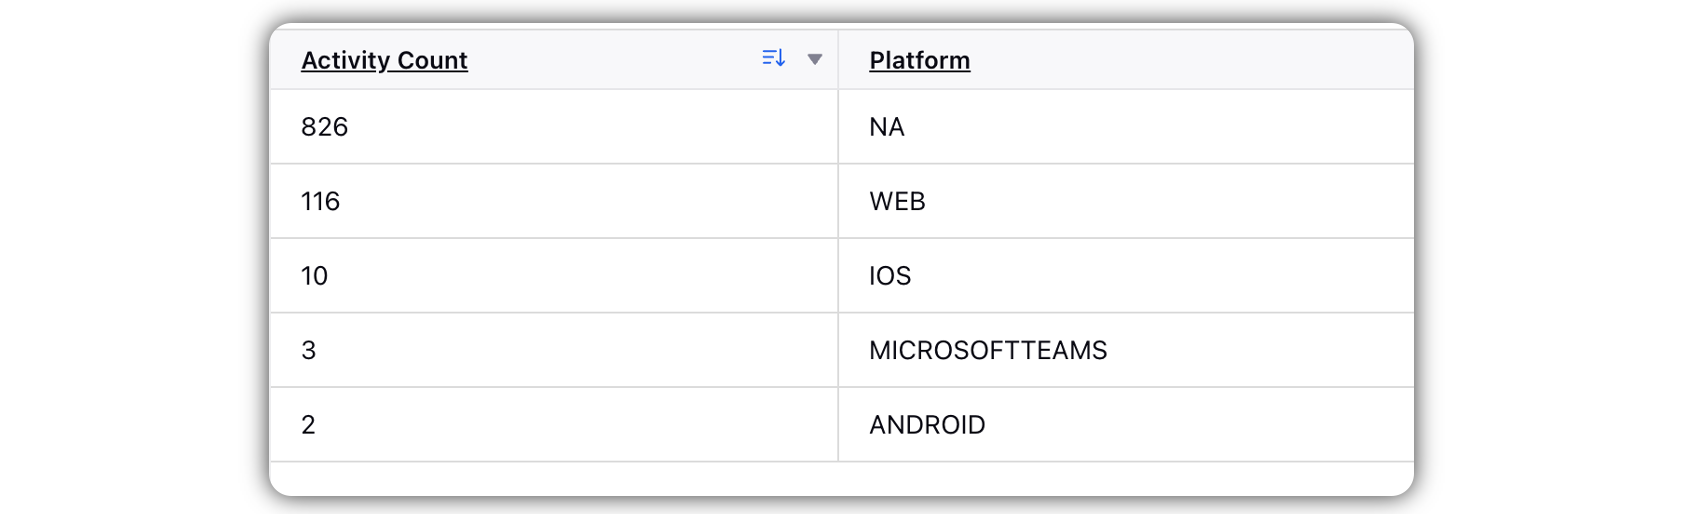
Platform | Admins can track the adoption of the Advocacy site on Teams and Salesforce integration using Sprinklr reporting. Within reporting, you can plot the platform dimension along with the activity count to get the adoption metrics for each platform your advocates are most comfortable using, i.e., Web, Mobile, Teams, or Salesforce.
|
Is Actual Post Deleted | Gives True/false value on the basis of the actual post's deleted status Note: This field should be available both as a dimension and as a filter, and it should be plottable alongside Actual Post, Shared Post, and Activity objects. |
Referred By | This can be used to track whether users are being redirected from platforms where the post has been shared or broadcast, such as Email, Sharepoint, MS Teams, Webex, Slack and Yammer. |
![]() Note: In case, you get the value for the City dimension as UNKNOWN, the following are the possible reasons for that —
Note: In case, you get the value for the City dimension as UNKNOWN, the following are the possible reasons for that —
the APIs don’t return the city value.
the APIs return the city value, but the city acknowledged is not supported for that link.
Advocacy Metrics
Metrics | Description |
Activity Count | The number of activities made by community users be it login, likes, comments, or shares. |
Click Count Trend | The total number of clicks for links that have been shared on social. Note that click counts can be measured only if links are shortened. |
Engaged Users | Users who engaged with posts by sharing the post on their social accounts. This metric takes into account only 'Share' activity. |
Engagements on Channel | The total number of likes, comments, shares, and any other reaction on a channel. |
Follower Count | A common Sprinklr metric to total all of the various types of "followers" across social networks. |
Points | Points awarded for performing specific actions. |
Post Count | The total number of shares made from advocacy of all statuses. Note that Status can be Sent, Failed, Scheduled, or Ready for Manual Publish. |
Reach on Channel | The number of people you might have reached with your messages on a channel. Note that Sprinklr only calculates the reach for the following social channels: X and LinkedIn. How Reach on Channel is calculated: X: Number of shares to X x Followers on X LinkedIn: Shares to LinkedIn x Connections on LinkedIn |
Total Active Users | The total number of users who have ever done any activity, such as login, like, comment, share, etc. (This also includes users who have been deleted). |
Total Approved Users | The total users who are approved and not deleted. |
Total Comments on Channel | The total number of comments on the channel. |
Total Engagements | Total likes, shares, and comments made by advocates on content published to the site. |
Total Content Upload | This shows the number of user-generated content (UGC) from a community user to an advocacy site. It is essentially the number of UGC a user suggested. |
Total Facebook Shares | The total number of shares on Facebook by advocates. |
Total Female Users | The number of female community users. |
Total Likes on Channel | The total number of likes on the channel. |
Total LinkedIn Shares | The total number of shares on LinkedIn by advocates. |
Total Logins | Total logins by community users into the site. |
Total Male Users | The number of male community users. |
Total Pending Users | The number of community users whose status is pending or in a review. |
Total Points Earned | Total points earned by the advocate. |
Total Reactions on Channel | The total number of reactions on the channel(Available for Facebook and LinkedIn). |
Total Rejected Users | The number of community users who are rejected by admin. |
Total Shares | Total shares by advocates on content posted to advocacy site. |
Total Shares on Channel | The number of shares on an “already shared post” (i.e a post that has been shared from Advocacy to a Social Media channel) received on the respective channel. (ex: number of re-tweets in X). |
Total X Shares | The total number of shares to X by advocates. |
Total Unique Commenters | It’s the total number of unique users who have commented on posts on the advocacy site. For example, if there are 10 users present on the advocacy site and 4 different users have comments on posts, then the Total Unique Commenters would be 4. |
Total Unique Likers | It denotes the total number of unique users who have liked posts on Advocacy. For example, if there are 10 users present on the advocacy site and 5 different users have liked posts, then the Total Unique Likers would be 5. |
Total Unique Shares | The total number of unique users who have shared. |
Total Unique User Logins | The total number of unique users who have logged in. |
Total Users | The total number of users who have enrolled in an advocacy site, and are not deleted. |
Total User Comments | Total comments by advocates on content posted to the advocacy site. |
Total User Likes | Total likes by advocates on content posted to advocacy sites. |
Total Users Read Announcement | The total number of advocate users who have read the announcement. |
Total Users Received Announcement | The total number of advocate users who have received the announcement. |
Total User Replies | The total number of replies to comments of a message. |
Volume of Shared Messages on Channel | The total count of messages that was shared natively on channel. |
X Video Views | The total number of views on X videos. |
X Impressions | The total number of X impressions. |
Public Site Advocacy Metrics
Metrics | Description |
Total Site Visits | Total Site Visits refers to the total number of times users have visited on advocacy site |
Total Share Attempts | Total number of share attempts done by users on all channels |
Total X Share Attempts | Total number of share attempts made by advocates on X |
Total Facebook Share Attempts | Total number of share attempts made by advocates on Facebook |
Total LinkedIn Share Attempts | Total number of share attempts made by advocates on LinkedIn |
Total Media Views | Total Media Views refers to the cumulative count of views received by all media content |
Post Views | Post Views refers to the number of times a specific post has been viewed by users on advocacy site |
Total Unique User Visits | Total Unique User Visits refers to the count of individual users who have visited to your advocacy site |
Public Site Advocacy Dimensions
Dimensions | Description |
Activity Date | Activity Date refers to the date on which a specific user interaction or activity took place on Advocacy site. |
Activity Time of Day | Activity Time of Day refers to the specific time of the day on which a particular activity or interaction occurred. |
Activity Day of Week | Activity Day of Week refers to the specific day of the week on which a particular activity or interaction occurred. |
Project ID | Project ID refers to a unique ID assigned to your Advocacy site |
Project Name | Project Name refers to a unique name assigned to your Advocacy site |
Browser Used | This dimension provides insights into the specific web browsers that users are employing to access |
Channel Reporting Capabilities
Capabilities | Social Channels | ||||
Facebook Profile | X | Facebook Page | |||
Number of likes/Reactions on channel | No (API Limitation) | Yes (Favorite) | Yes | No (API Limitation) | Yes |
Number of comments on the channel | No (API Limitation) | No (API Limitation) | Yes (No threads) | No (API Limitation) | Yes |
Exact comments on the channel | No (API Limitation) | No | No | No (API Limitation) | Yes |
Number of shares on a channel from advocates post | No (API Limitation) | Yes (Retweet) | Yes | No (API Limitation) | Yes |
Total engagement on channel | No (API Limitation) | Yes (Calculated by Sprinklr) | Yes (Calculated by Sprinklr) | No (API Limitation) | Yes |
Total Impression on channel | No (API Limitation) | Yes | Yes | No (API Limitation) | No(API Limitation) |
Reach on channel | No (API Limitation) | Yes (Calculated by Sprinklr) | Yes | No (API Limitation) | - |
![]() Note: For X and Linkedin the reporting data is based on the actual share done by the advocates but for Facebook & Instagram reporting data is only available if you click on the Share button and opens up the Publisher box to share a post due to API Limitations.
Note: For X and Linkedin the reporting data is based on the actual share done by the advocates but for Facebook & Instagram reporting data is only available if you click on the Share button and opens up the Publisher box to share a post due to API Limitations.