Using Cost & Rate Ads Benchmarks in Ads Reporting
Updated
To Analyze Benchmarks in Ads Reporting
Click the New Tab icon. Under the Sprinklr Marketing - Advertising tab, click Ads Reporting within Analyze.
On the Ads Reporting Home, select the custom dashboard where you want to view your reporting.
Proceed to add a widget to your dashboard. To learn more, see Add Reporting Widgets.
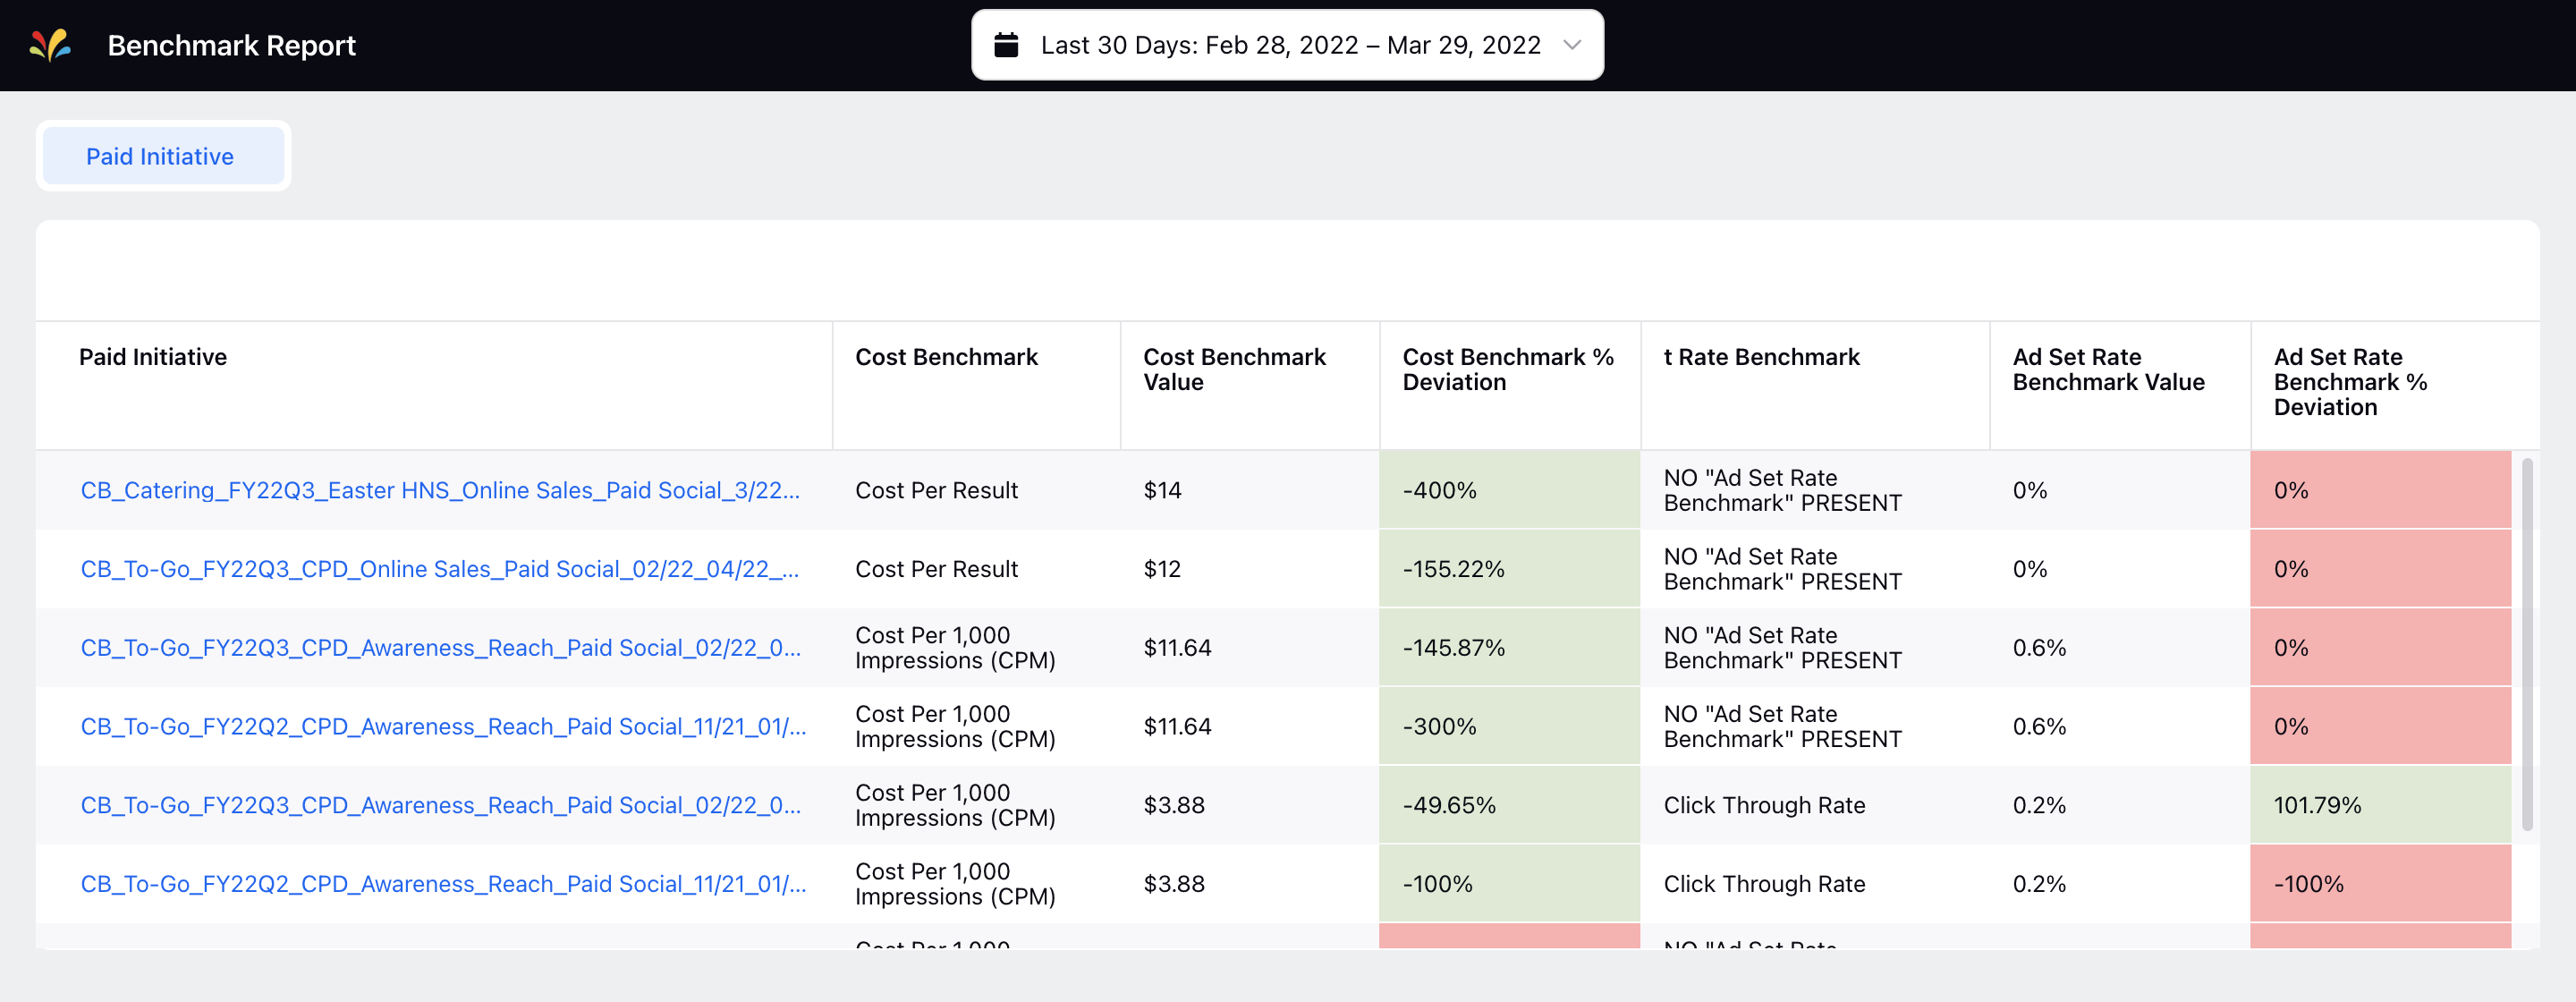
On the Add a Metric or Dimension window, you can select from the following metrics (M) and dimensions (D) to compare performance against the benchmark:
Cost Benchmark (D)
Cost Benchmark Value (M)
Cost Benchmark Percentage Deviation (M)
Rate Benchmark (D)
Rate Benchmark Value (M)
Rate Benchmark Percentage Deviation (M)
 Note:
Note: The above dimensions and metrics only work at the Paid Initiative, Ad Set, and Ad Variant levels. Dimensions of other higher and lower levels (Account, Ad Post) are not compatible with the benchmark dimensions and metrics.
You can use these metrics and dimensions as Filters for your widget excluding the Percentage Deviation metrics.
You can also configure Custom Metrics using the above metrics.
Percentage Deviation Calculation
Cost Benchmark Percentage Deviation - (Actual Value - Cost Benchmark Metric Value) / Cost Benchmark Metric Value x 100
Rate Benchmark Percentage Deviation - (Actual Value - Rate Benchmark Metric Value) / Rate Benchmark Metric Value x 100
Click Done in the bottom-right corner.
Click Add to Dashboard to view the cost and rate benchmarks report on your dashboard.