Customizable View in Campaign Monitoring
Updated
What is Campaign Monitoring?
The goal of voice campaign monitoring is to improve the ROI (return on investment) of the campaign by identifying areas that need improvement and making adjustments to increase conversions and customer engagement. It is an important aspect of any voice-based sales & service strategy and can help businesses reach their target audience more effectively.
Why Customizable View
The customizable view aims to enhance campaign monitoring by streamlining the user interface. Despite providing real-time analytics and reporting for effective campaign management, the current setup is burdened with over 50 redundant columns. This redundancy often confuses supervisors, hindering their ability to extract valuable insights. The purpose of this feature is to eliminate unnecessary information and optimize the user experience for more efficient campaign monitoring.
Supervisors and campaign managers can customize the columns and views on the Campaign Monitoring screen and they have the flexibility to:
add or remove specific columns/metrics,
create custom views,
and share them with other users within the platform.
This functionality enhances monitoring capabilities, enabling users to personalize their campaign monitoring experience to suit their individual requirements.
Key Benefits
Focused Data Analysis: By allowing users to customize the columns and views, the feature ensures that campaign managers and supervisors can focus on the most relevant and important metrics. This targeted analysis can lead to better decision-making and resource allocation, ultimately increasing ROI.
Reduced Information Overload: The current redundant information can be overwhelming and confusing. By eliminating redundancy and giving users the flexibility to choose what they see, the customizable view feature helps reduce information overload and makes it easier to extract actionable insights, thus improving the efficiency of campaigns.
User Satisfaction: This feature empowers campaign managers and supervisors by providing a customizable monitoring experience tailored to individual needs. This adaptability contributes to increased user satisfaction.
Creating and Managing Views
There are two views to the Customer Campaign dashboard, one is the left side view where we have Create View option explained as below and then there is right view which comprises of Agent view and Segment View which is explained at the later part of this document.
Creating a New View: Click the Options icon, go to Manage Views, and then select Create View.
After clicking Create View, you will need to input the view name and specify the relevant users, user groups, workspaces, or workspace groups with whom you want to share this view. Once entered, click Save.
Once the view is created, you can access it by clicking on the dropdown icon located at the top left corner.
Managing Columns: After creating the view, you can customize it by adding or removing specific columns or metrics through the Manage Columns option. To add a column, toggle it on, and vice versa. Columns in the Active Columns section will be displayed, while those not added can be found in the Inactive Columns section. This flexibility allows you to tailor the view to your specific needs.
List View and Card View: In the List view, all columns are presented, encompassing both static and dynamic values.
Conversely, the Card view exclusively showcases columns with dynamic values.
Updating View: Easily update your view by selecting Update View after clicking the Options in the top-right corner.
Make your desired changes on the Update View popup window, then click Save. Remember, it's crucial to save any adjustments made to the view. This also applies when managing columns—after adding or removing specific columns, ensure to save changes using the Update View option to confirm these modifications.
Deleting View: To delete a view, select the Delete View option after clicking the Options icon in the top right corner.
Agent and Segment View
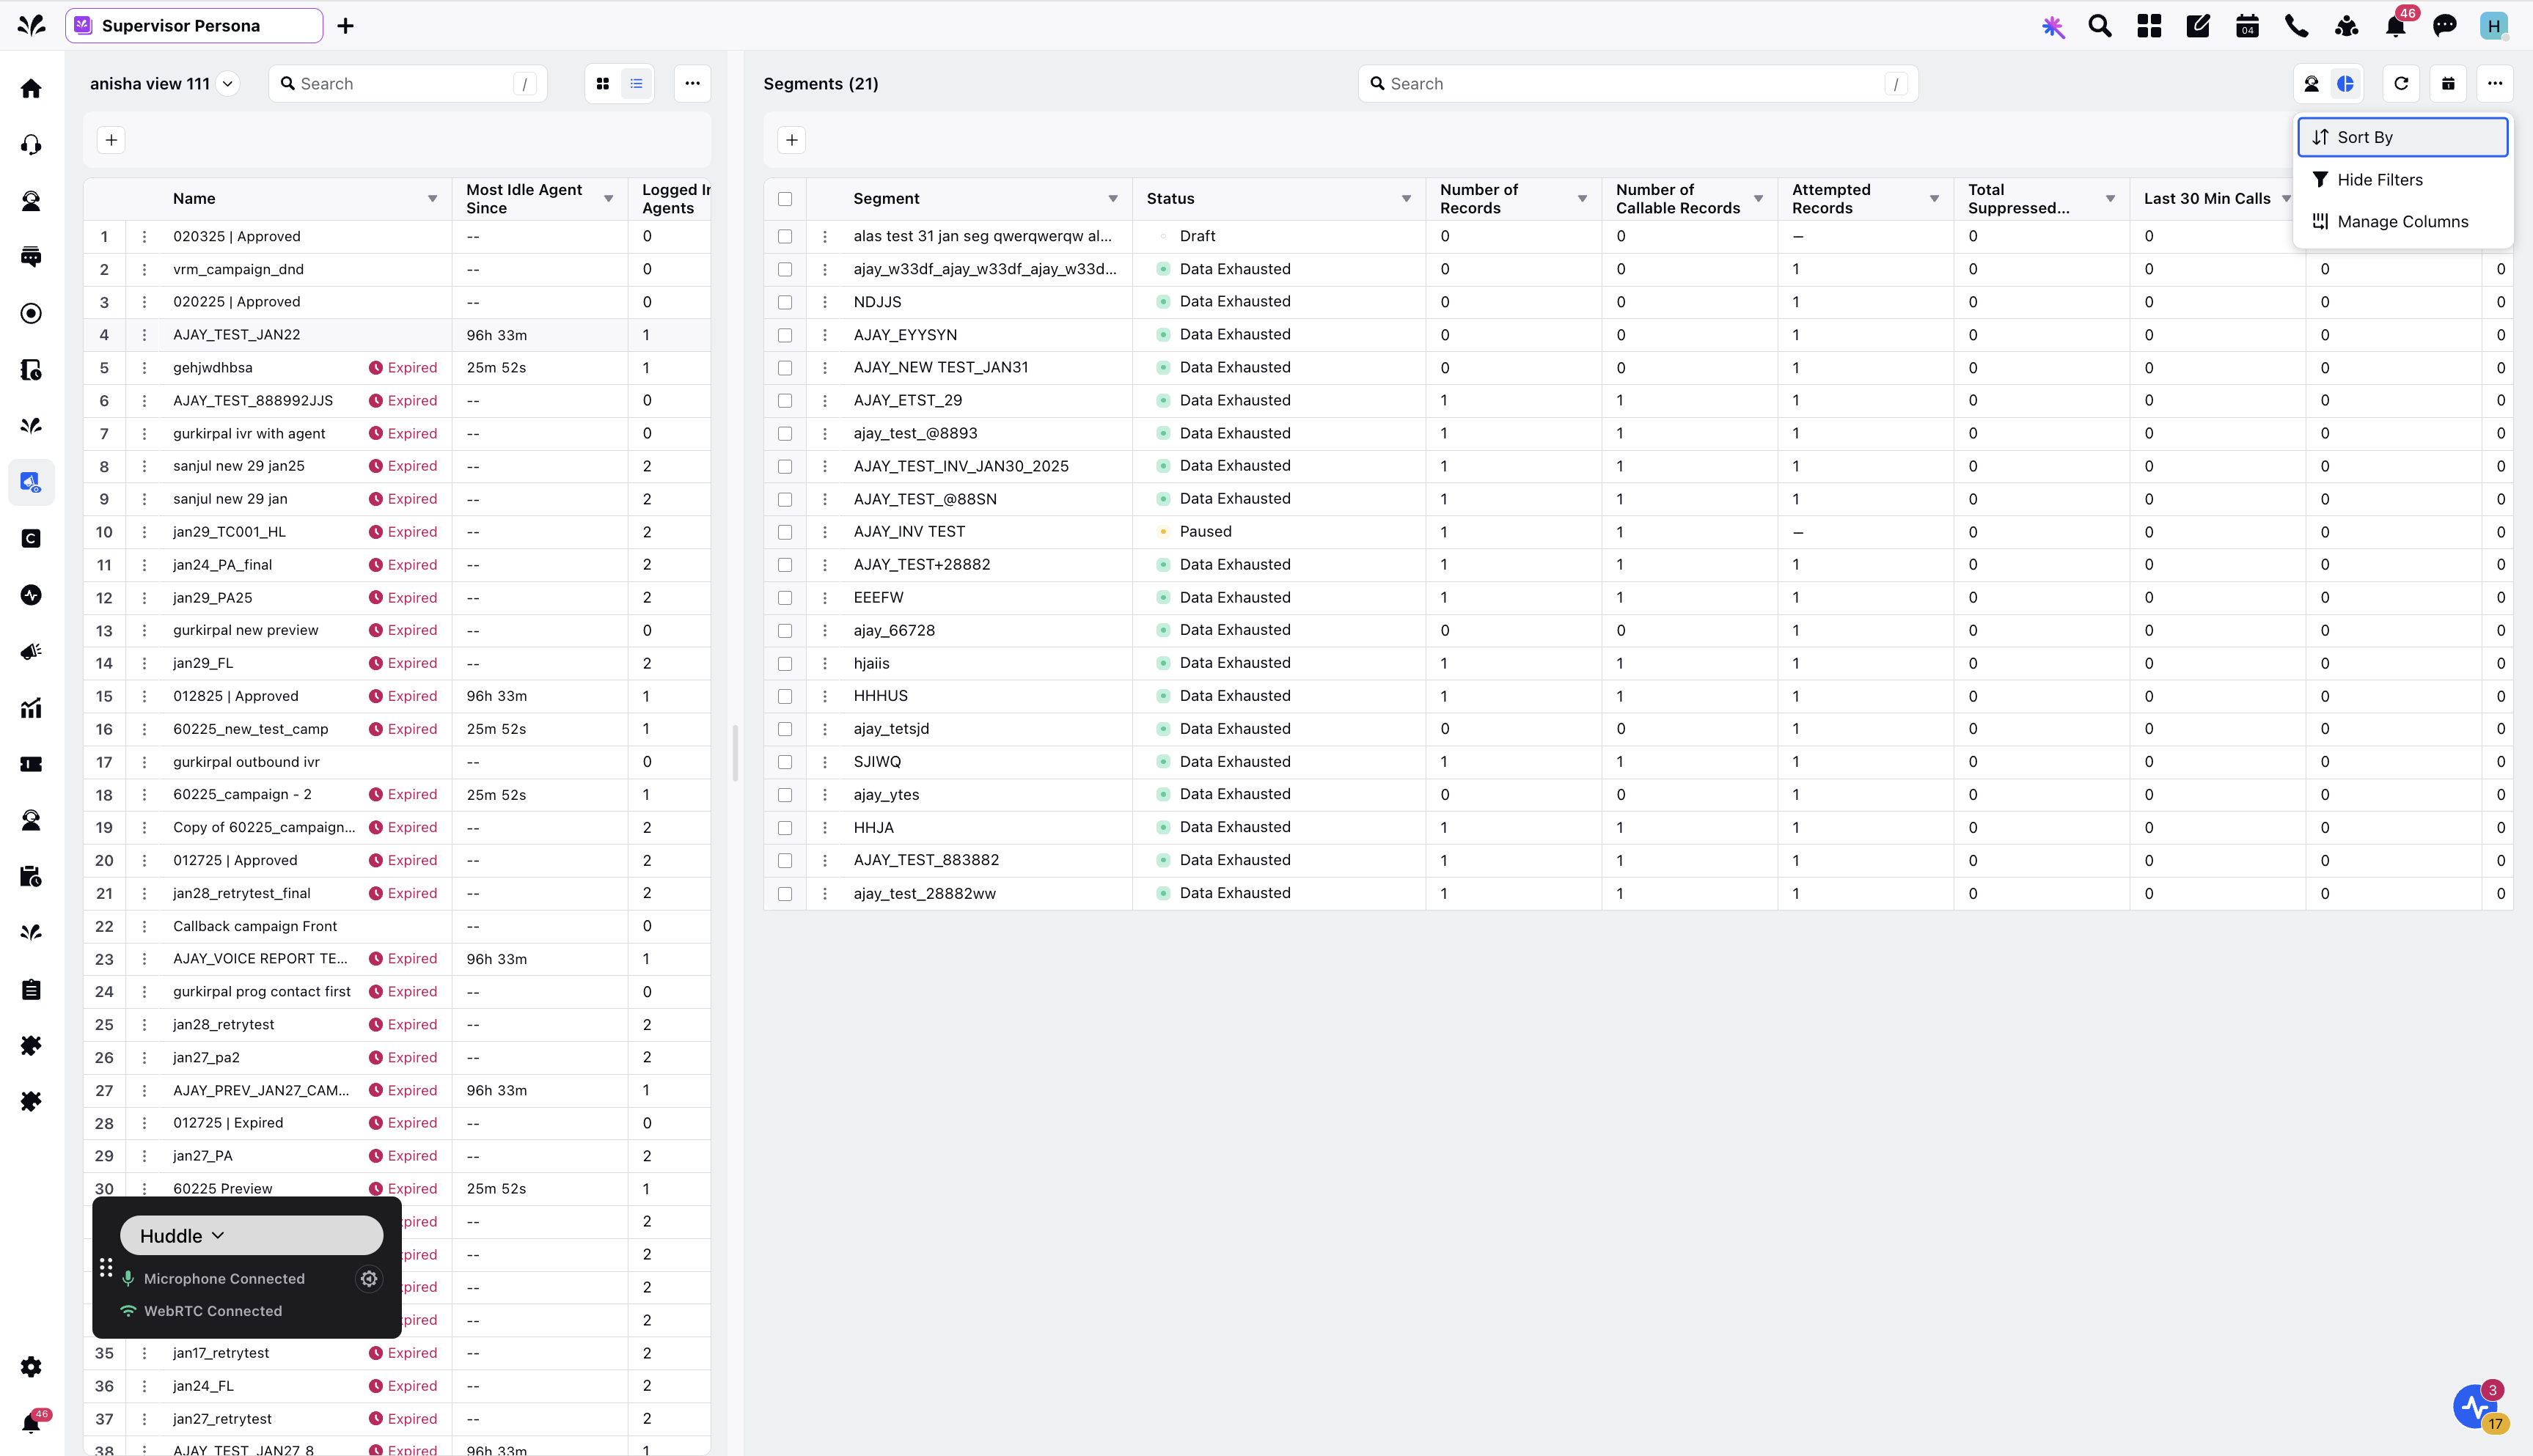
This view appears at the right side of the Voice campaign dashboard. There are two icons each for viewing the Agent View and Segment View as shown in the below image.
Segment View
This view enables supervisors to monitor the segment status and view multiple metrics in the segment monitoring screen, enhancing usability and reducing conflicts between teams. It contains segments, their statuses, and various metrics that can be selected.

The Segment View has the following options that you can use to perform tasks:
Sort By - You can organize or sort the segments based on a selected criterion, such as date, or alphabetical order.
Show/Hide Filters - You can add or hide filters depending on the status of the segments.
Manage Columns - You can add or reduce any matrics from the Manage columns. After creating the view, you can customize it by adding or removing specific columns or metrics through the Manage Columns option. To add a column, toggle it on, and vice versa. Columns in the Active Columns section are displayed, while those not added can be found in the Inactive Columns section. This flexibility allows you to tailor the view to your specific needs.
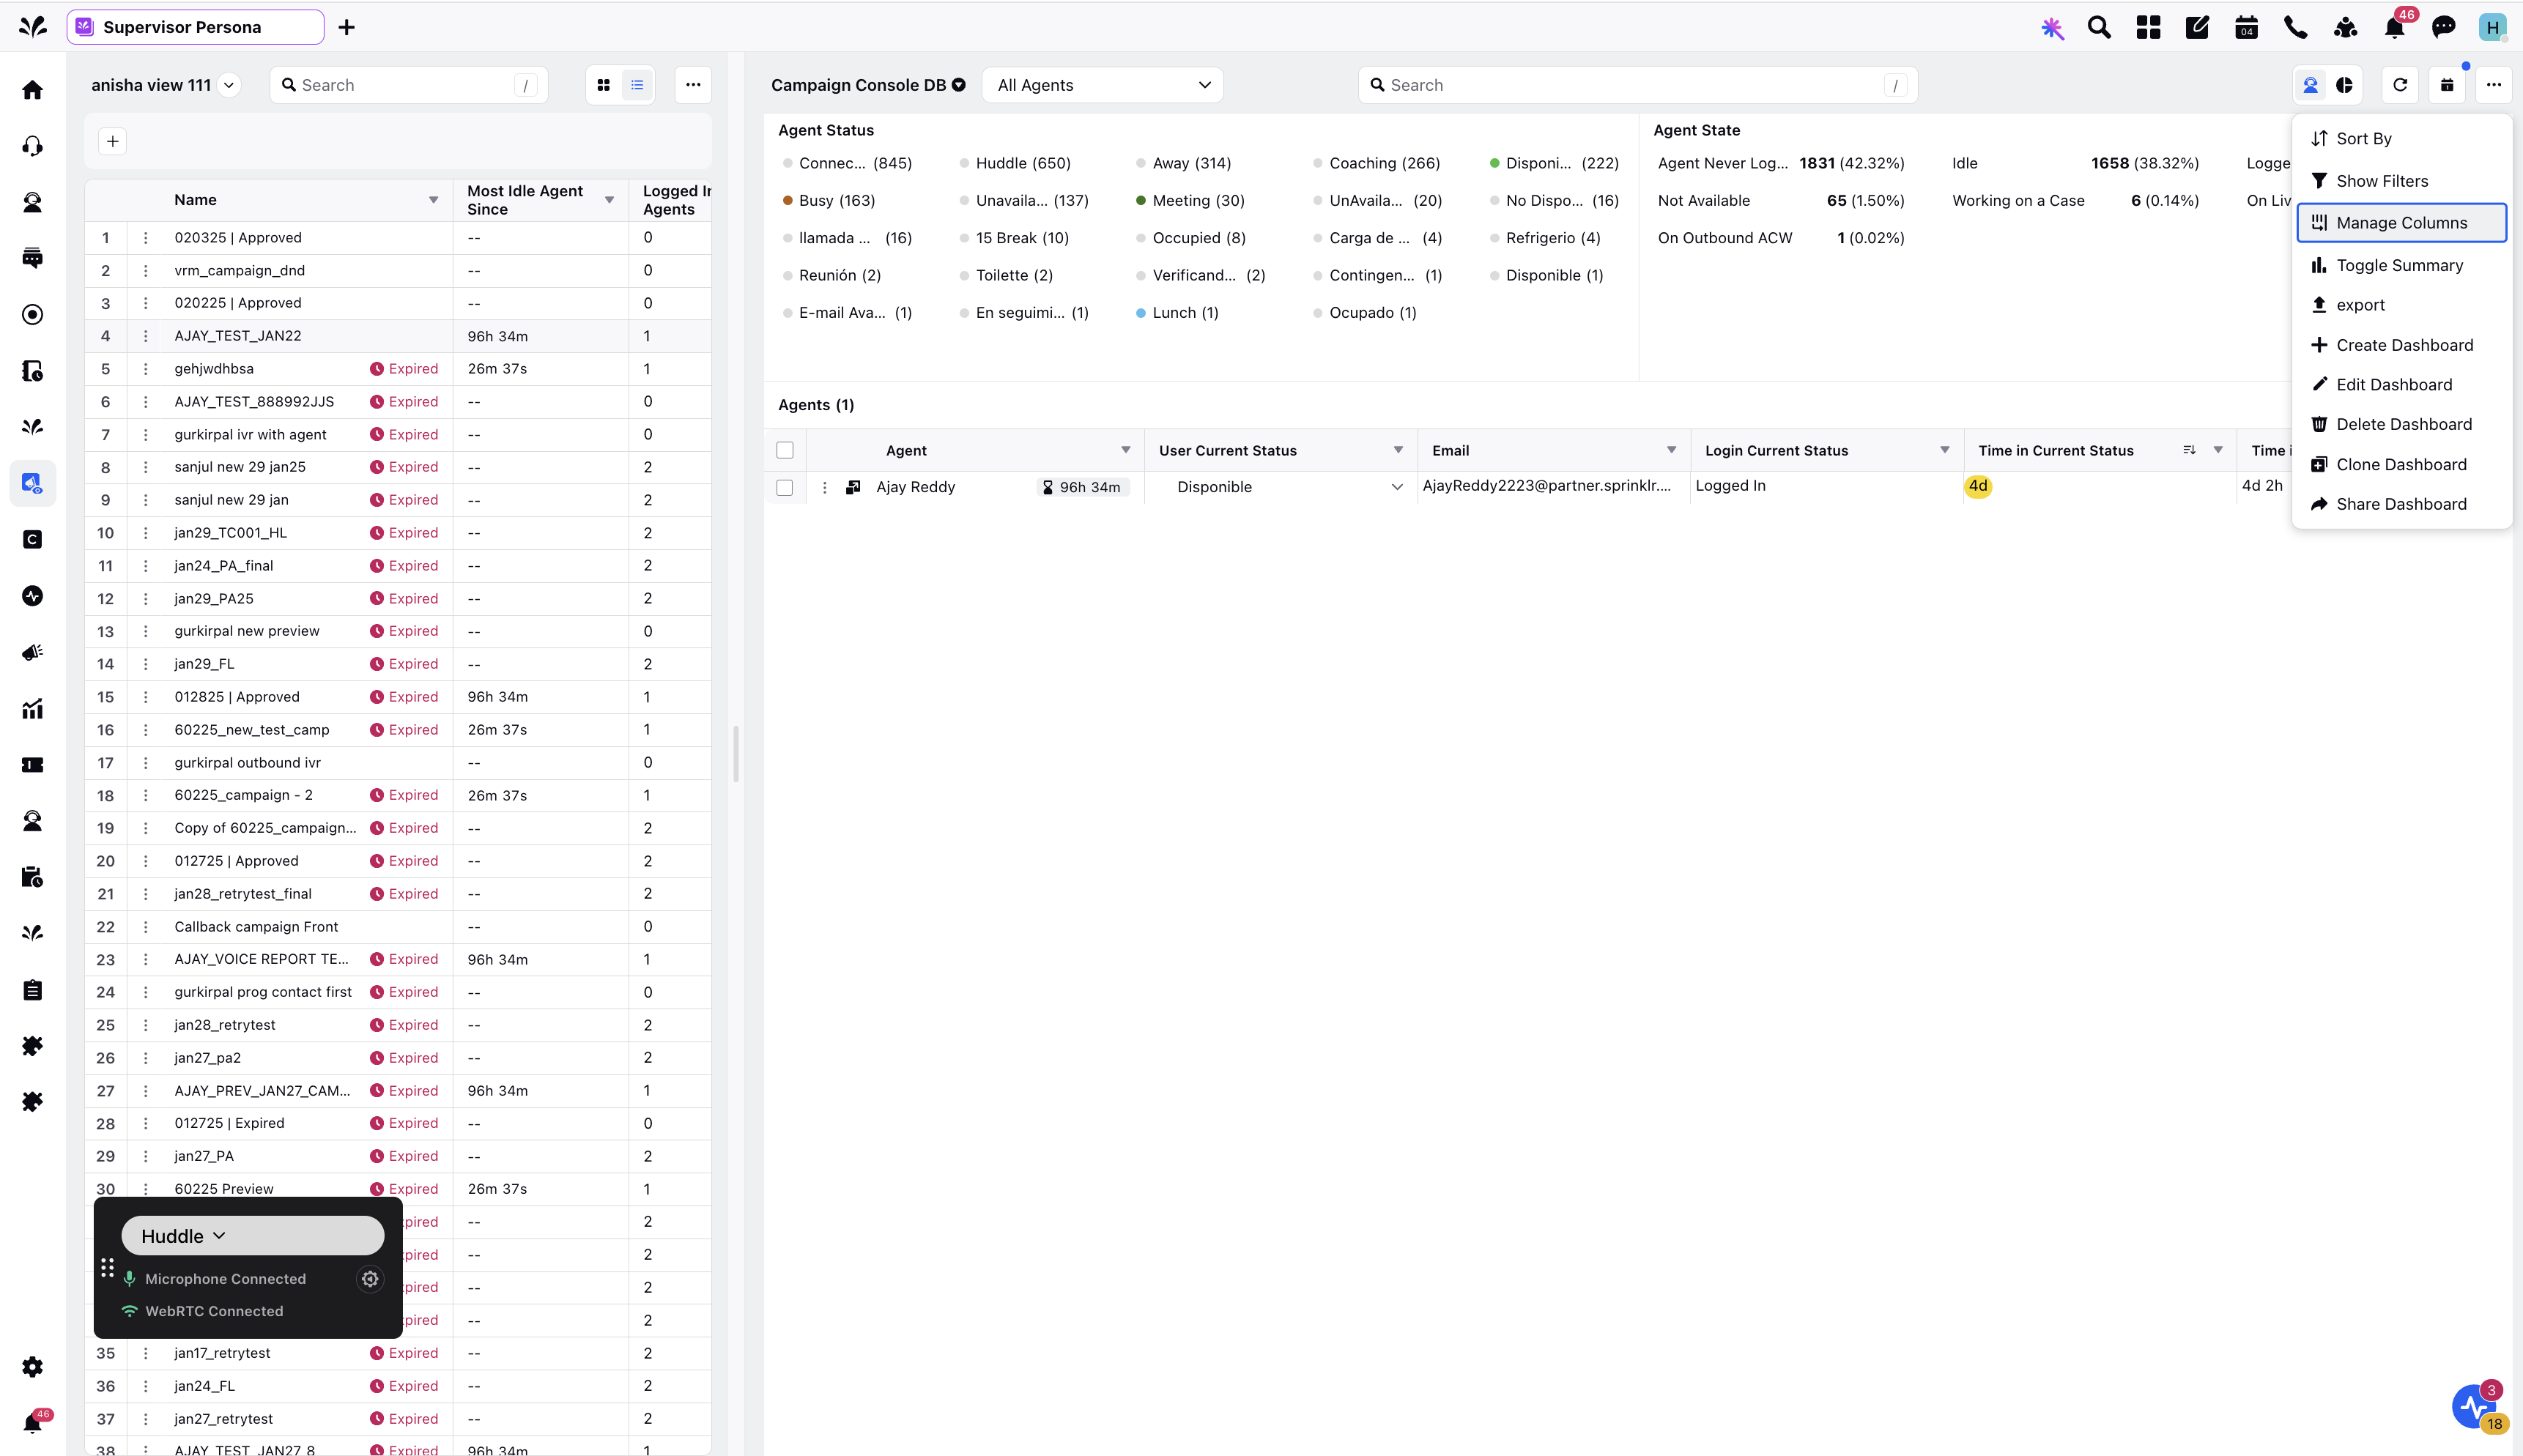
Agent View
Agent View enables the ability for supervisors to create and manage multiple dashboards in the agent monitoring screen, enhancing usability and reducing conflicts between teams. Supervisors can now configure dashboards tailored to their team’s needs without impacting other users. This Dashboard enables personalized dashboard views to view every agent associated with that Campaign.

The Agent View has the following options where you can perform tasks:
Sort By - You can organize or sort the segments based on a selected criterion, such as date, or alphabetical order.
Show/Hide Filters - You can add or hide filters depending on the status of the segments.
Manage Columns - You can add or reduce any matrics from the Manage columns. After creating the view, you can customize it by adding or removing specific columns or metrics through the Manage Columns option. To add a column, toggle it on, and vice versa. Columns in the Active Columns section are displayed, while those not added can be found in the Inactive Columns section. This flexibility allows you to tailor the view to your specific needs.
Toggle Summary - You can view the summary of Agent Status and Agent State on the top which shows the number of agents in each state and status.
Export - You can download the agent monitoring report as per the Start Date and End Date.
Create Dashboard - You can create a Dashboard as per your criterion with this option.
Edit Dashboard - You edit a newly created Dashboard or an existing one with this option.
Delete Dashboard - You can delete a Dashboard with this option.
Clone Dashboard - You can clone a Dashboard with this option.
Share Dashboard - You can share the Dashboard with multiple users or workspaces with this option.
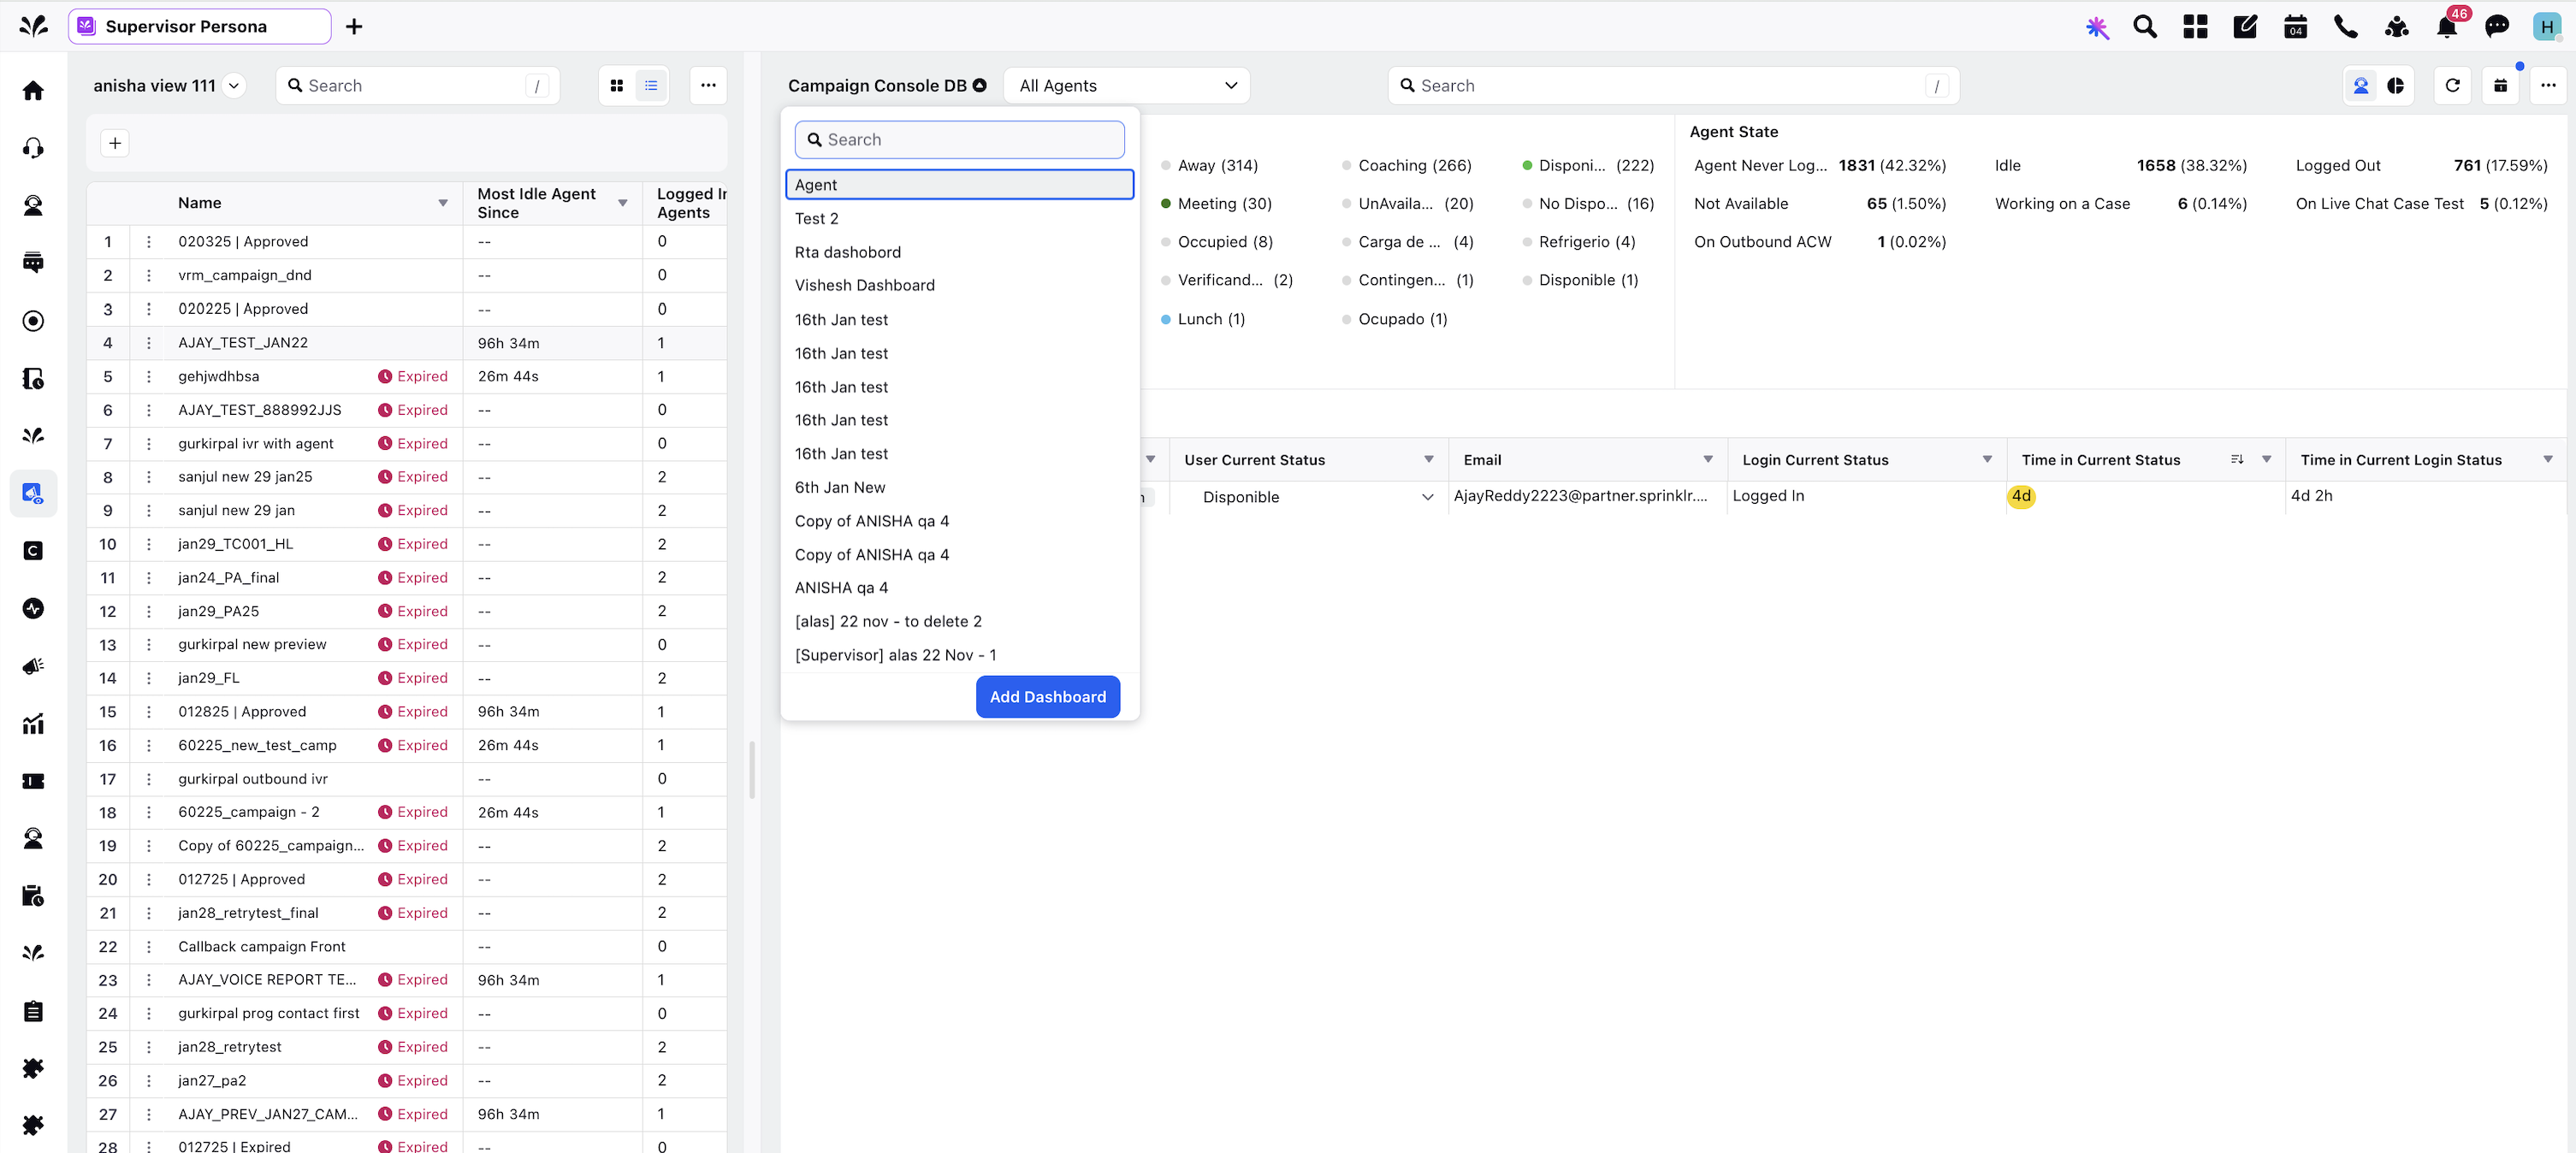
You can view all the created dashboards from the drop down list appearing at the top left corner of the screen and can select the dashboard amongst the already created ones appearing under this list or can choose to create a new dashboard from the Add Dashboard option appearing on this screen.
