Manage Reporting Dashboards
Updated
In this article, we will walk you through all the options available under the 3 dots of the reporting dashboards and the different actions you can take to manage your dashboards.
Share dashboard
Once you have created a dashboard, you can share it internally as well as externally. You can also export the dashboard in different formats and store the Sprinklr exports in external storage environments like FTP, SFTP, and S3.
Let's take an example of how to share a dashboard. Open any custom dashboard that you want to share and follow the steps below –
On the reporting dashboard, click the 3 dots icon in the top right corner and click Share in the options.

This will open the Share Dashboard popup window where you can define the sharing details for the dashboard, such as –
Visible in all workspaces: Selecting this option will share the dashboard in all workspaces.
Workspaces: Select workspace/workspaces from the drop-down menu. Users of these workspaces can edit or delete a dashboard, add widgets, and change filter configurations.
Users/User Groups: Select the users OR user groups from the drop-down menu. These users will also be able to edit or delete a dashboard, add widgets, and change filter configurations.

Once done, click Share in the bottom right corner.
Edit dashboard
Once you have created a dashboard, you can edit the name and other properties by editing the dashboard.
On the reporting dashboard, click the 3 dots icon in the top right corner and click Edit in the options.
This will open the Edit Dashboard popup window where you can edit the following details –
Dashboard Name
Folder
Tags
Edit layout
With this option, you can edit the layout of your reporting dashboard by changing the positions of the widgets.
On the reporting dashboard, click the 3 dots icon in the top right corner and click Edit Layout in the options.
This will open the Dashboard Editor window where you can drag and drop the widgets to edit the layout of your dashboard. You can move the widgets across sections as well.
.gif)
On the dashboard, you can also drag and drop the widgets to change the position as shown below –
.gif)
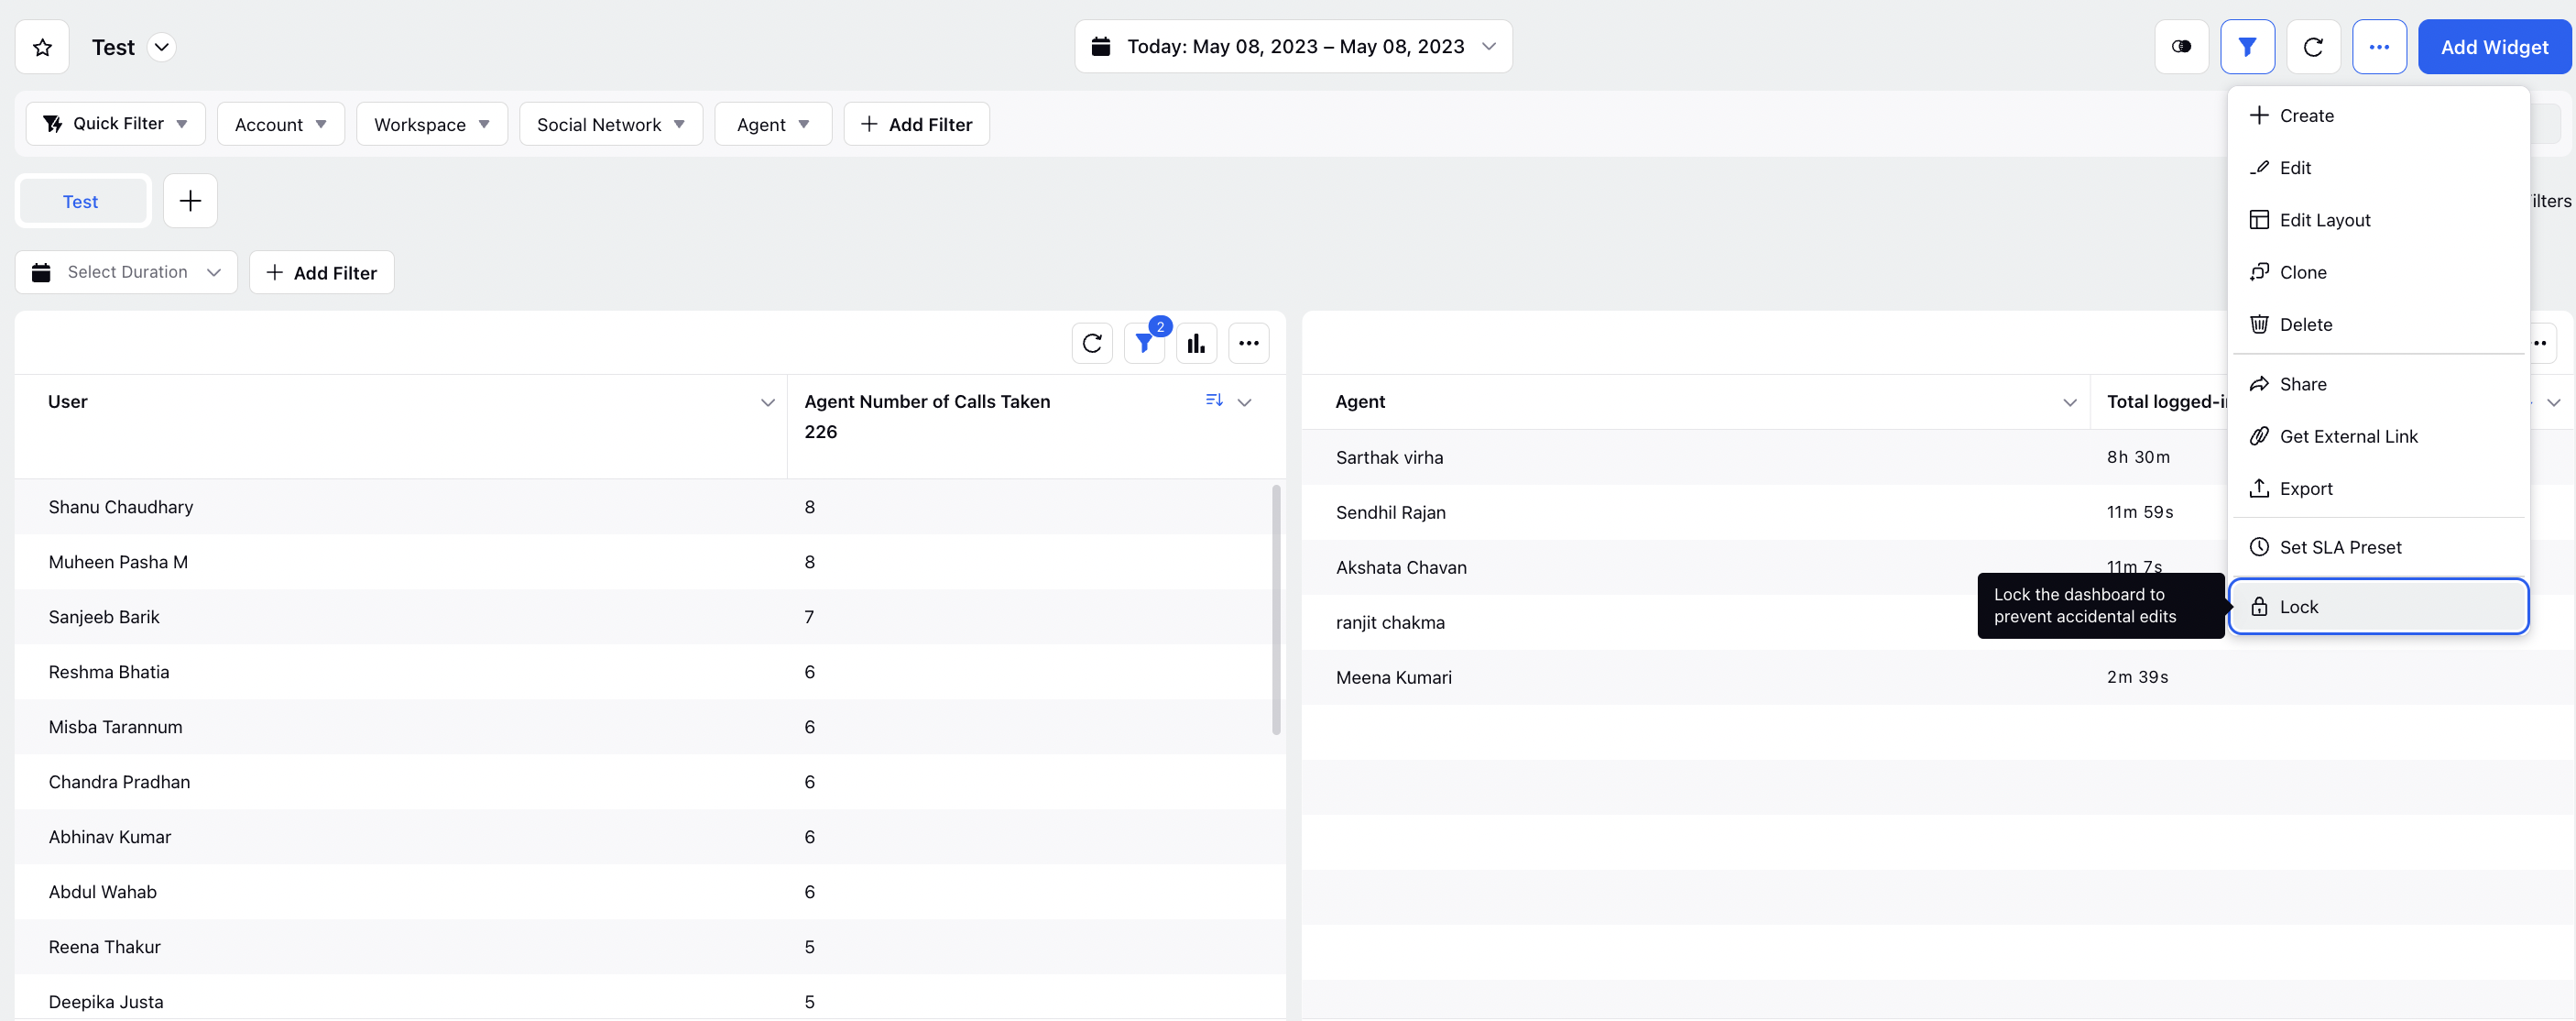
Lock dashboard
In reporting dashboards, you also have the option to lock the dashboard to prevent changes from being made to it by any other user.
On the reporting dashboard, click the 3 dots icon in the top right corner and select Lock in the options to lock your dashboard.
User-level dashboard filters on a locked dashboard
Regarding the filter functionality in a locked dashboard, other users will have visibility into the defined filter parameters. However, the filter will be disabled for editing purposes. However, users can still apply filters for values that have been marked as Favorites without selecting specific values.
Any changes made in this scenario will only be reflected for the same user. To ensure changes are applied universally across all users, an unlocked dashboard must be used.
Delete dashboard
If you want to delete your reporting dashboard, click the 3 dots icon in the top right corner and click Delete in the options. Please note that this action is not reversible.

Clone dashboard
Once you have created a reporting dashboard, you can make a clone of that dashboard.
On the reporting dashboard, click the Options icon in the top right corner and select Clone from the options.

This will open the Clone Dashboard popup window where you can name the cloned dashboard. You can check Clone dashboard share configuration option to clone the sharing properties as well.

Export dashboard
In reporting dashboards, you can export the dashboard in different formats and also store the Sprinklr exports in external storage environments like FTP, SFTP, and S3.
Open any custom dashboard of which you want to take the export and follow the steps below –
On the reporting dashboard, click the Options icon in the top right corner and select Export from the options.
This will open the Export Dashboard popup window where you can define the export details for the dashboard, such as –
Select the dashboard sections to export
Select export type
Define PDF layout and number of PDFs

You can also store the Sprinklr exports in external storage environments like FTP, SFTP, and S3 by selecting View Advance & Scheduled Export Settings option. Please refer to the Scheduled Exports article to learn more about it.
Generate presentation
Sprinklr also allows you to generate a presentation of your dashboard directly from within the dashboard.
On the reporting dashboard, click the Options icon in the top right corner and click Generate Presentation in the options.
This will open the Export Dashboard popup window where you can define the dashboard sections for which you want to generate the presentation. Export type will be selected as Presentations by default.

Export dashboard mapping in dashboard
Sprinklr's Reporting dashboards have a way to give you an export of mapping with the list of the dimensions and fields that you could use in your API call to make the query. These mapping will be used in the case when you are recreating the widgets in BI tools, such as Tableau, Google Data Studio.
Export Dashboard Mapping will generate a field mapping in CSV or Excel sheet for that dashboard.
To export the dashboard mapping, click the 3 dots icon in the top right corner and click Export Dashboard Mapping in the options.

![]() Enablement note: To get this capability enabled in your environment, please work with your success manager.
Enablement note: To get this capability enabled in your environment, please work with your success manager.
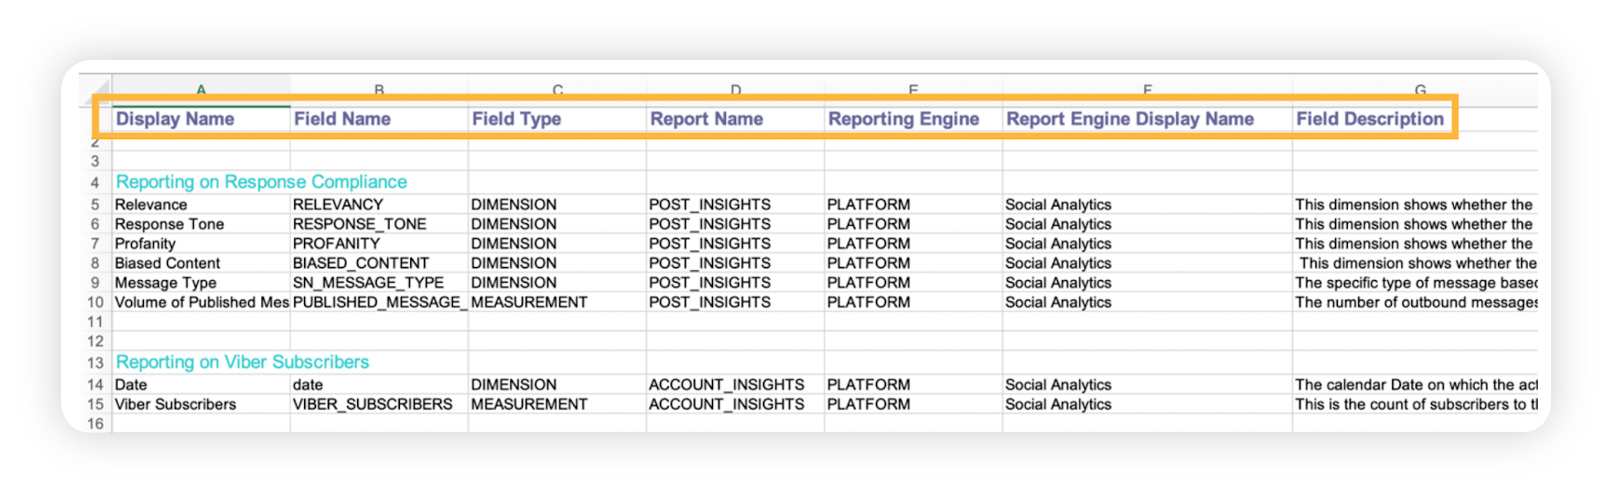
Result
The downloaded CSV sheet with mapping will have the following fields in it –
Display Name
Field Name
Field Type
Report Name
Report Engine
Report Engine Display Name
Description
Filters Used
Custom interval
Using the Custom Interval feature, you can customize the starting date of the month, the day of the week, the desired starting date of the quarter, or the calendar year within the dashboard. For more information about Custom Interval, please refer to Define custom interval within the dashboard.
Get external link
If you want to share the dashboard to the user who does not have a Sprinklr account (external user), you can share it by generating an external link of that dashboard. For more information about External Link, please refer to Generate an external shareable link.