How to add Annotations on Graphs in Reporting
Updated
Annotations give you the ability to add notes to graphs and charts. They are attached to the dates themselves, so can only be seen in a graph or chart where 'Date' is the primary dimension. Annotations can be created in two ways: either from the Settings section of the Left-Hand panel at the dashboard level or directly from a widget. The annotation will appear as a small box on the graph that expands when hovered over.
Users must have the appropriate Admin permissions to access this feature. |
To Add an Annotation
Click the New Tab icon
. Under the Sprinklr Marketing - Advertising tab, click Ads Reporting within Analyze.
On the Reporting Home, click the Options icon
in the top-right corner and select Annotations.
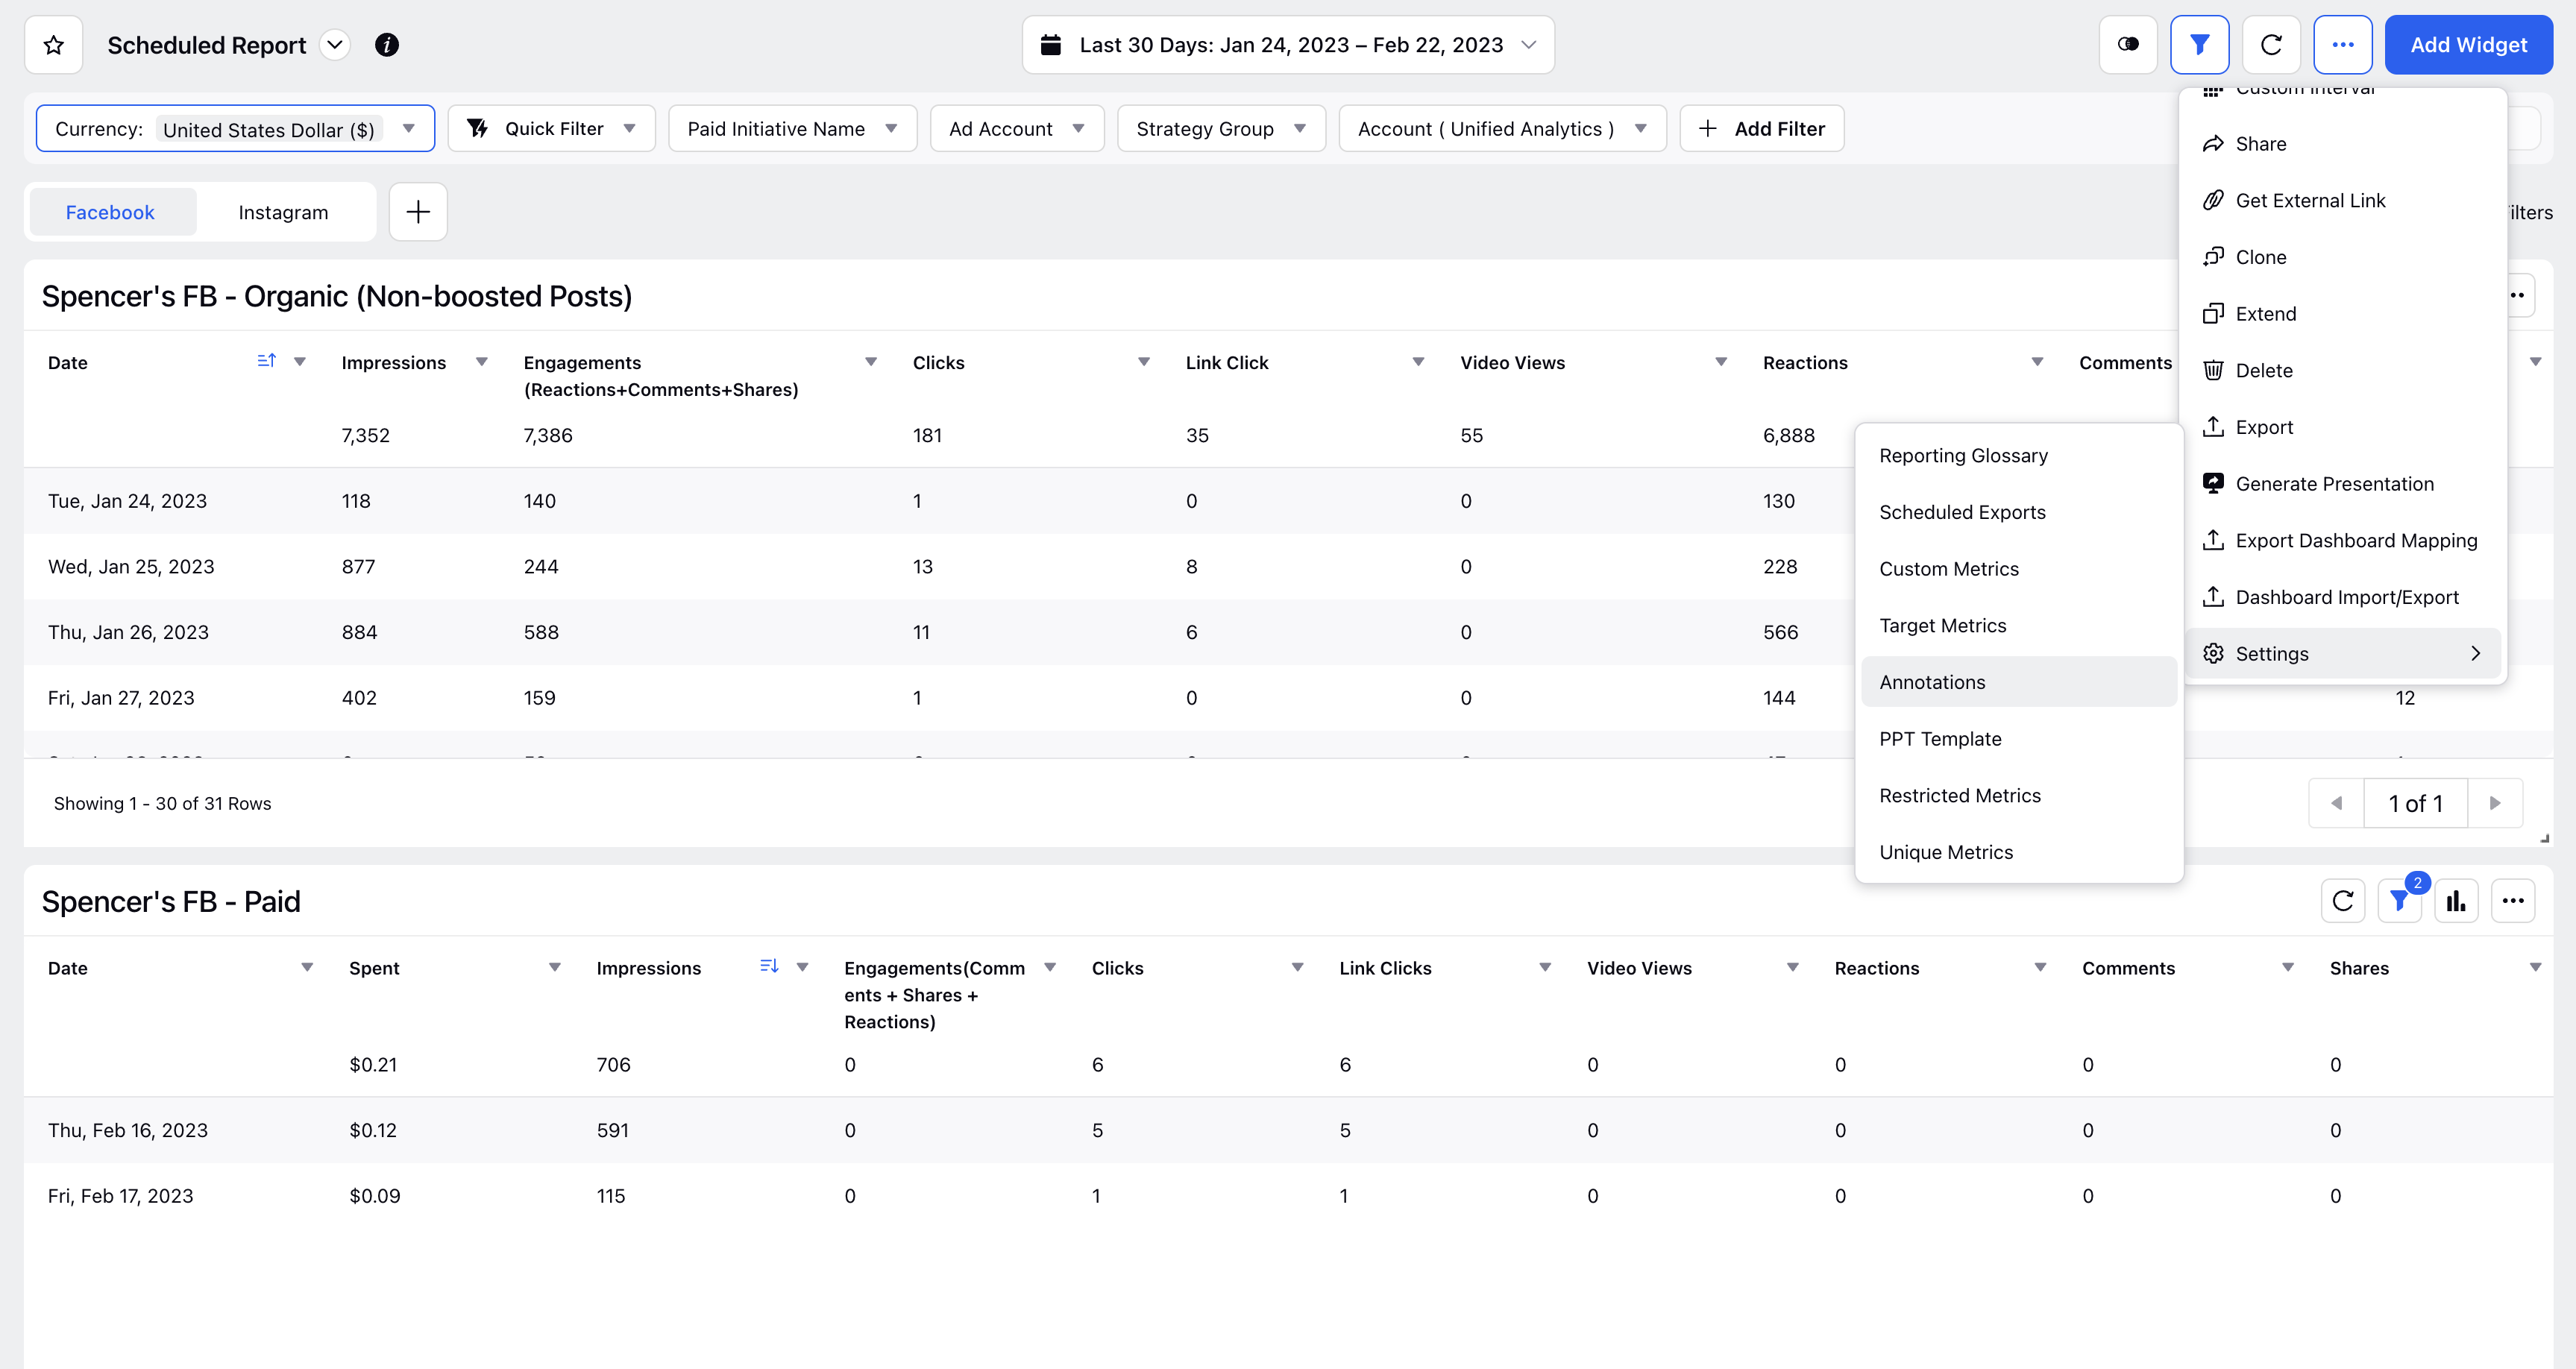
If you are on a Reporting Dashboard, click the Options icon
in the top-right corner and scroll down to Settings. Hover over Settings and select Annotations.

4. On the Annotations window, click Add Annotation in the top right corner.
5. On the Annotation pop-up window, select a specific Date where you would like the annotation to appear and what would you like the Note (100-character limit) to say.
6. Click Create in the bottom right corner to create an Annotation.
To Share Annotation
On the Annotations window, hover over the desired annotation Options icon
and select Governance.
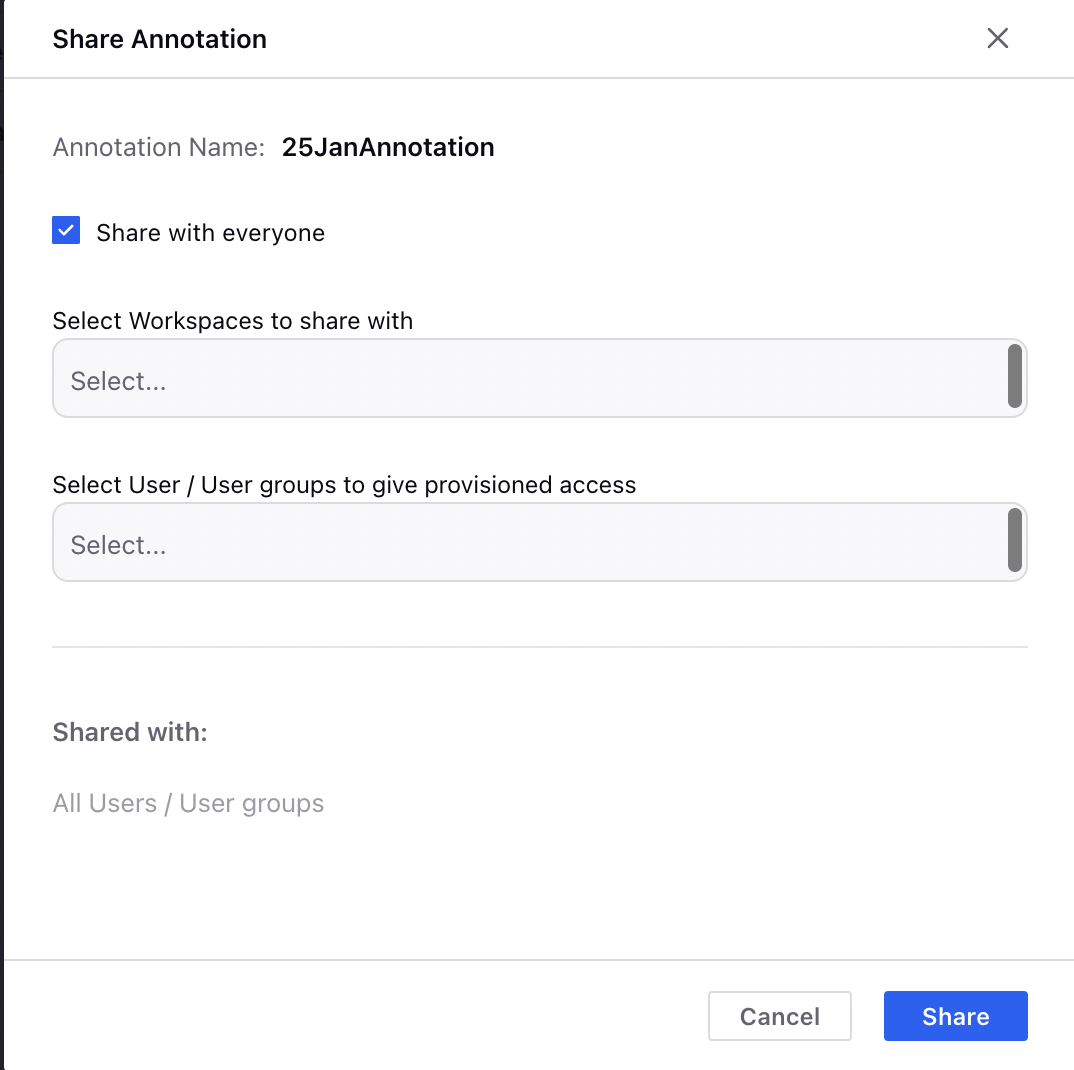
On the Share Annotation pop-up window, select the Workspaces and User / User groups you want to give access to. You can also check the box alongside Share with everyone to share the annotation globally.
Click Share in the bottom right corner.

To Add an Existing Annotation to Widget
On the Ads Reporting Dashboard window, hover over the desired widget Options icon
in the top right corner and select Annotations.
2. On the Annotations pop-up window, select the annotation(s) you want to apply on your widget. Click Save.
To Create and Add Annotations Directly on Widget
On the Ads Reporting Dashboard window, click the Specific Data Point within a Widget you wish to mark.
On the Drill Data pop-up window, click the Add Annotation option.
3. On the Add Annotation pop-up window, fill in the details as desired. Click Save in the bottom right corner. The Note must not exceed 100 characters while Adding Annotation.