Geo Map Widget in Display and Presentations
Updated
Introduction
A Geo Map widget in Display/Presentations provides an easy-to-understand visual representation of data across different geographic regions. Each country is represented by a shade to reflect the value of the data being displayed with scaled gradient highlighting information in easy-to-understand visual language.
It provides a high-level view of data across the world, and you can now choose to drill down into a specific area or country from the design tab to see the state-level data pertaining to a specific location.
Note: The Geo map widget now supports both Listening Insights and Listening Explorer (Quick Search) to visualize the data depending upon your selection.
Steps to Add the Widget
1. Navigate to the widget library and select World Heat Map.

2. Input the data configuration as desired from the saved presets or new configuration.

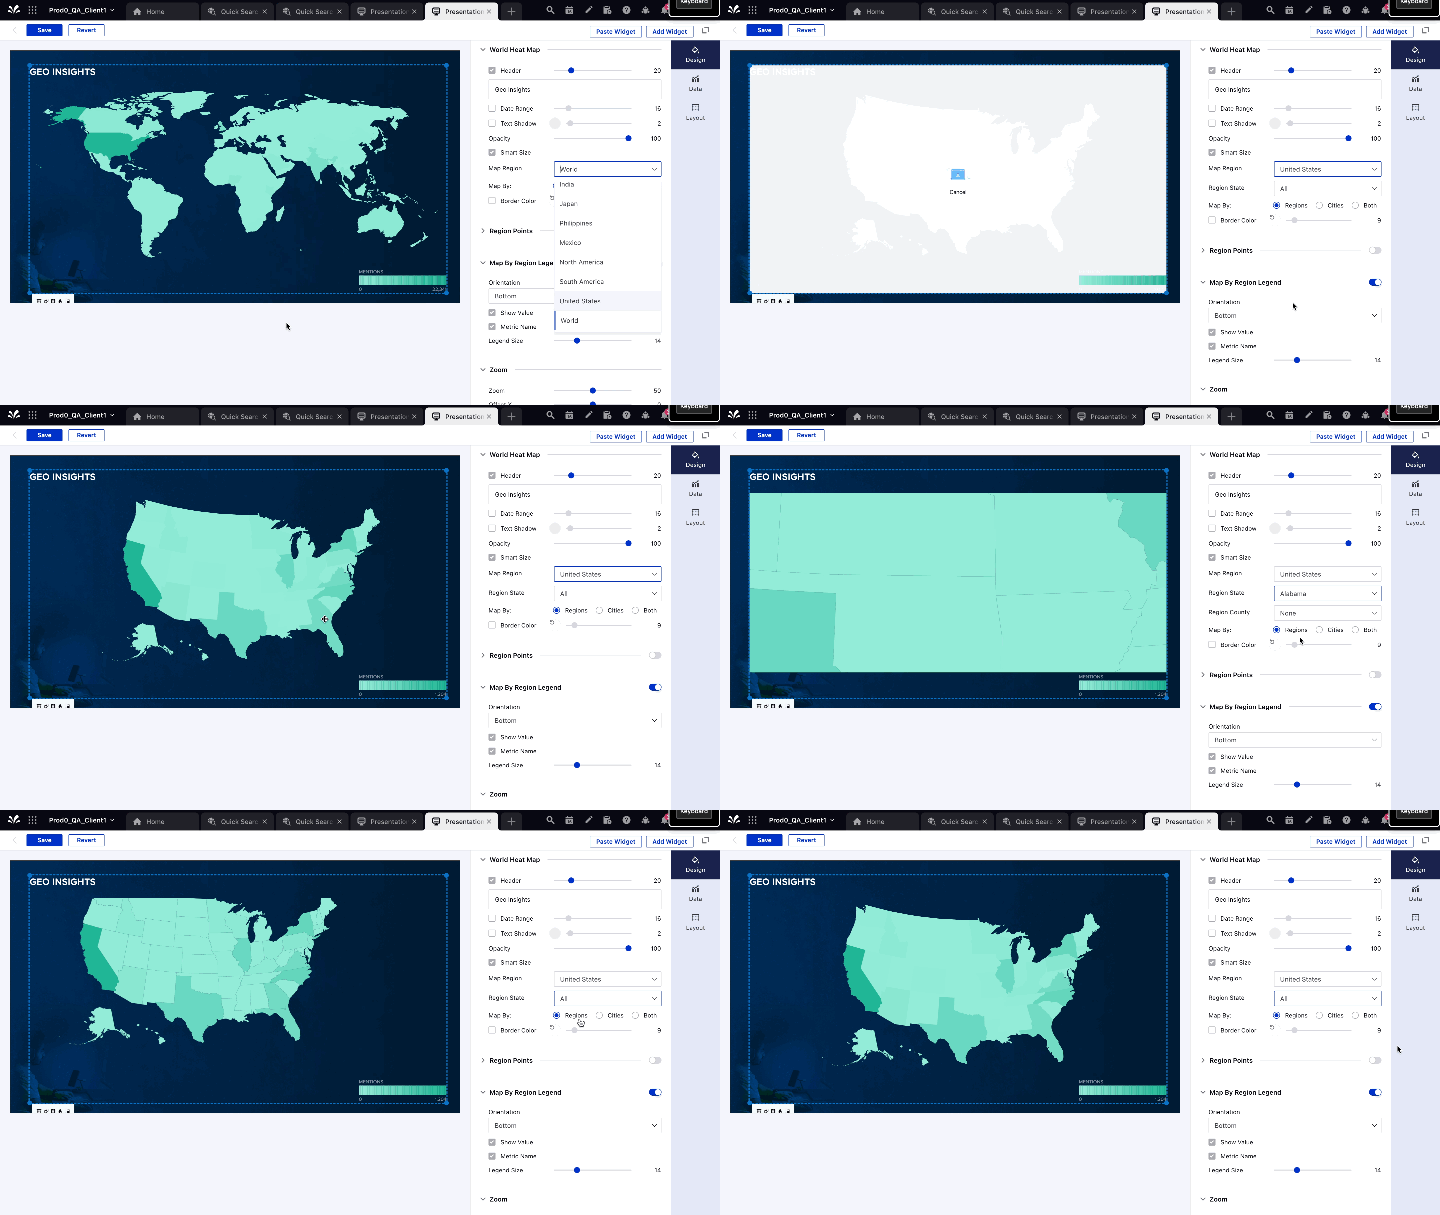
3. Upon successful creation, a widget is created outlining the color gradient of mentions across different countries.

4. You can choose to drill down and view certain country maps (state-wise distribution) by navigating to the Design tab and a selecting region from the Map Region dropdown.

4.1 Upon selection, the map now starts to showcase specific state-wise distribution of specific regions.

5. Additionally, you can further customize the widget with appropriate markers and groupings using the Region Points and Map by Region toggle.
