Threshold-based Visualizations
Updated
Introduction
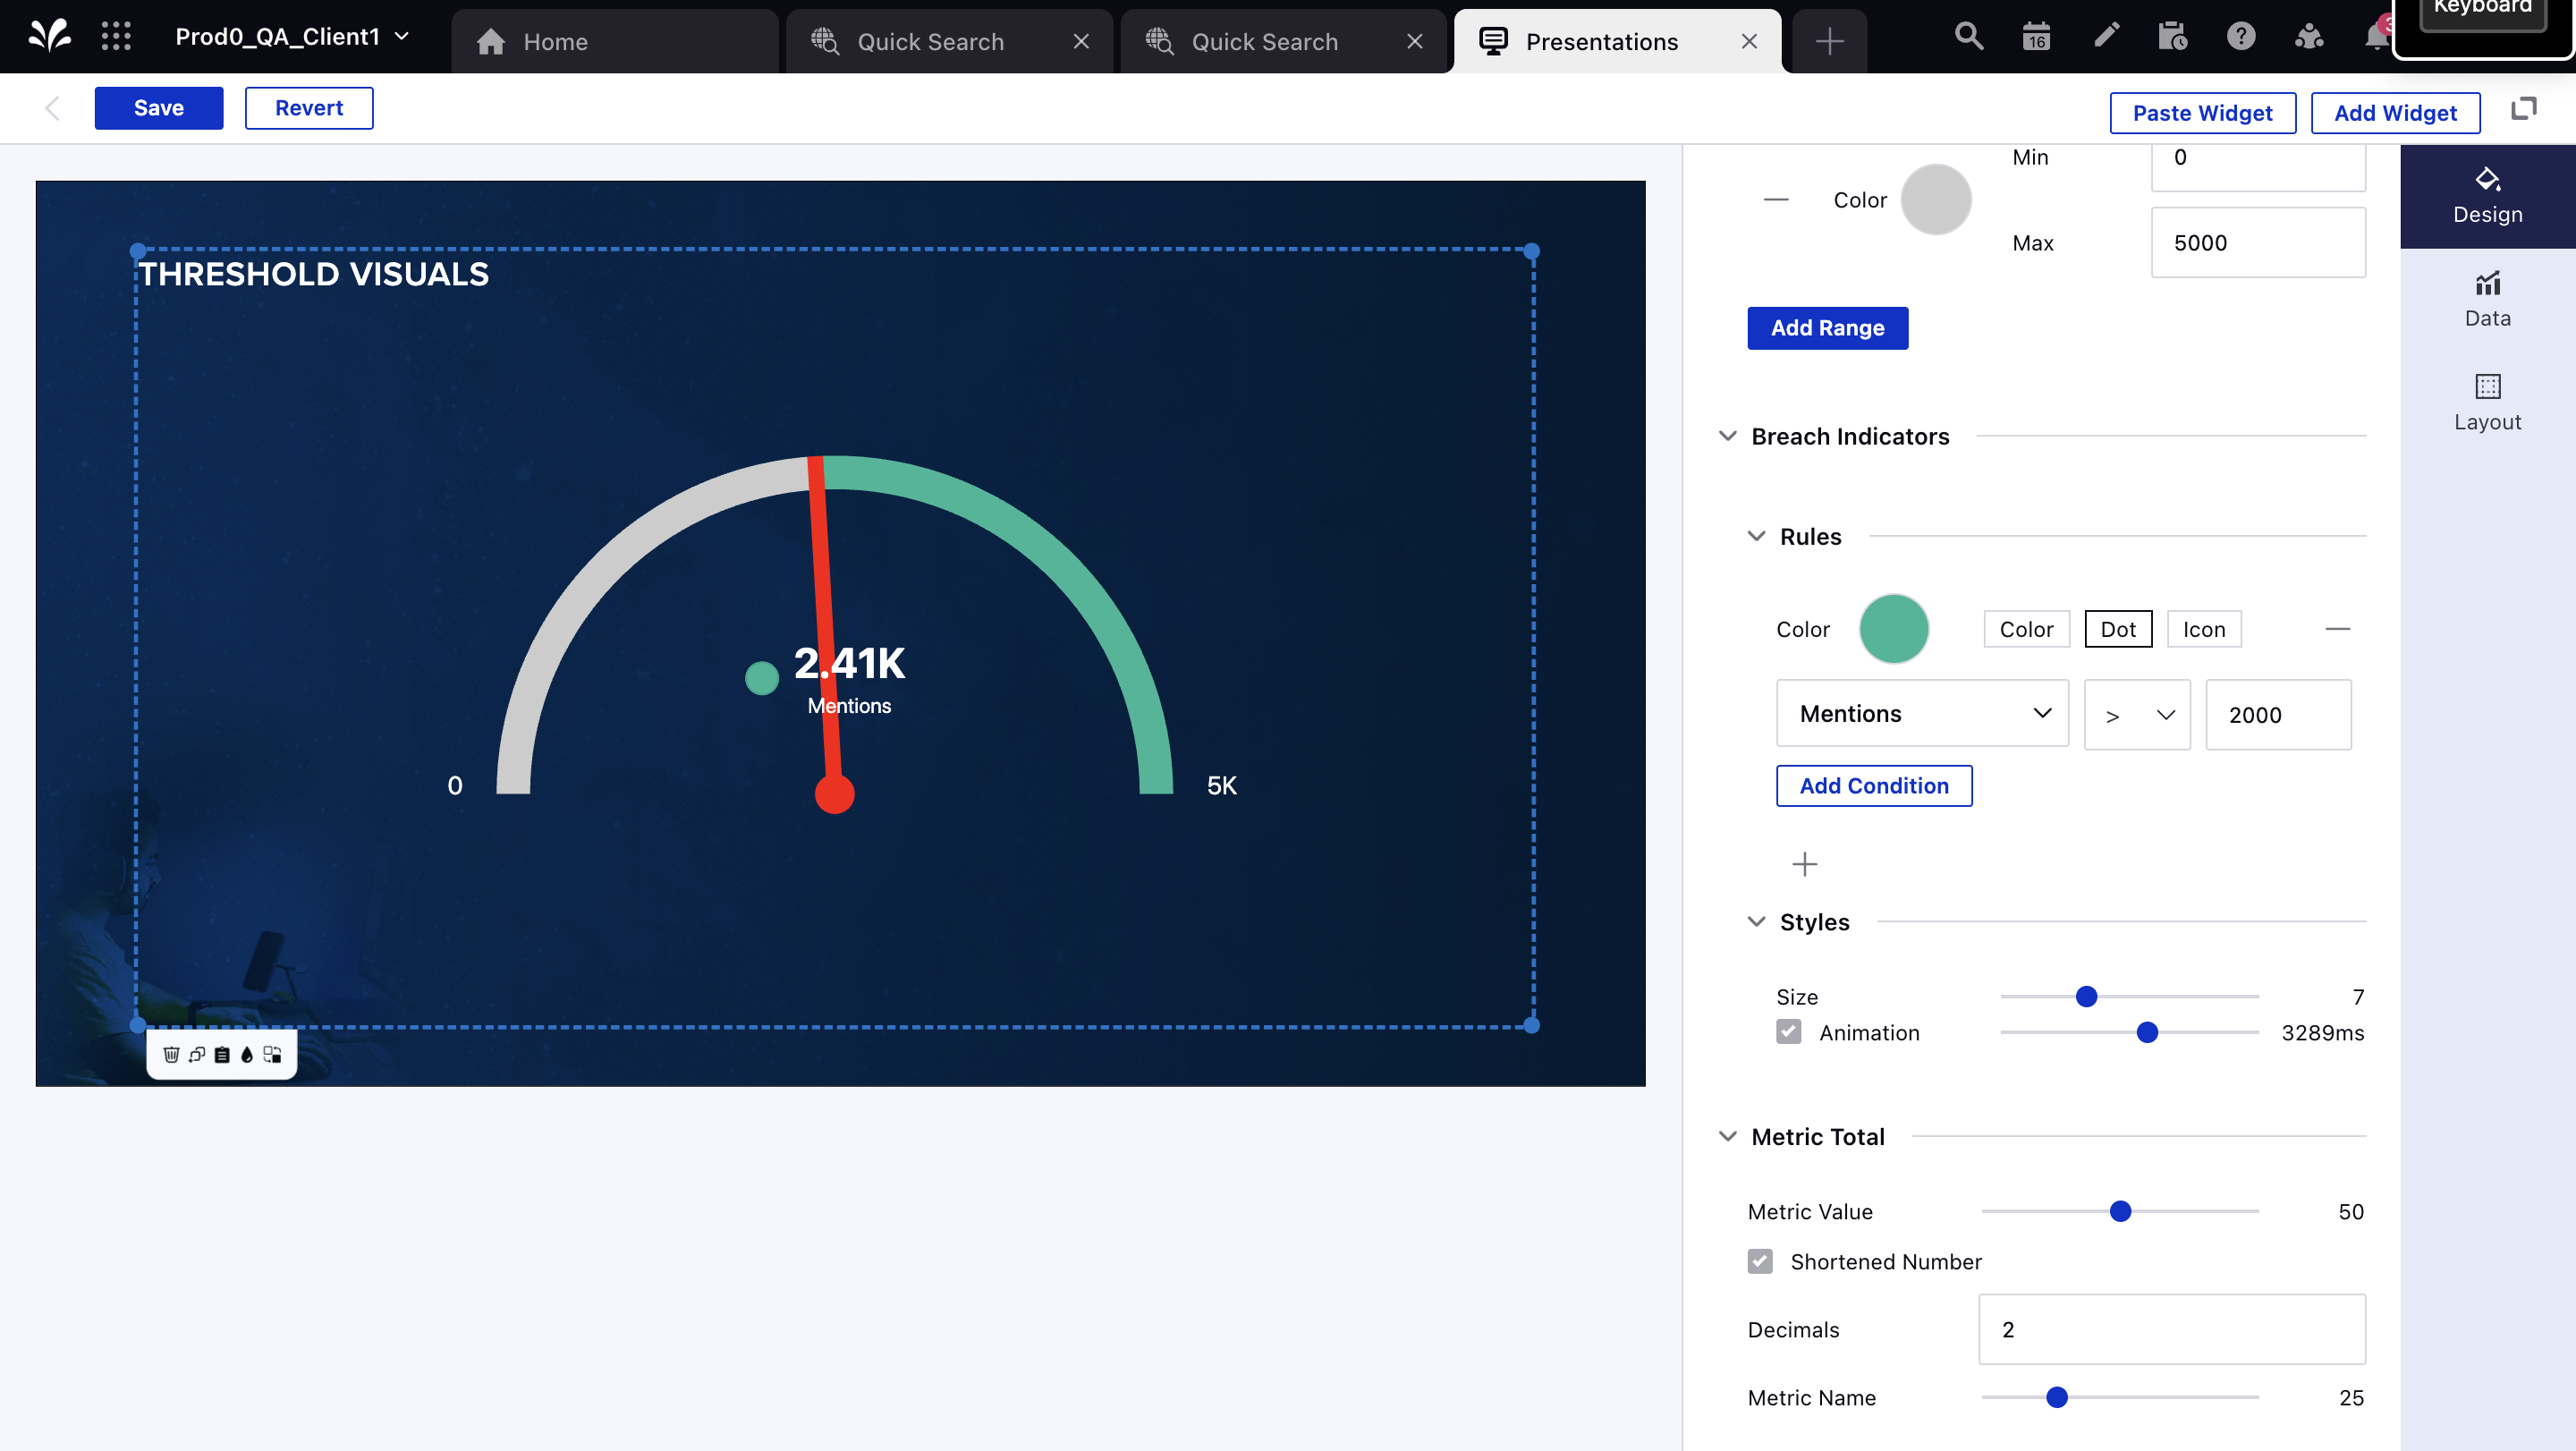
Supervisors and team leaders can now visualize the progress and effectiveness towards certain set benchmarks. With all new threshold widget visuals, easily set up certain threshold scales determining safe, warning and danger scales to quickly gauge service level performance, SLA breaches, etc.
Additionally, upon threshold breaches, team leaders can set real-time widget custom icons and animations to be on top of any deviations and breaches from quality standards.
Further, the desired widget can be swapped to switch between alternate forms of visuals like Speed Gauge, Donut, Thermometer, etc.
Steps to Add a Threshold Widget
1. Navigate to the Widget Library and select Threshold.
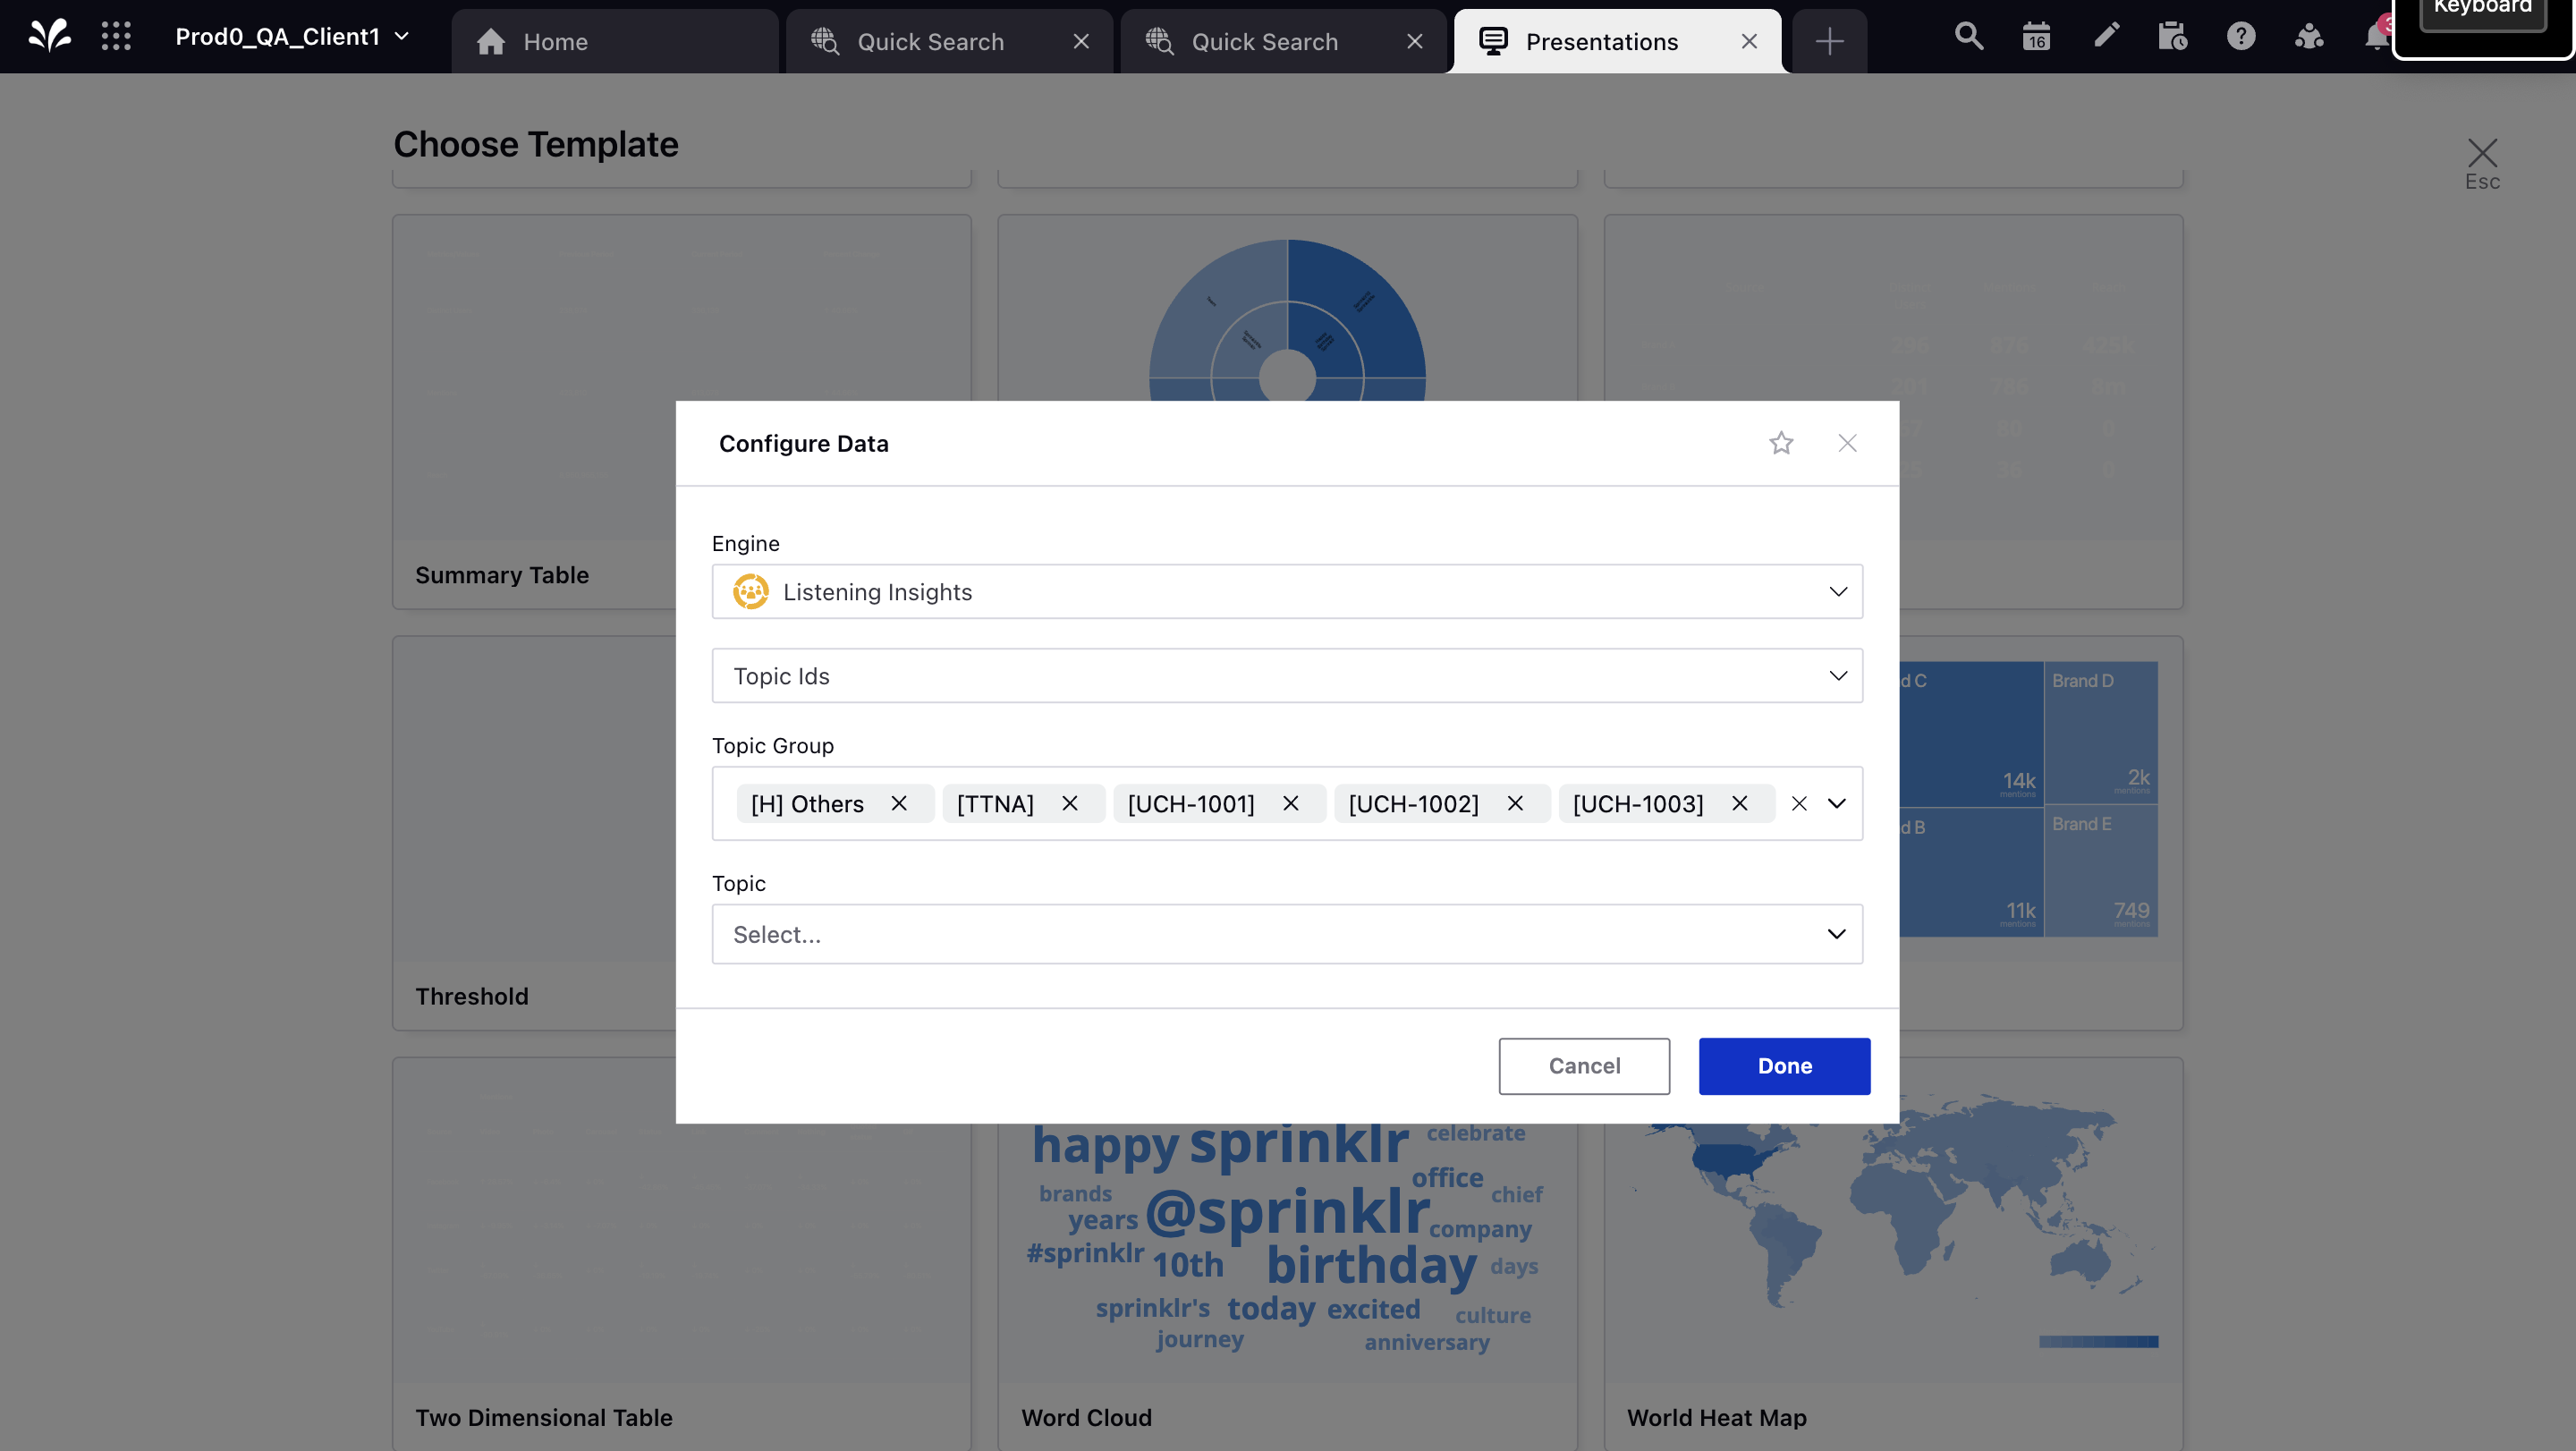
2. Select or input the data configuration required for the widget.
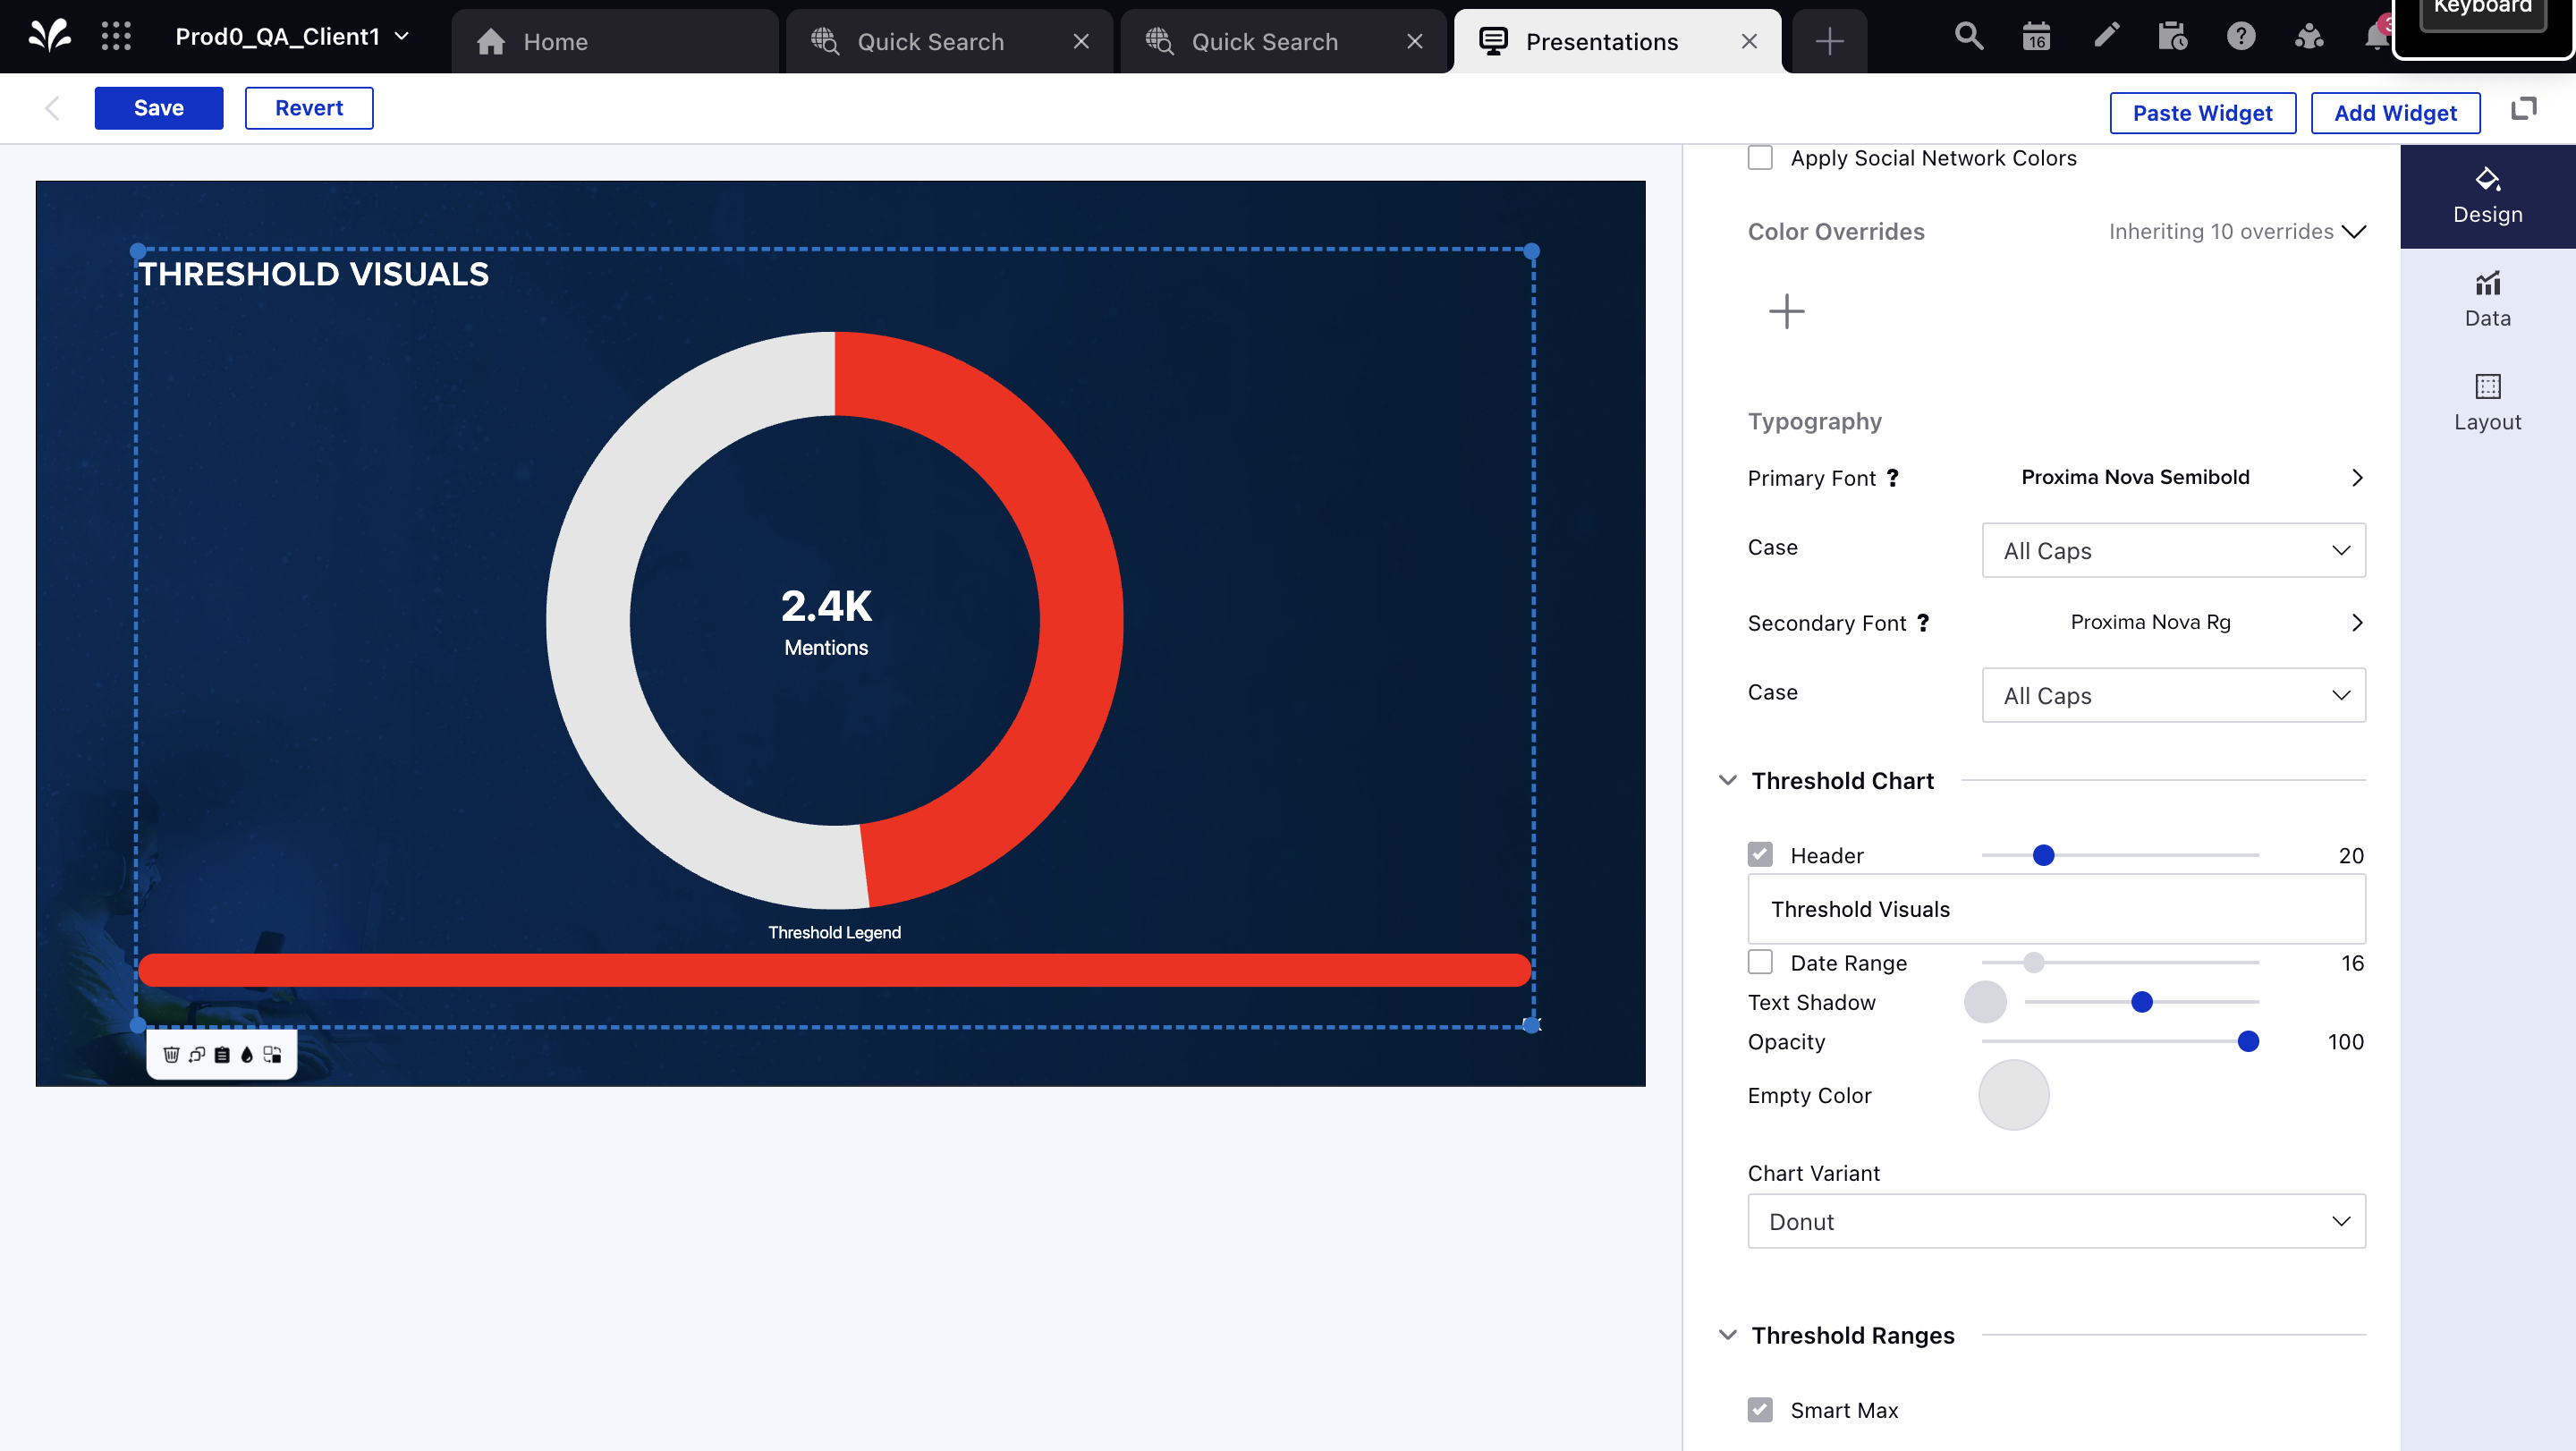
3. Threshold visualization will be created by default in Donut style.
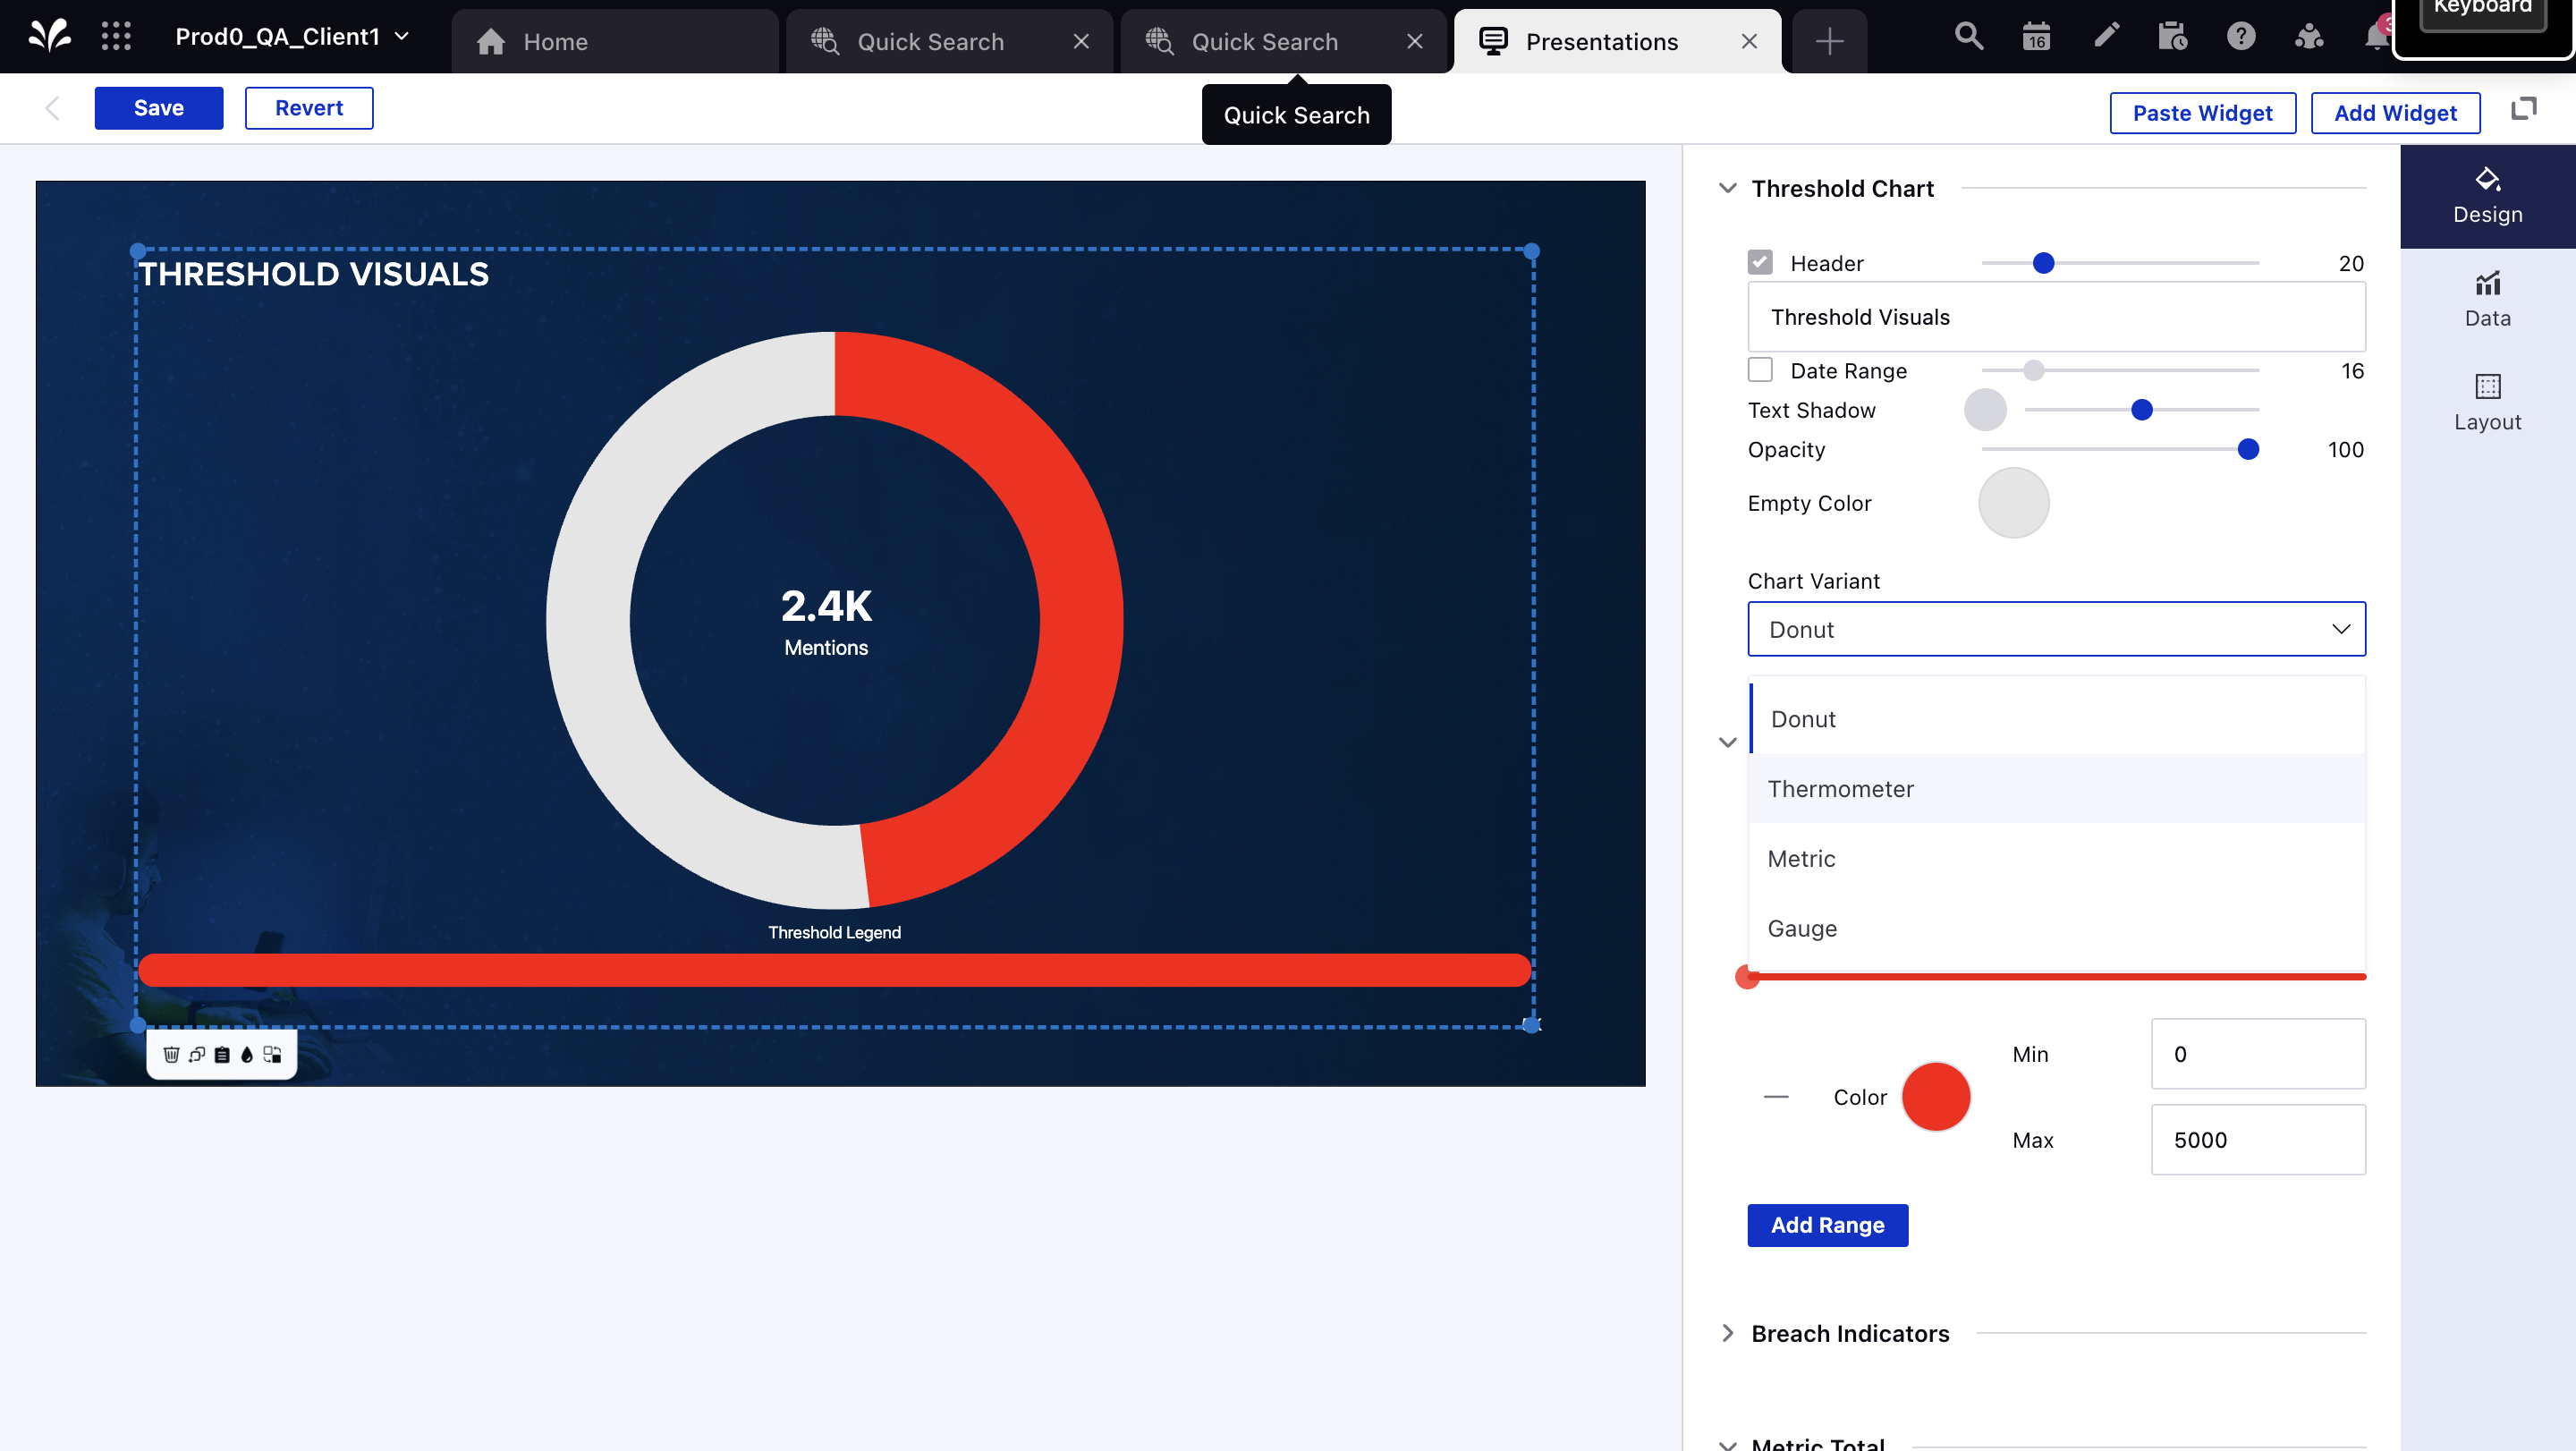
4. Upon creation, you can choose from different style variants for specific use cases from the following options:
Donut
Thermometer
Metric
Gauge
5. Threshold ranges can be defined from the design tab using the Add Range option.
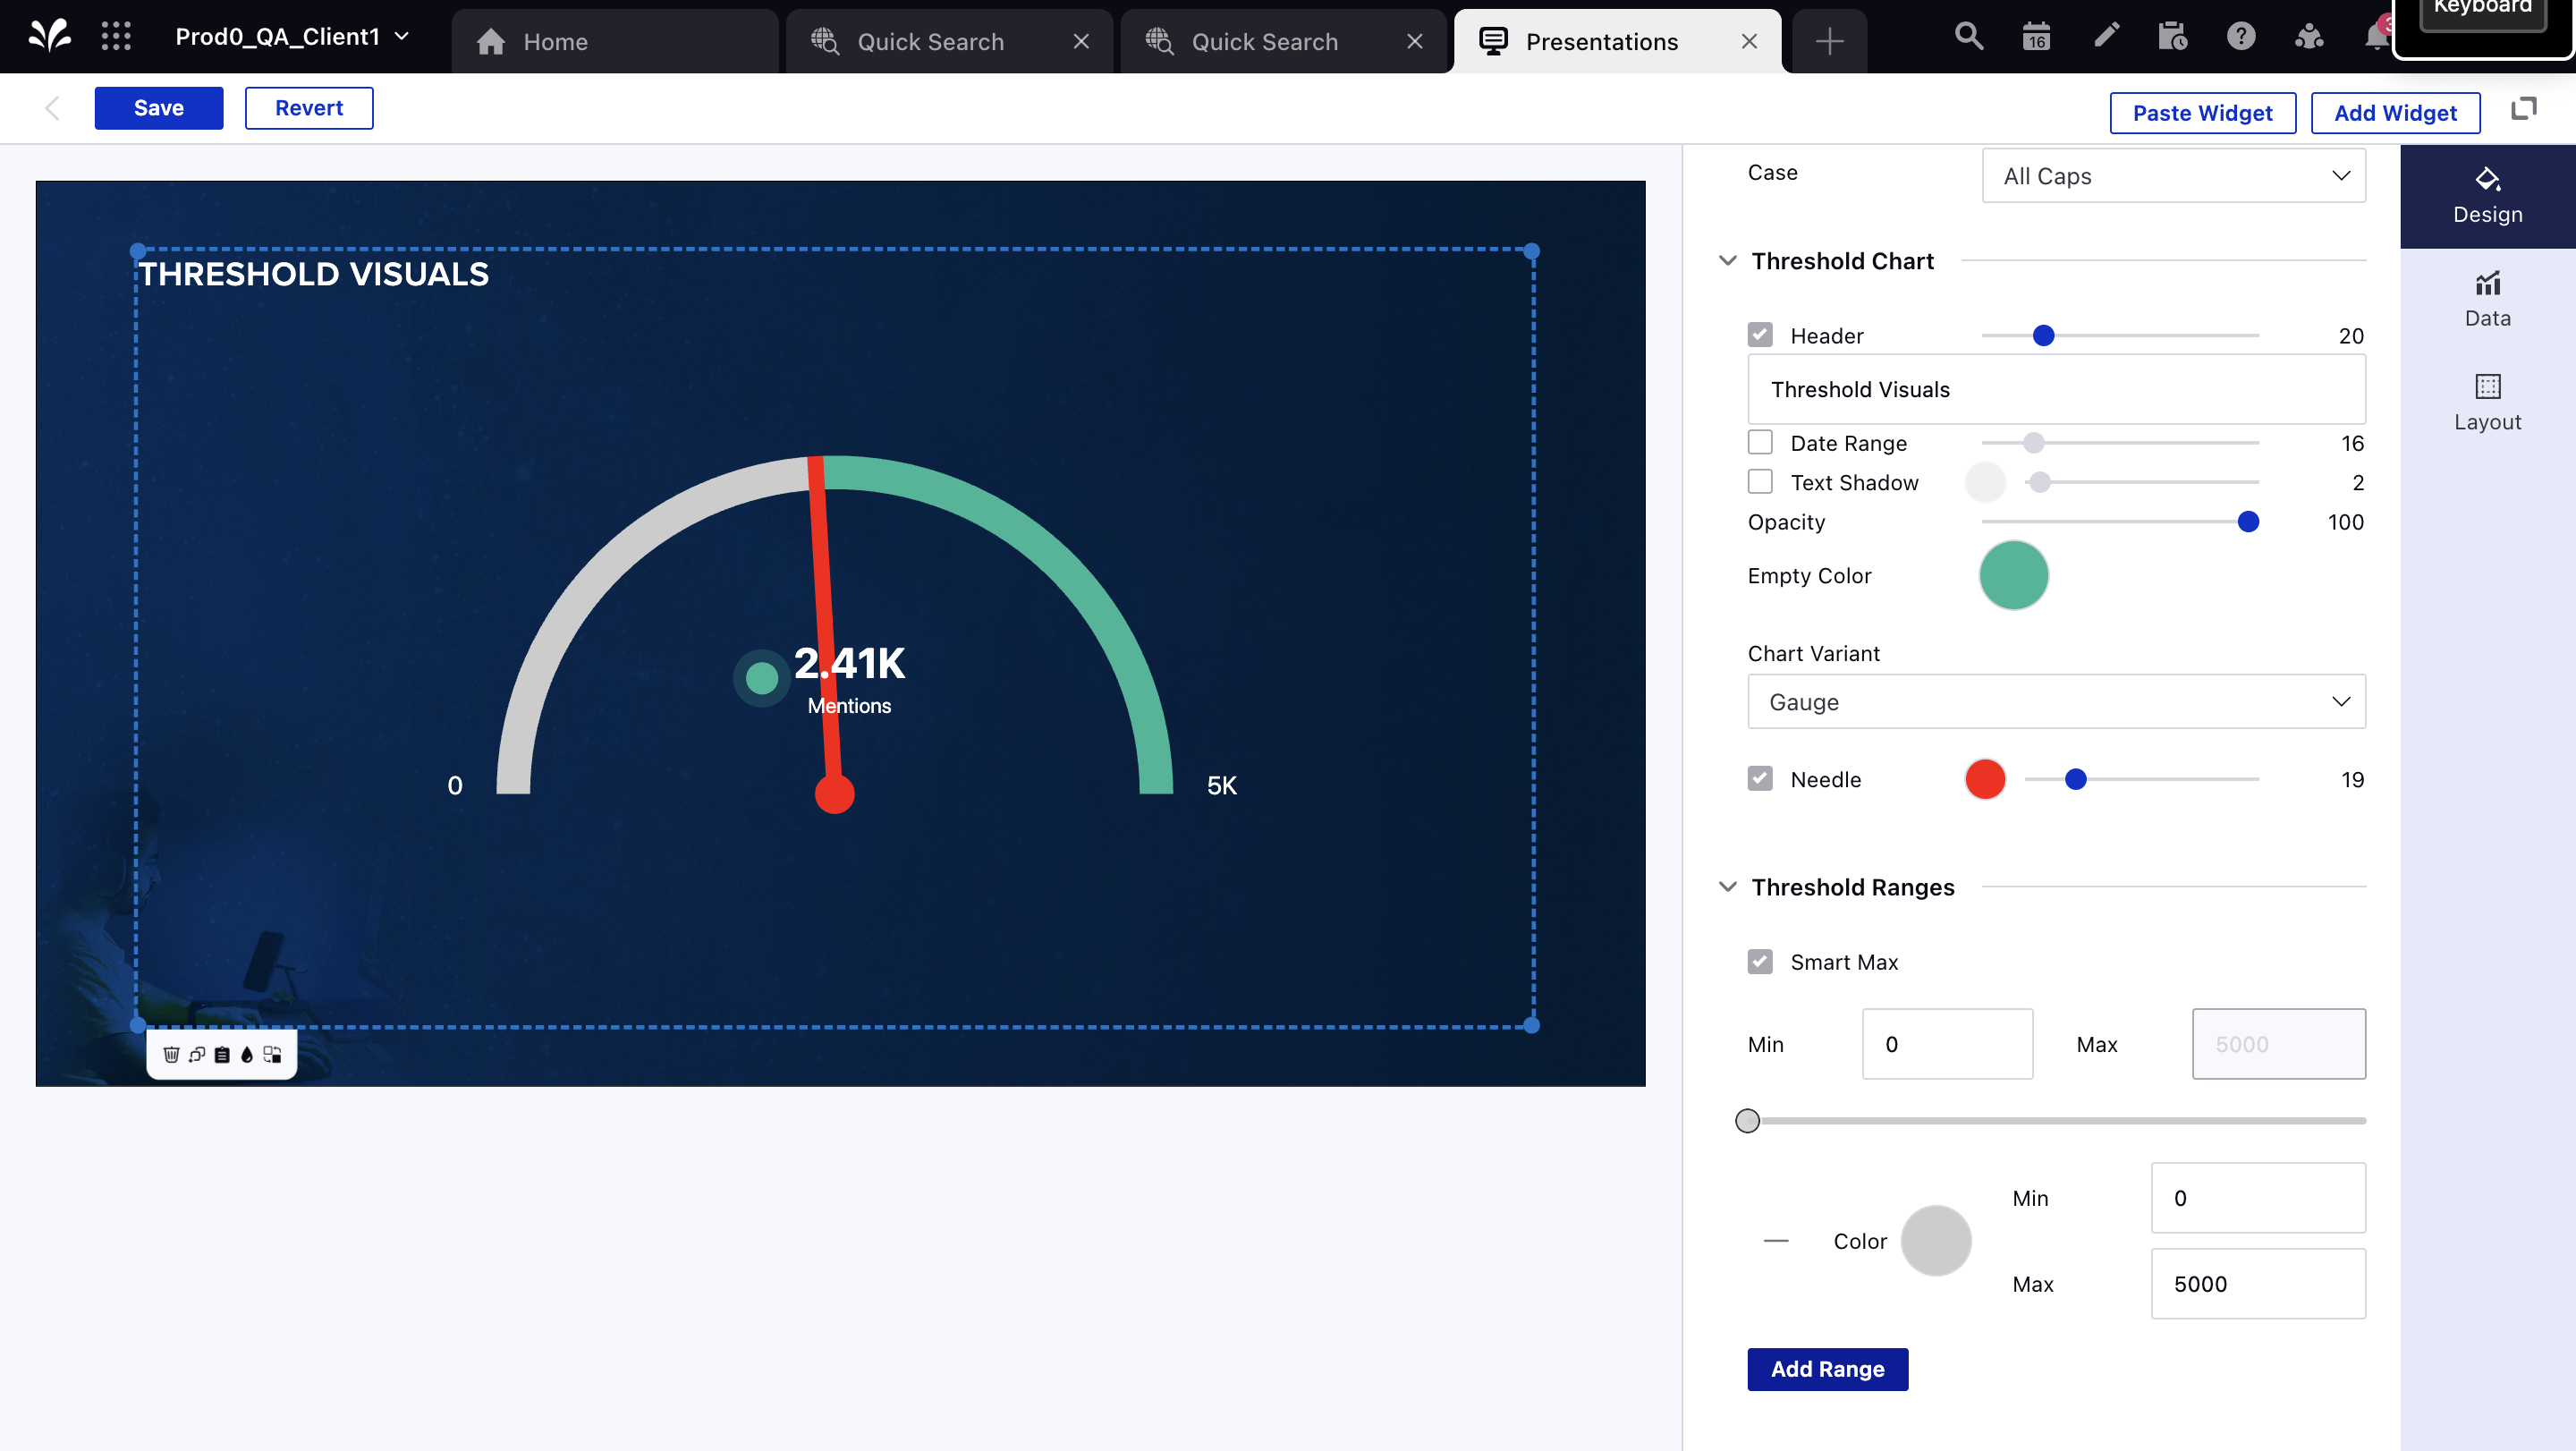
6. Additionally, you can add breach indications and icons that come up when certain threshold levels are crossed.
