Use Touchscreen Enabled Display
Updated
Sprinklr's Touchscreen enabled Display allows you to interact with your charts, helping you gain additional insights with no additional setup required. You will be able to explore the data behind that segment, based on a list of dimensions. Touchscreen Display support includes the ability to drill down another dimension and show the data in a bar chart, trend the data in a line chart, show the influencers in a profile chart, top words/hashtags in a word cloud or show the posts for the given item in a post stream.
Touchscreen events work for certain analytics charts only in Listening. The available dimensions vary for each engine. Analytics charts that Touchscreen events work for include: Top words (Word Cloud), Sentiment (Bar Chart), Trend View (Line Chart), Top Advocates (Profile), Content Stream (Grid), Source (Bar chart), and Media Type (Bar Chart).
To Use Touchscreen Enabled Display
Click the New Tab icon
. Under the Sprinklr Insights tab, click Display within Distribute.
Navigate to the Display section and enable the Enable Touchscreen Features checkbox in the Settings pane.
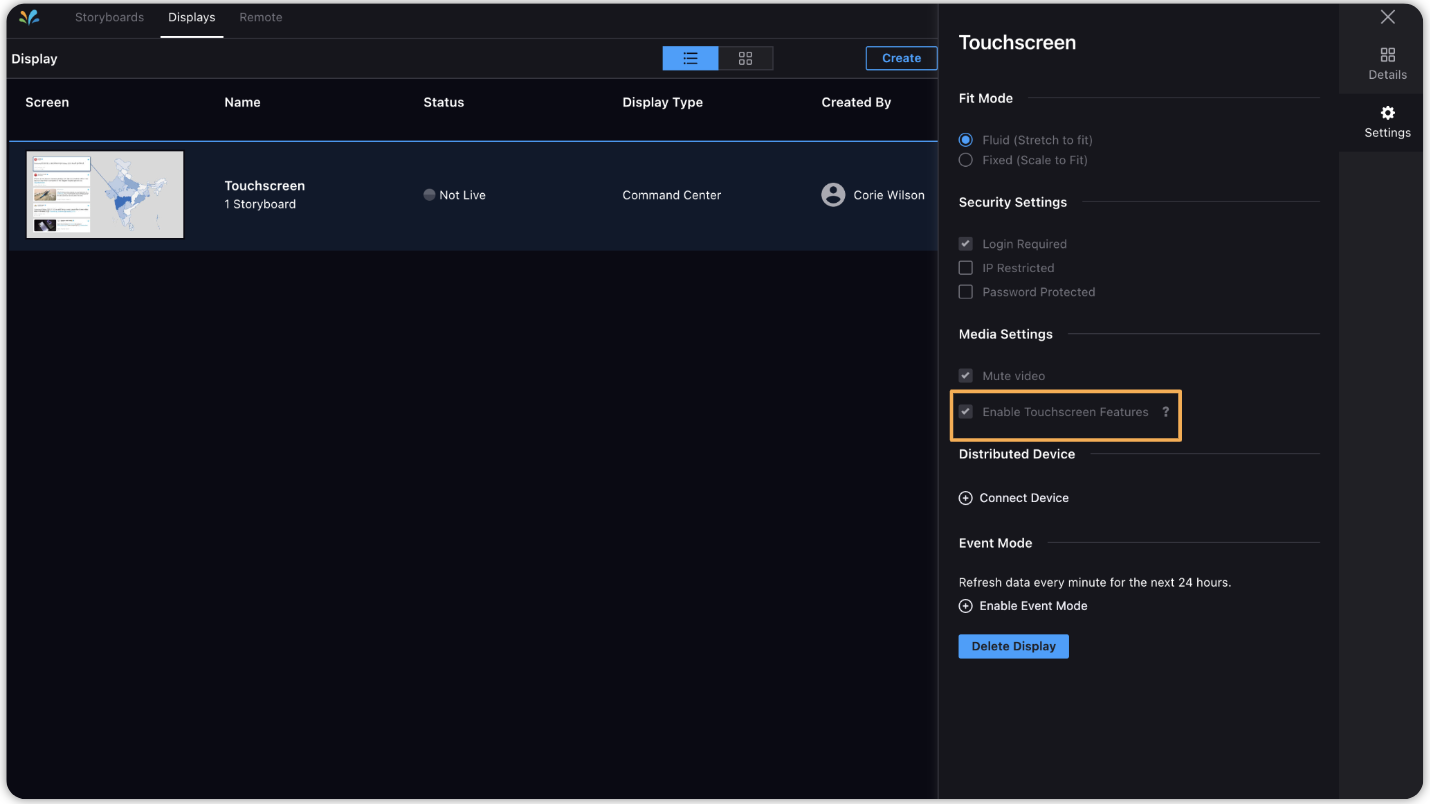
Login Required has to be enabled under Security Settings for Touchscreen capabilities.
Touch or tap the widgets to drill down and see a dashboard showing additional information.
Touch or tap on any of the Top Posts to see a zoomed in version of that post.
Touch a chart to apply additional filters to that chart. These additional filter will appear in the bottom left.