How does AI Creative Insights Work?
Updated
Creatives are essential for helping brands and advertisers understand how their audience engages with their content. The AI Creative Insights dashboard answers the question of which creatives perform well by providing data on various attributes. You can view a breakdown of how different elements in your ad creatives (for example: CTA, Aspect Ratio, Prominent colors and so on) are performing. It also highlights which elements perform well overall, allowing you to focus on creating ad creatives and campaigns using those high-performing elements to drive greater ROI.
The AI Creative Insights Dashboard is divided into six sections, offering a more in-depth analysis of different creative attributes:
Glossary: Lists the ML engines and dimensions used in the dashboard. This section helps you understand how the various metrics are configured and the parameters used to calculate creative performance.
Compliance Trends: Provides insights into the channel and brand compliance trends of your ad creatives. You can monitor ad compliance and track distribution, helping you identify and minimize wasted spend on poor-performing creatives.
Creative Elements: Monitors the performance of individual elements in your creatives. It breaks down performance by aspect ratio, video length, call-to-action, text on asset, prominent colors and much more. This data enables you to improve creatives by offering detailed performance insights for each element.
Brand Consistency: Focuses on how well the creative reflects your brand identity. It checks for brand elements like your logo and alignment with your brand image. Maintaining brand consistency is key to building recognition in the market, and this category helps ensure your creatives stay on-brand.
Note: The Brand Consistency data engine operates independently of the brand configured in the Creative Management App.
Emotional Appeal: Assesses how effectively the creative connects with your audience on an emotional level.
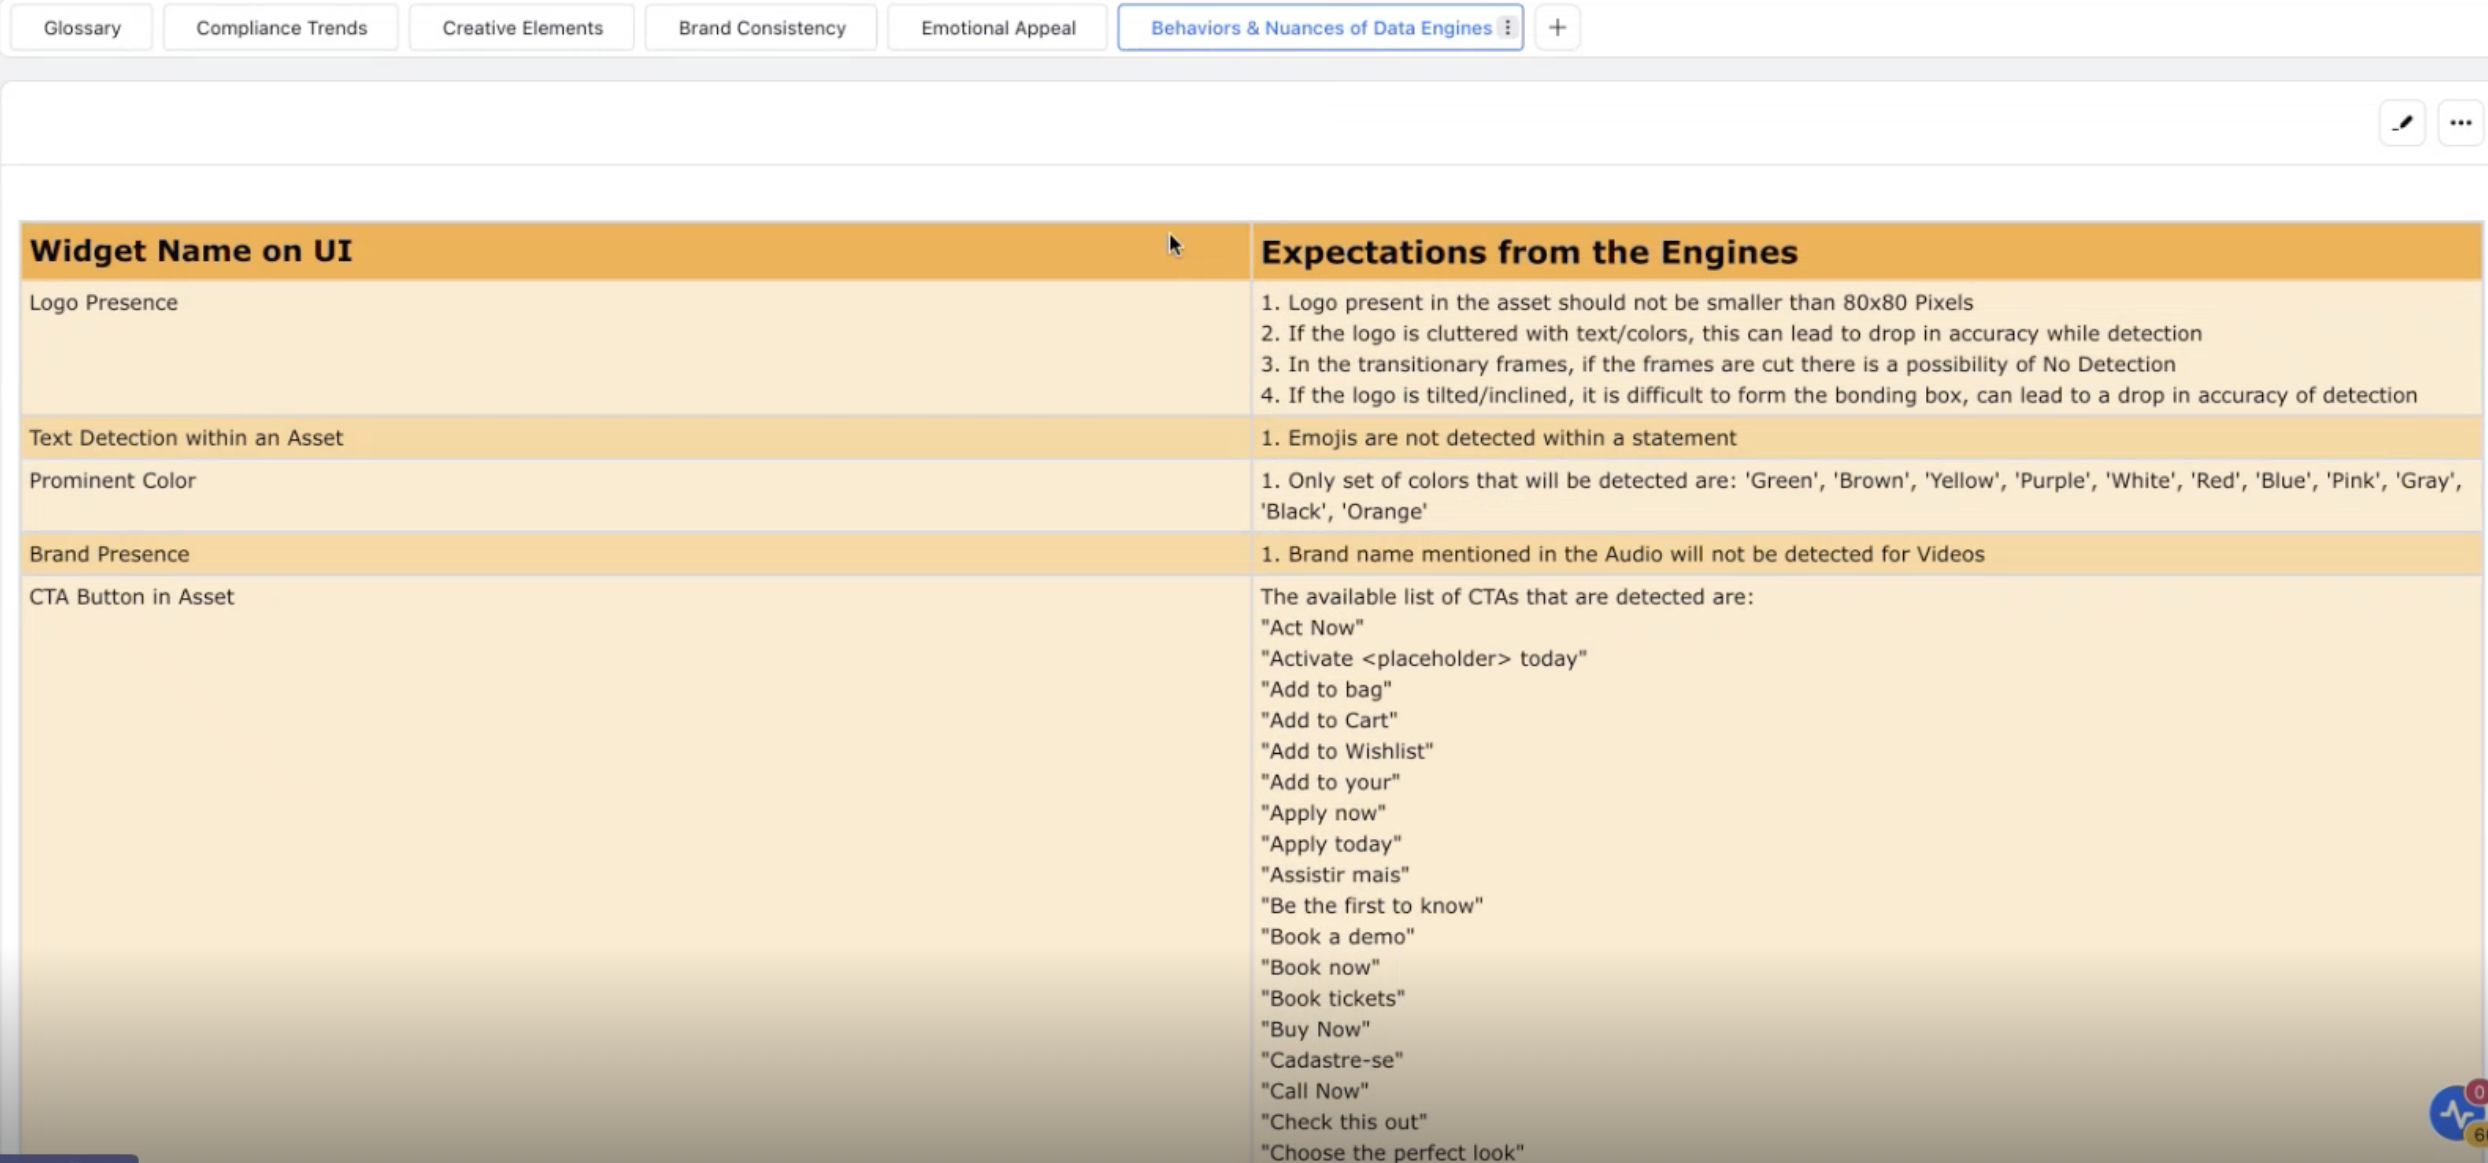
Behaviors and Nuances of Data Engines: Acts as a guidebook, detailing how the engine works, its limitations, and what output you can expect from it.
Glossary
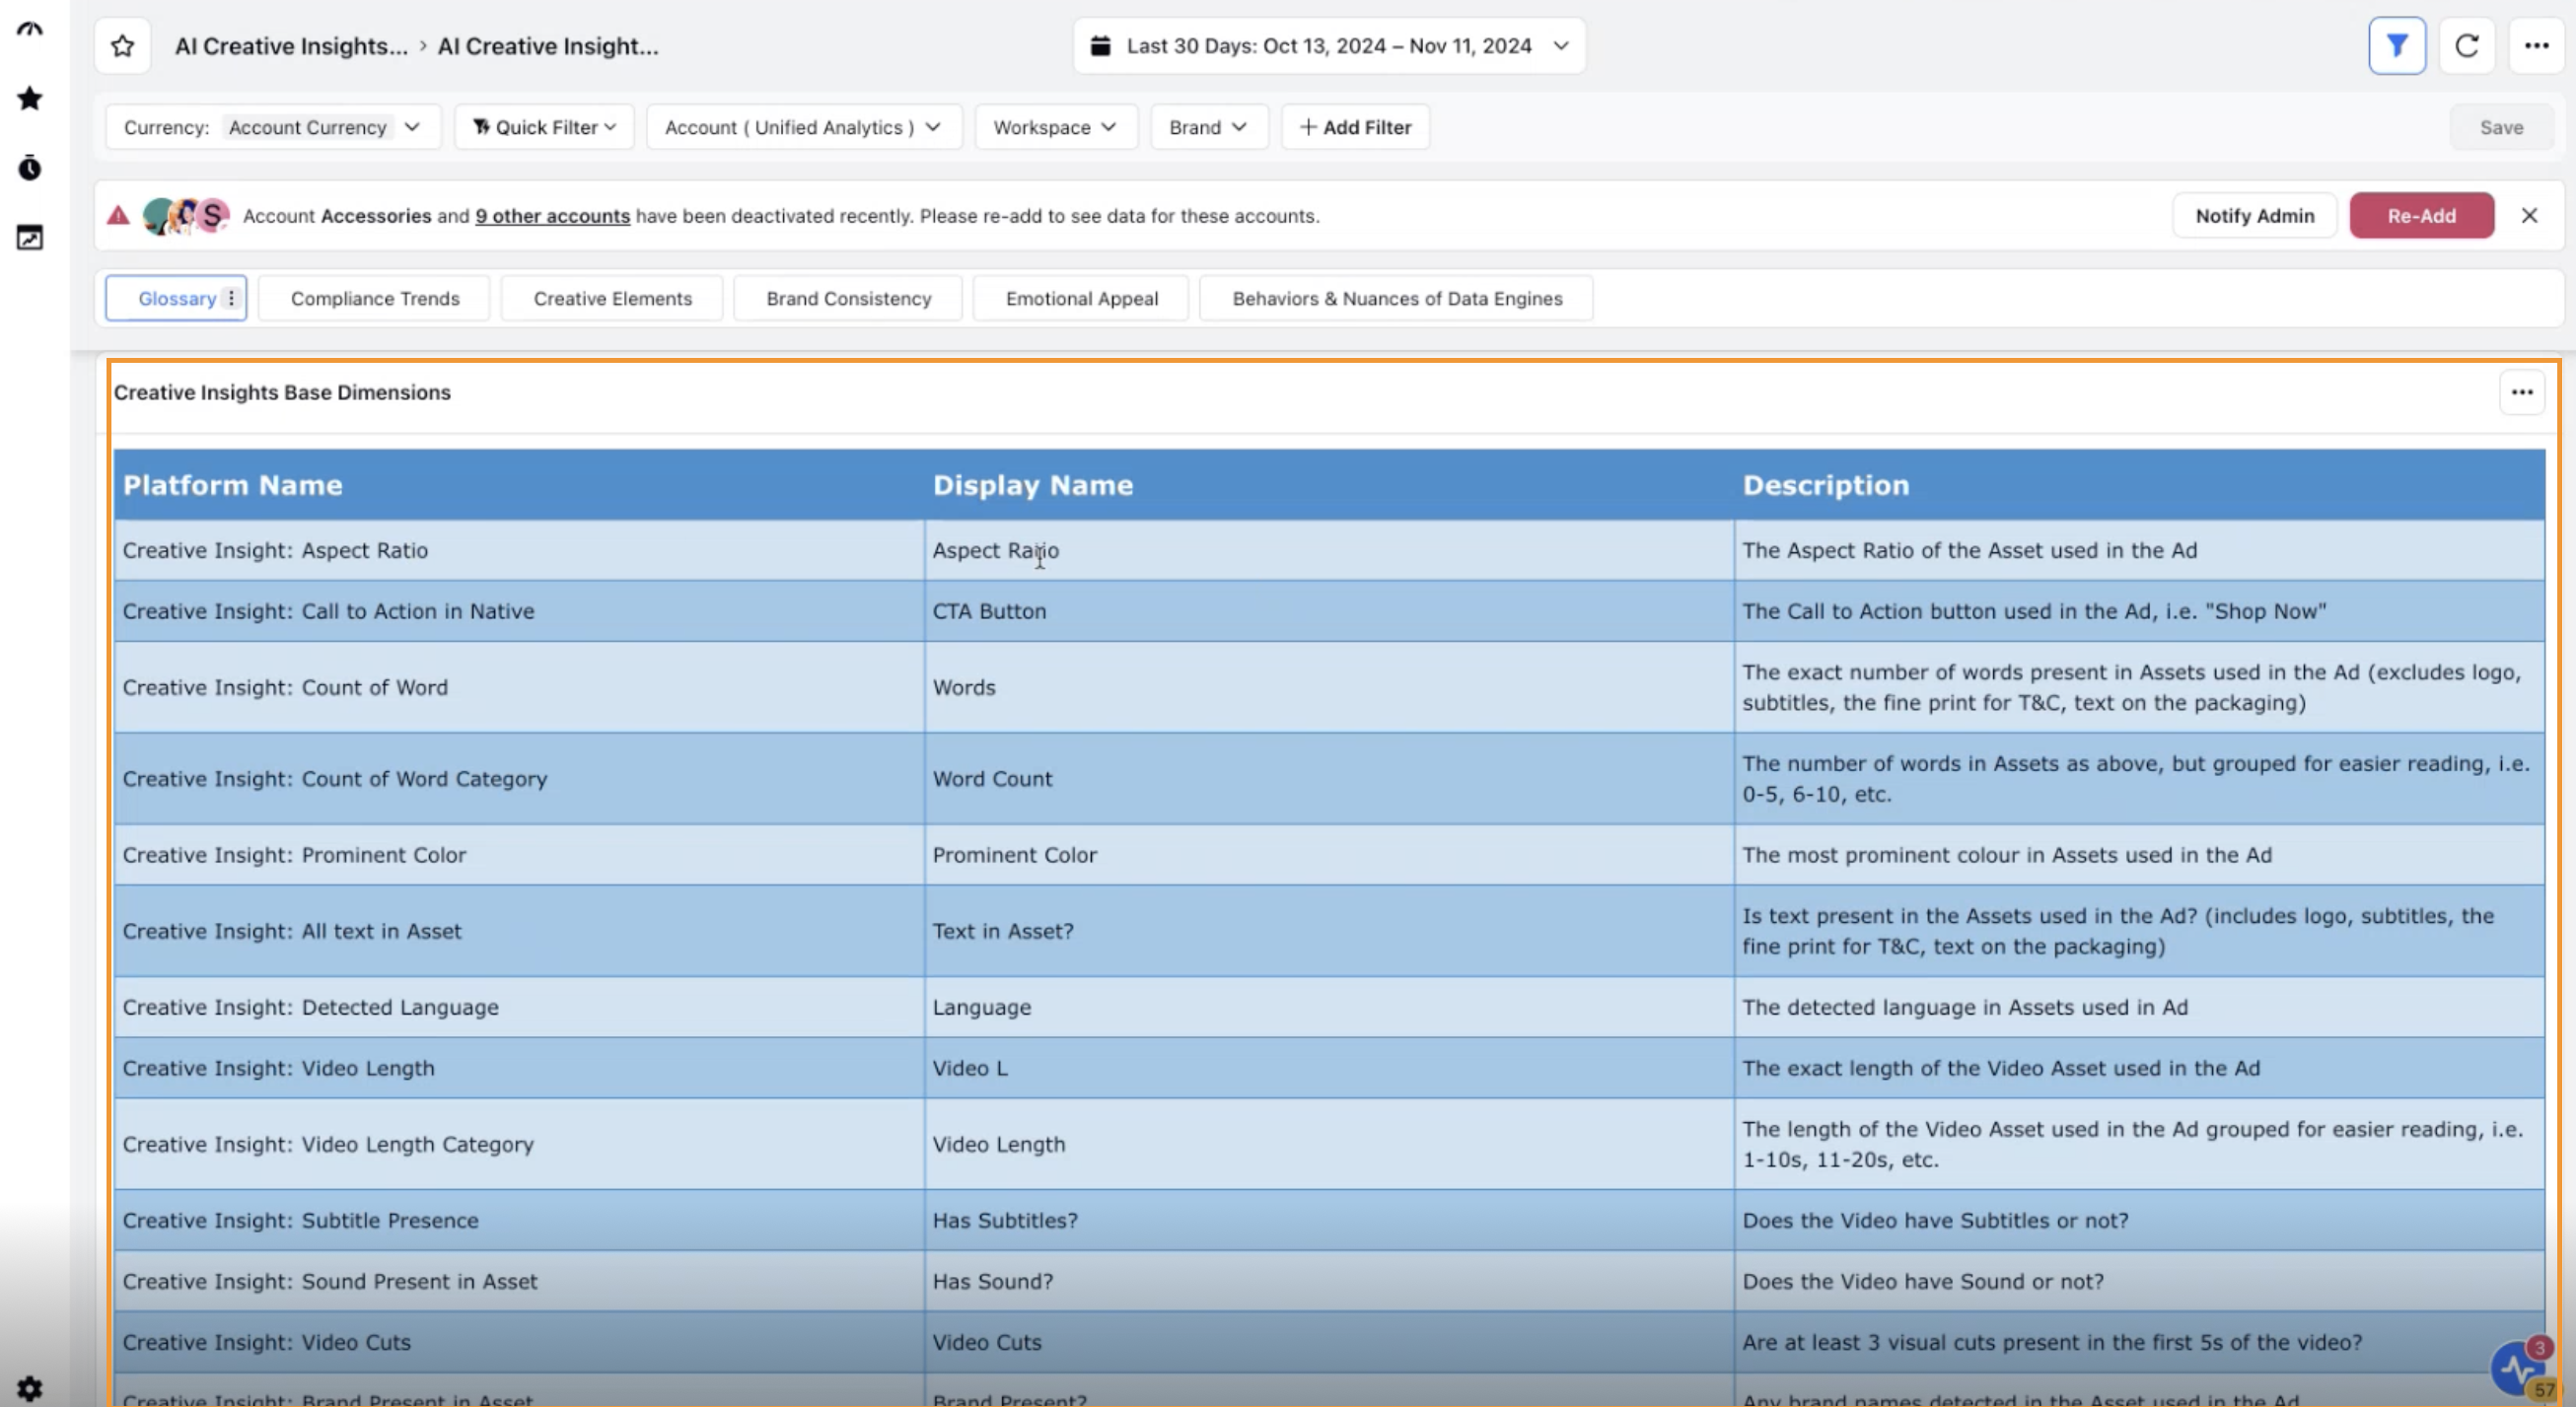
The Glossary section provides a guideline with details on the dimensions, grading, and scoring of assets based on channel and brand compliance. It is divided into two key sections:
Creative Insights Base Dimension: Lists the dimensions used in the dashboard. For example, the 'Count of Word' dimension shows which types of words are counted when determining the number of words in a creative.
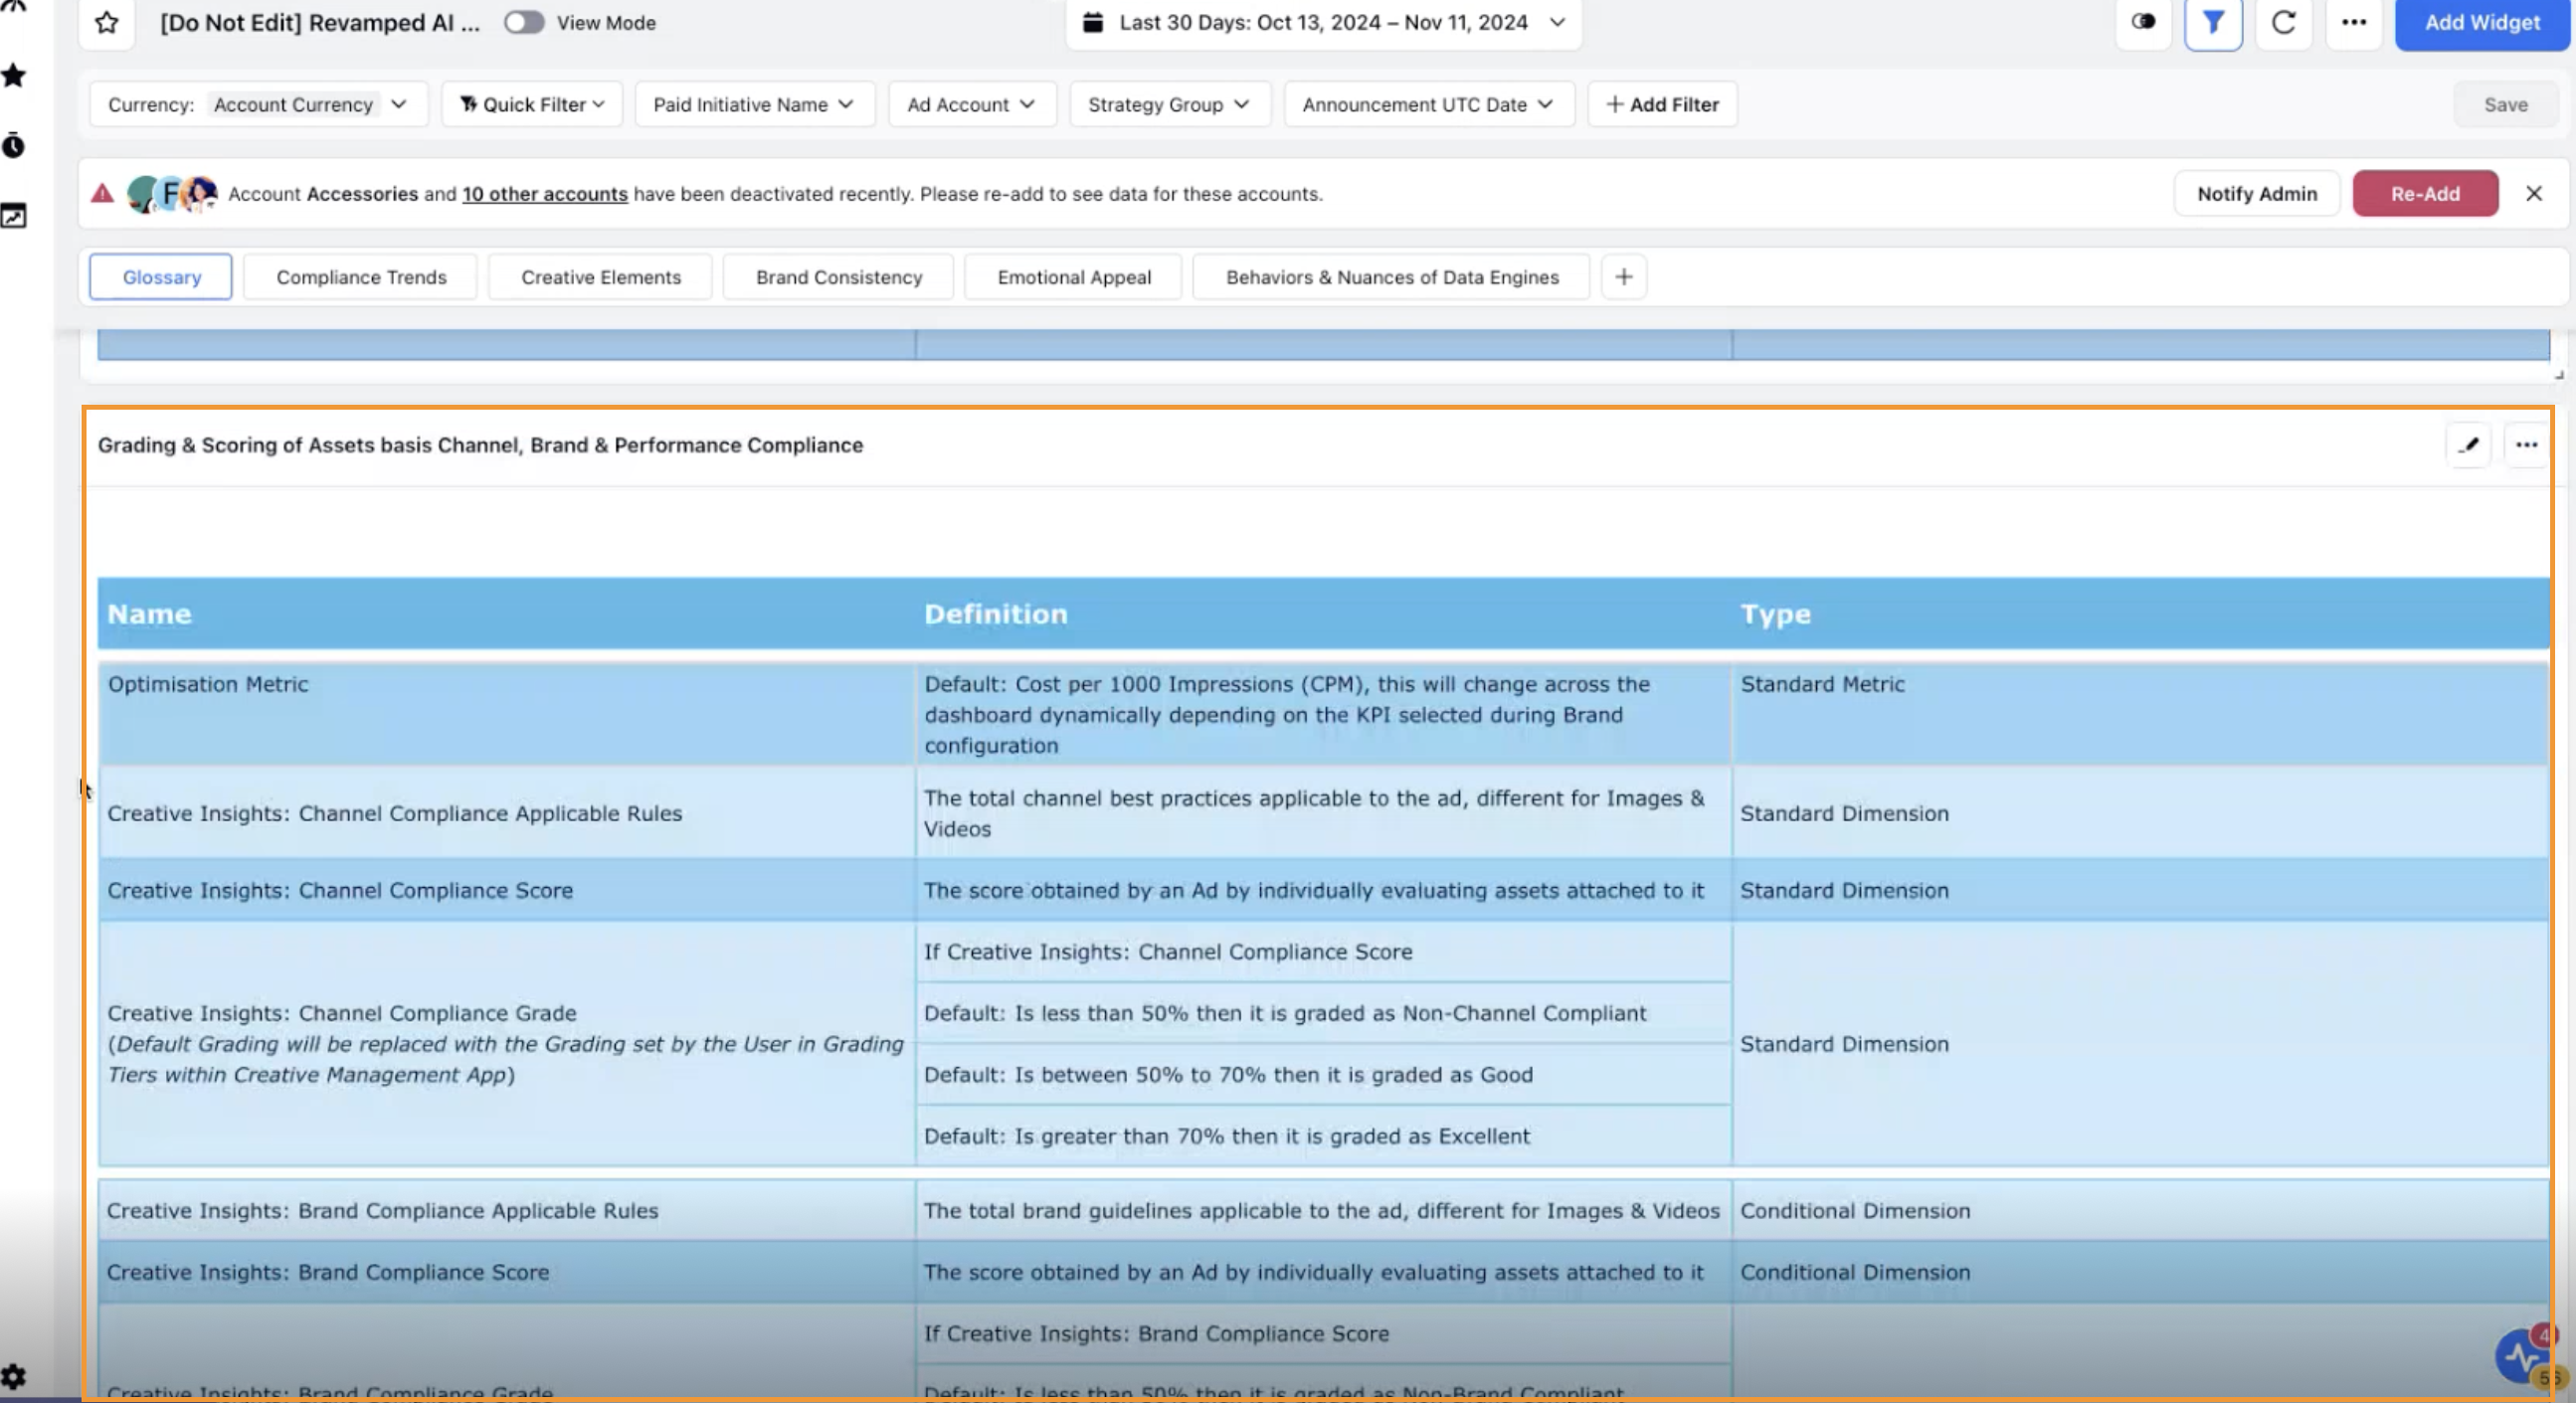
Grading and Scoring of Assets: Describes the default grading system used to categorize and analyze assets. Additionally, you can configure custom grading rules specific to your brand guidelines in the Creative Management App. These custom rules will then be used to grade and score ad creatives in the dashboard, overriding the default grading system.
The grading system categorizes and analyzes assets based on two key themes:
Channel Compliance Score: Evaluates assets according to channel guidelines. For instance, Facebook’s media guidelines require images to be at least 1080 x 1080 pixels, with a minimum size of 600 x 600 pixels. The aspect ratio should be between 1.91:1 and 1:1, and the maximum file size is 30 MB. Your assets will be assessed against these guidelines, and a score will be assigned based on their compliance.
Note: The complete list of channel-evaluated rules will be visible in the Dynamic Text widget which is shown upfront in Compliance Trends, Creative Elements, Brand Consistency and Emotional Appeal.
Brand Compliance: Assesses assets based on the custom brand compliance rules you set up in the Creative Management app. For example, you can define a rule stating that brand colors should cover at least 75% of an image or video in a creative. The Creative Insights Dashboard will then display whether your creatives comply with the rules you’ve defined. For more information on creating a brand in the Creative Management App, refer to How to Create a Brand in Ads Creative Management.
Compliance Trends
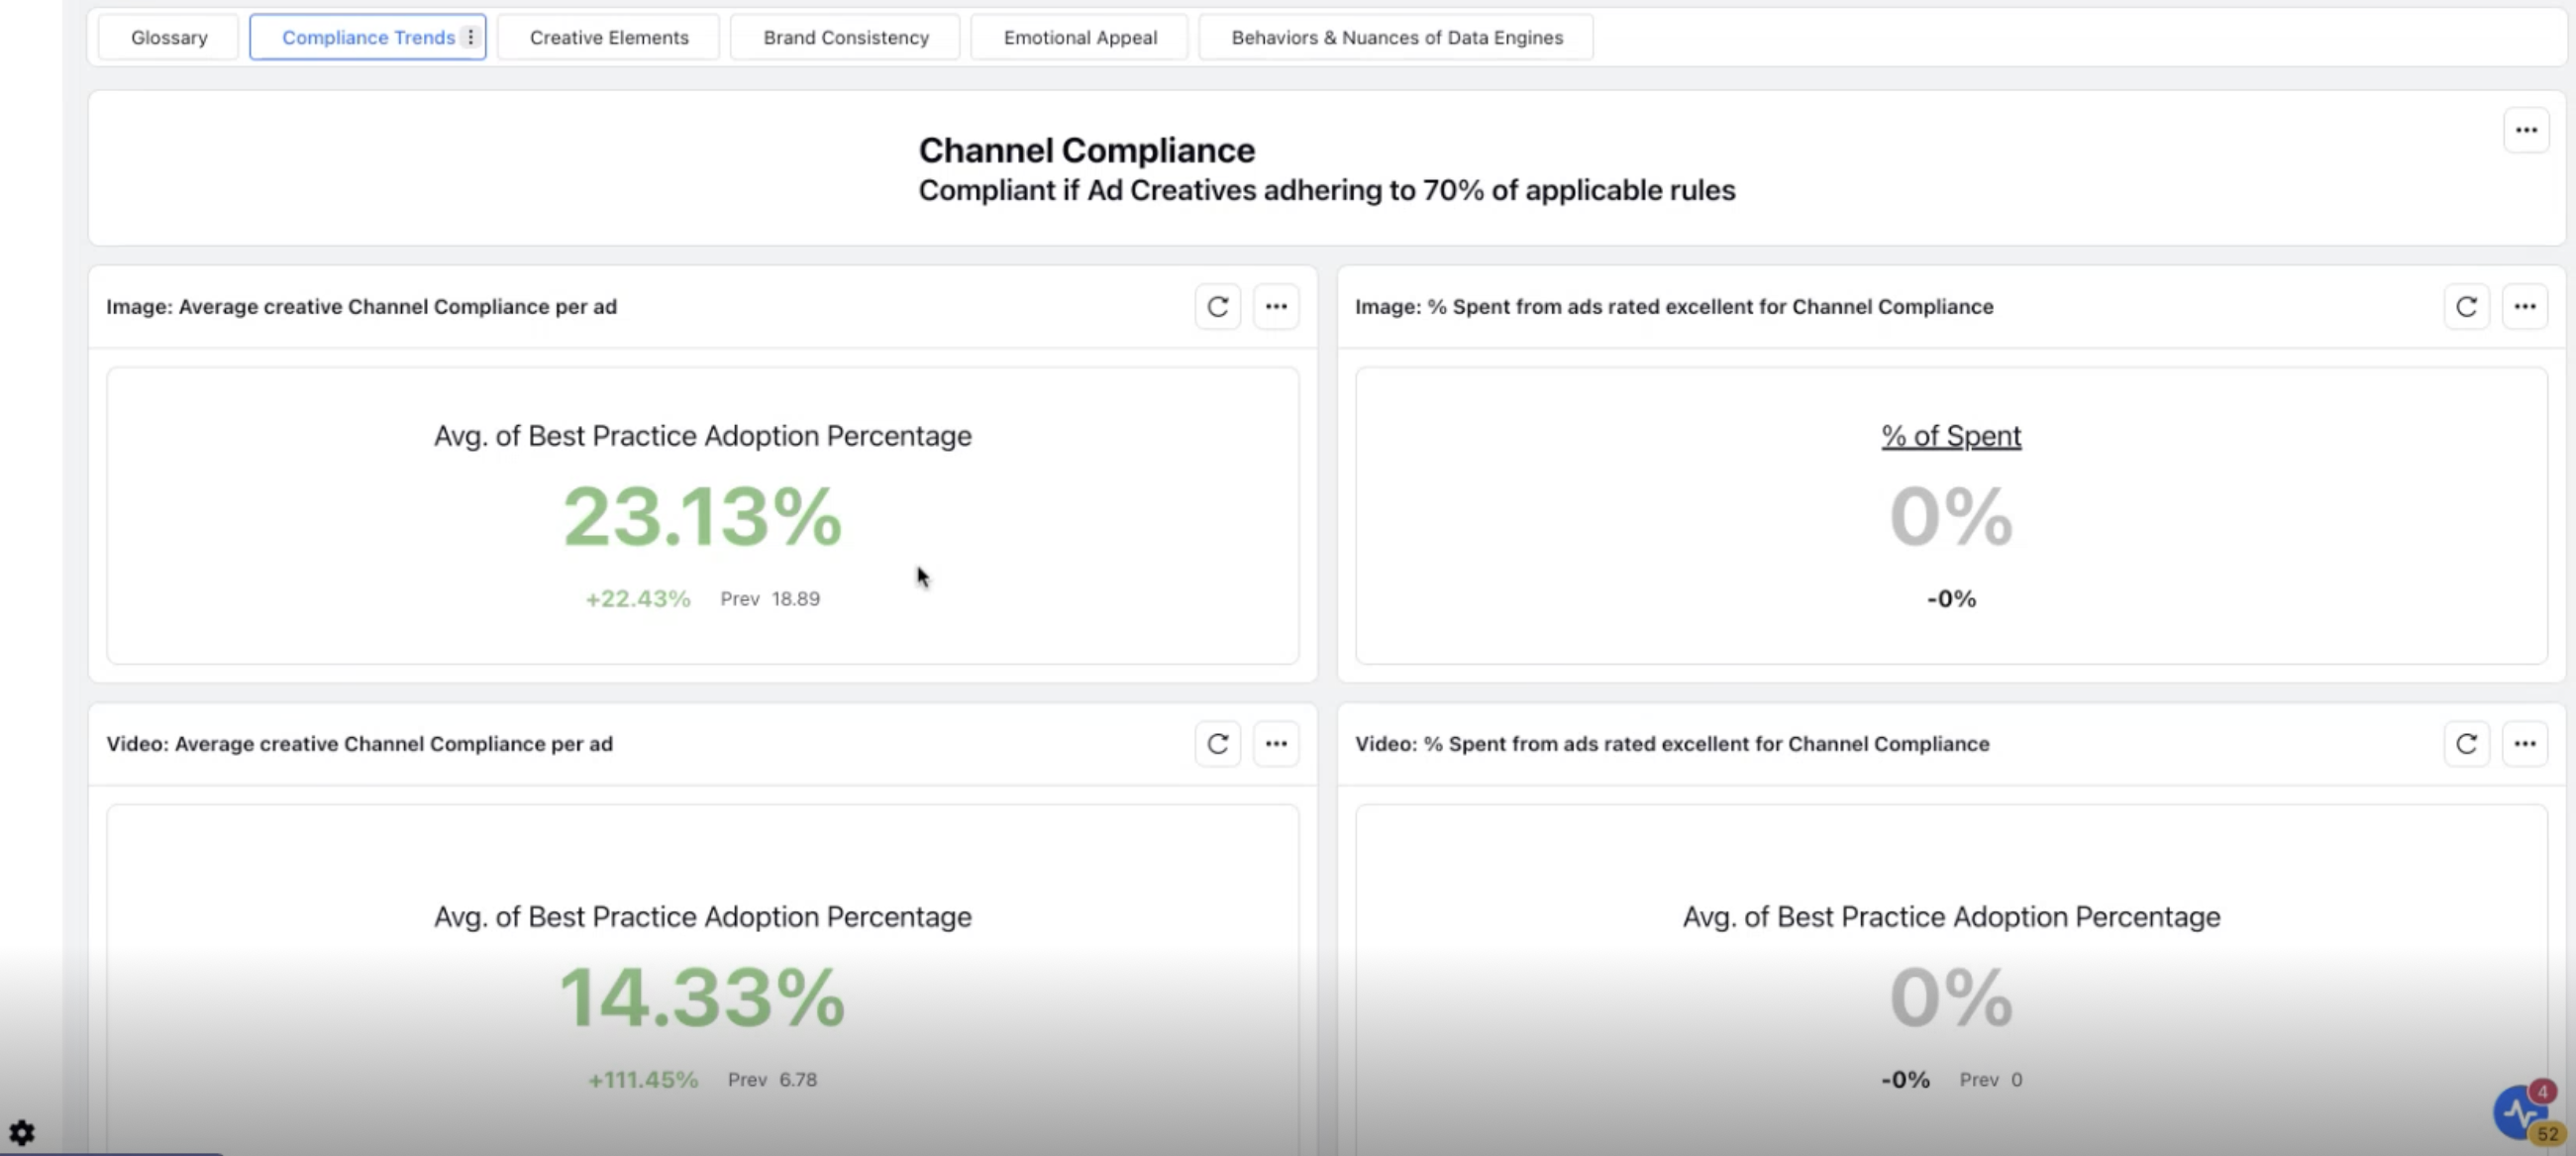
The Compliance Trends section provides insights into the compliance of your ad creatives. It is divided into same two themes as mentioned in Glossary – Channel Compliance and Brand Compliance.
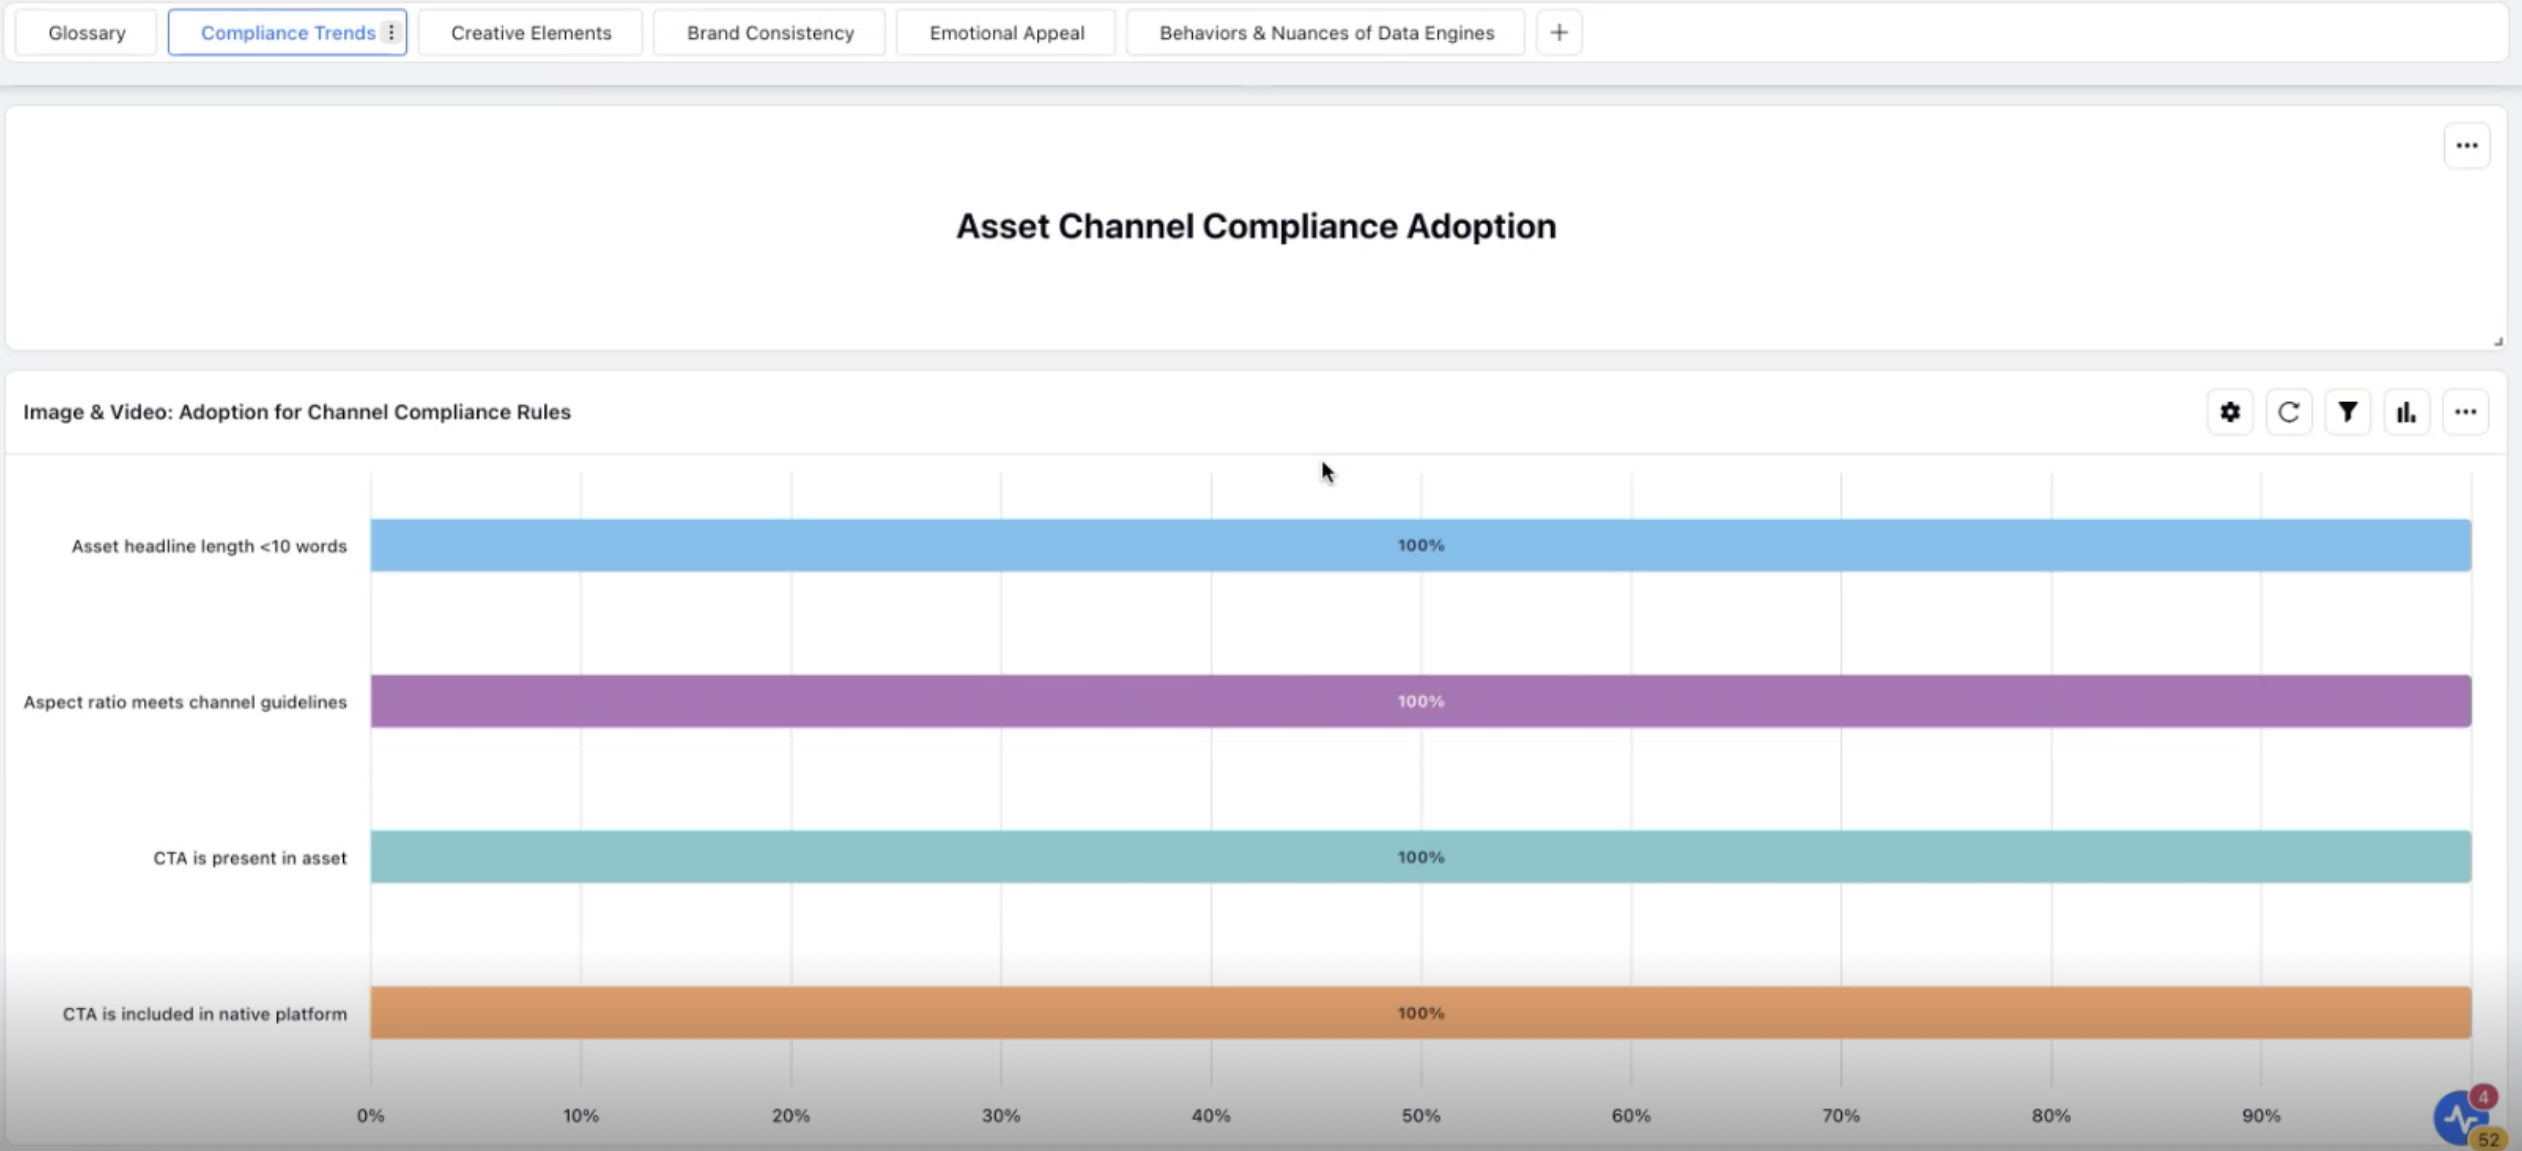
Channel Compliance: This section offers insights into the adoption of channel compliance rules for image and video assets, showing the correlation between the adoption of channel guidelines, optimization metrics, and compliant ad spend distribution. Channel compliance is further divided into four sections -
Summary: Provides an overview of the percentage of ads compliant with channel guidelines and the percentage of spend associated with ads rated as excellent for channel compliance. This helps you analyze how much spend is wasted on non-compliant creatives and identify areas for improvement.
Asset Channel Compliance Adoption: Delivers deeper insights into both image and video categories, showing where you stand in terms of channel compliance by category. This section highlights the varying levels of compliance you adhere to when publishing your ads, based on static channel rules. For video assets, additional dimensions are considered such as 'Sound in Video', 'Subtitles in Video', 'Video length < 15 seconds' and 'At least 3 visual cuts in the first 5 seconds'.
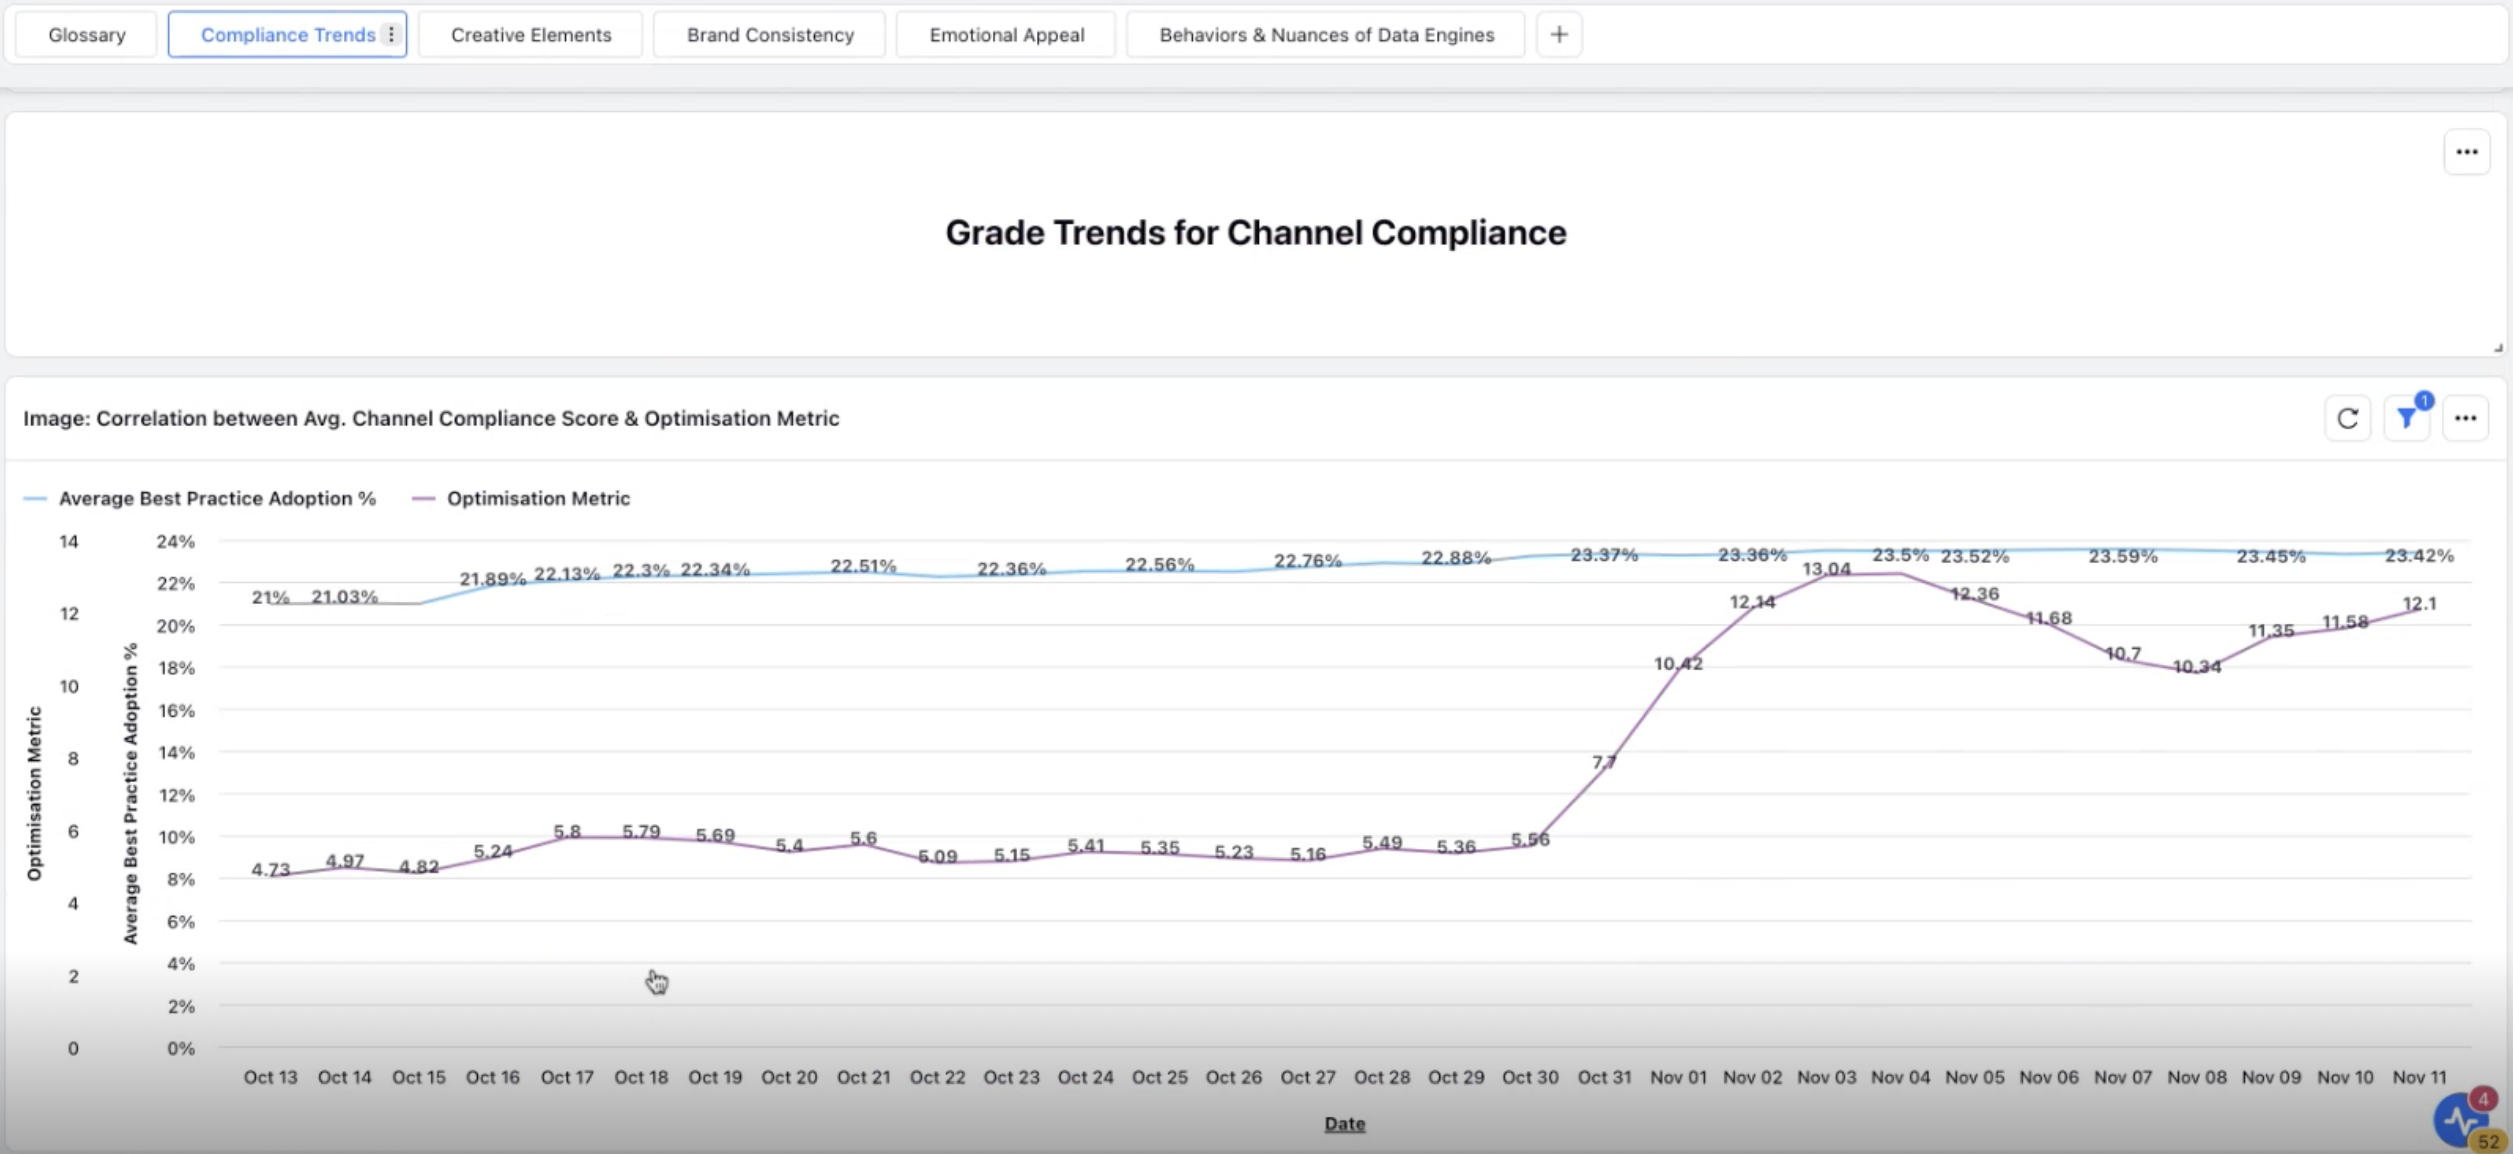
Grade Trends for Channel Compliance - Displays how the adoption of best practices for image and video creatives relates to the optimization metric you selected within Brand Compliance when setting up your brand in the Creative Management App. This helps you monitor how your business KPIs (optimization metrics) are impacted by channel compliance trends. You can use this data to observe whether channel compliance has improved or declined and its impact on your business KPIs over time.
Track Every Dollar for Channel Rules - Monitors compliant ad and spend distribution. This section shows two key values: the volume of ads distributed across different channels and the total percentage of spend associated with each ad distribution. It helps you track the spend linked to both compliant and non-compliant creatives.
Brand Compliance: This section focuses on the adoption of brand compliance rules for image and video assets, showing the correlation between brand guidelines adoption, optimization metrics, and spend distribution for brand-compliant ads. Similar to Channel Compliance, Brand Compliance is also divided into four sections, with a focus on custom brand rules -
Summary - Provides an overview of the percentage of ads compliant with brand guidelines set by you in the Creative Management App, as well as the percentage of spend on ads rated excellent for brand compliance. It helps you evaluate how much spend is wasted on non-compliant creatives and identify areas for improvement. The brand guidelines will also be displayed to you in the Dynamic Text widget, provided the appropriate brand filter is applied.
Asset Brand Compliance Adoption - Provides category-wise insights for both image and video assets, helping you track your compliance with custom brand rules. This section shows how closely you adhere to your defined brand guidelines when publishing your ads.
Grade Trends for Brand Compliance - Shows how the adoption of best practices for image and video creatives correlates with the optimization metric you selected when creating your brand in the Creative Management App. This enables you to monitor how your business KPIs are impacted by brand compliance over time, helping you track fluctuations in compliance and performance.
Track Every Dollar for Brand Rules - Monitors the distribution of brand-compliant ads and the associated spend. This section shows two key values: the volume of ads with different brand compliance grades and the total spend related to those ads. It helps you track how spend is allocated across ads rated as good, bad, or non-compliant.
Creative Elements
The Creative Elements section monitors the performance of individual elements in your creatives, breaking down performance by various factors such as aspect ratio, video length, call-to-action (CTA), language, prominent colors, and more. This data helps you improve your creatives by offering detailed insights into the performance of each element. The section is divided into two main areas: Image Creatives Performance Insights and Video Creatives Performance Insights.
Image Creatives Performance Insights - This section provides a deep-dive analysis of the following elements in your image creatives:
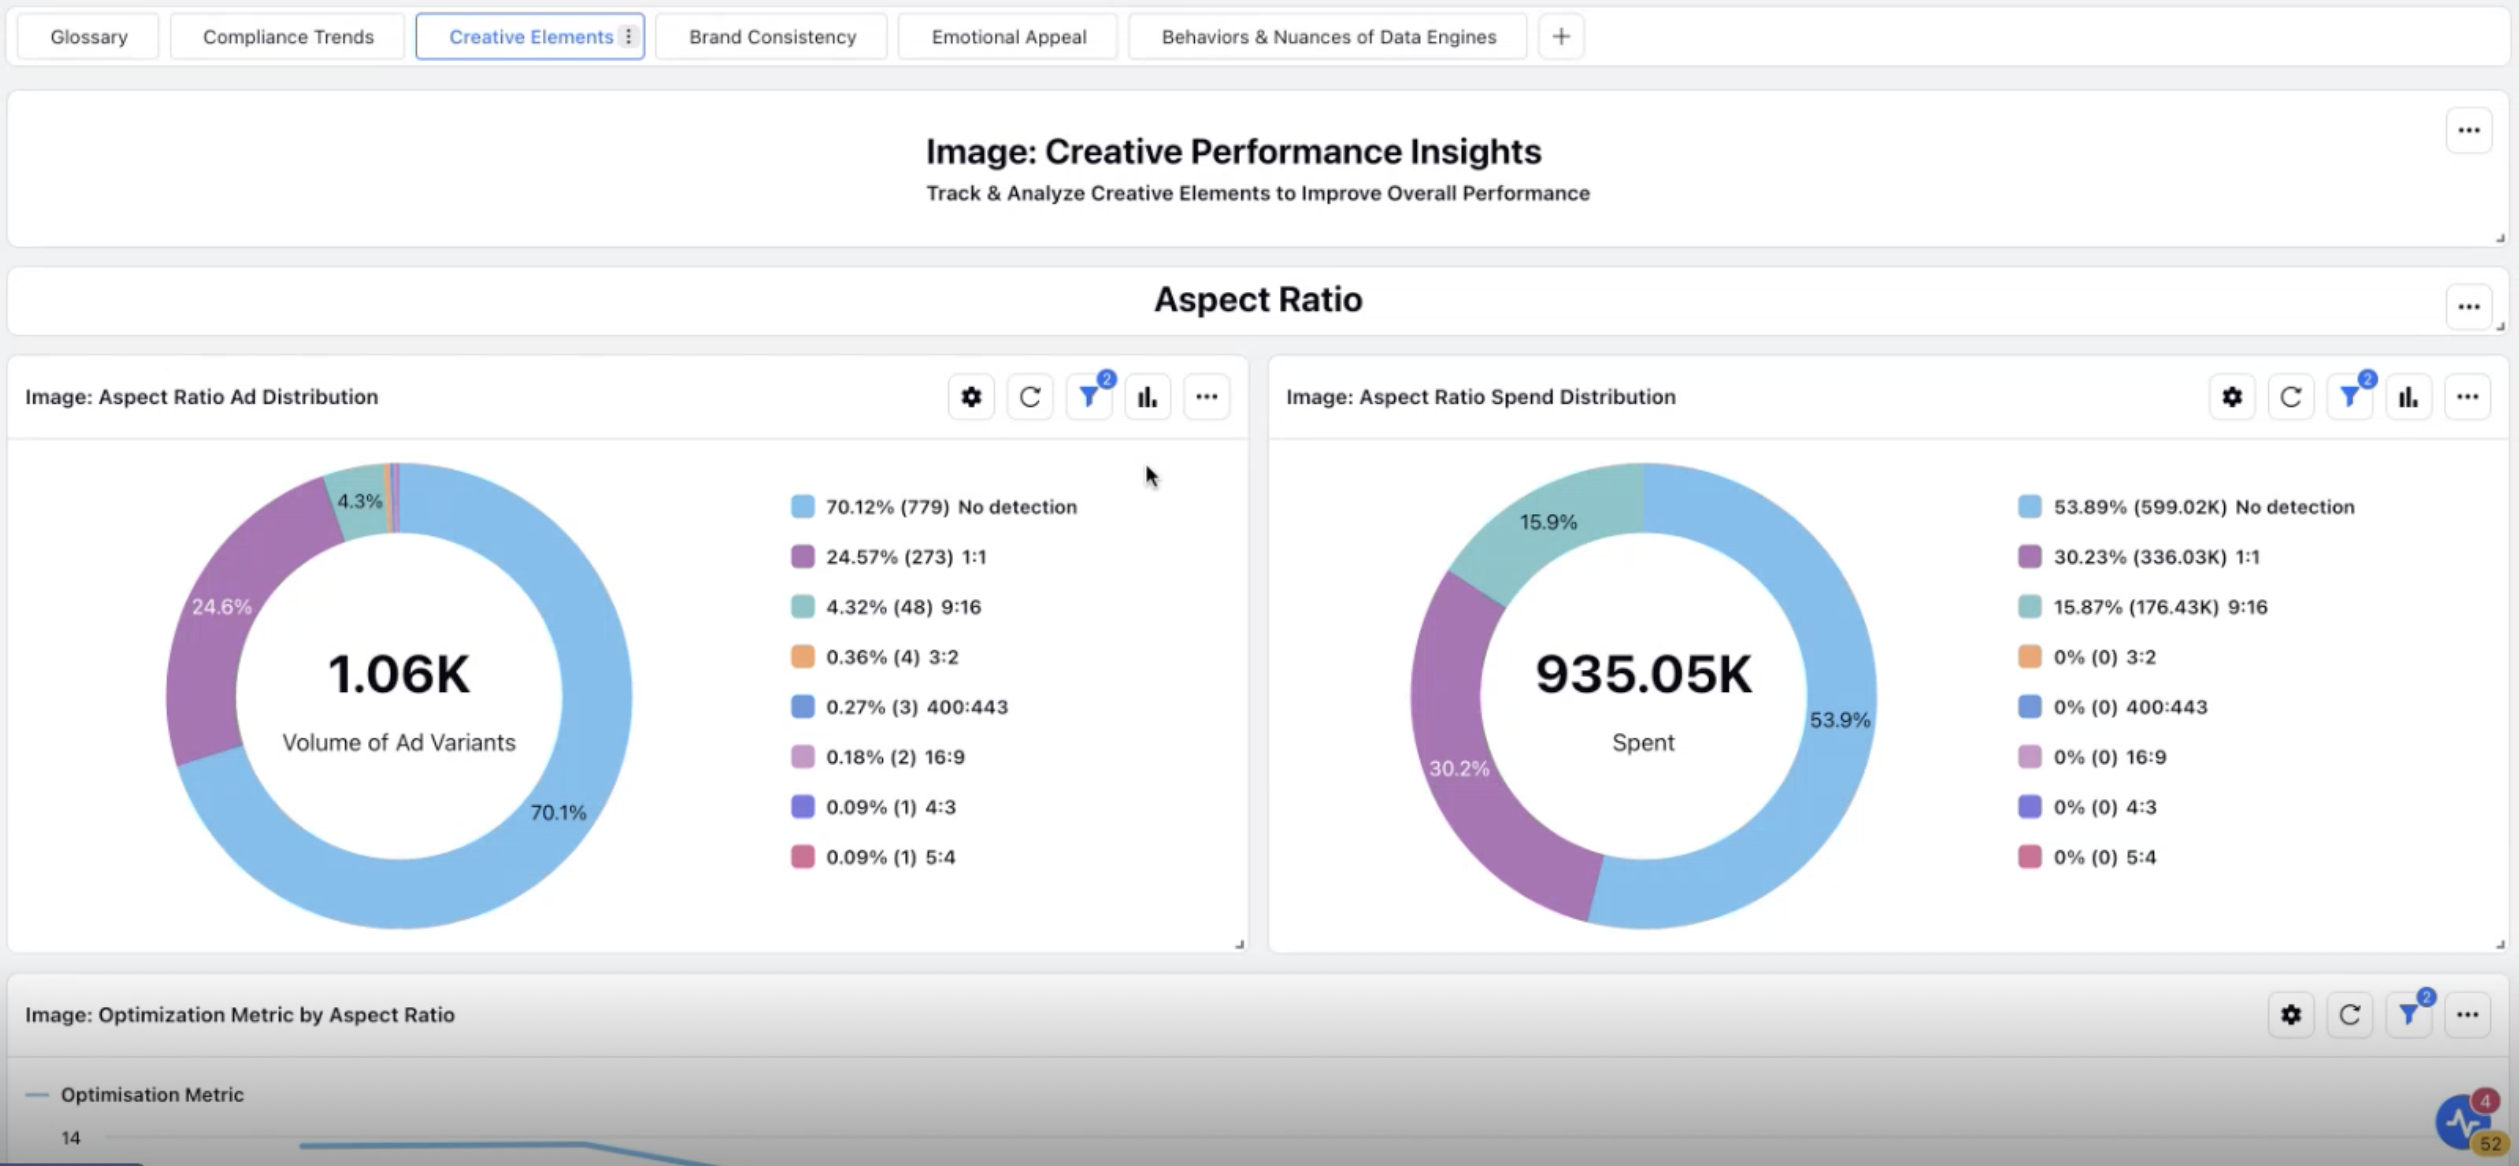
Aspect Ratio: Breaks down the aspect ratio of your image creatives and shows how spend is distributed across creatives with different aspect ratios. It also highlights the impact of aspect ratio on your optimization metrics.
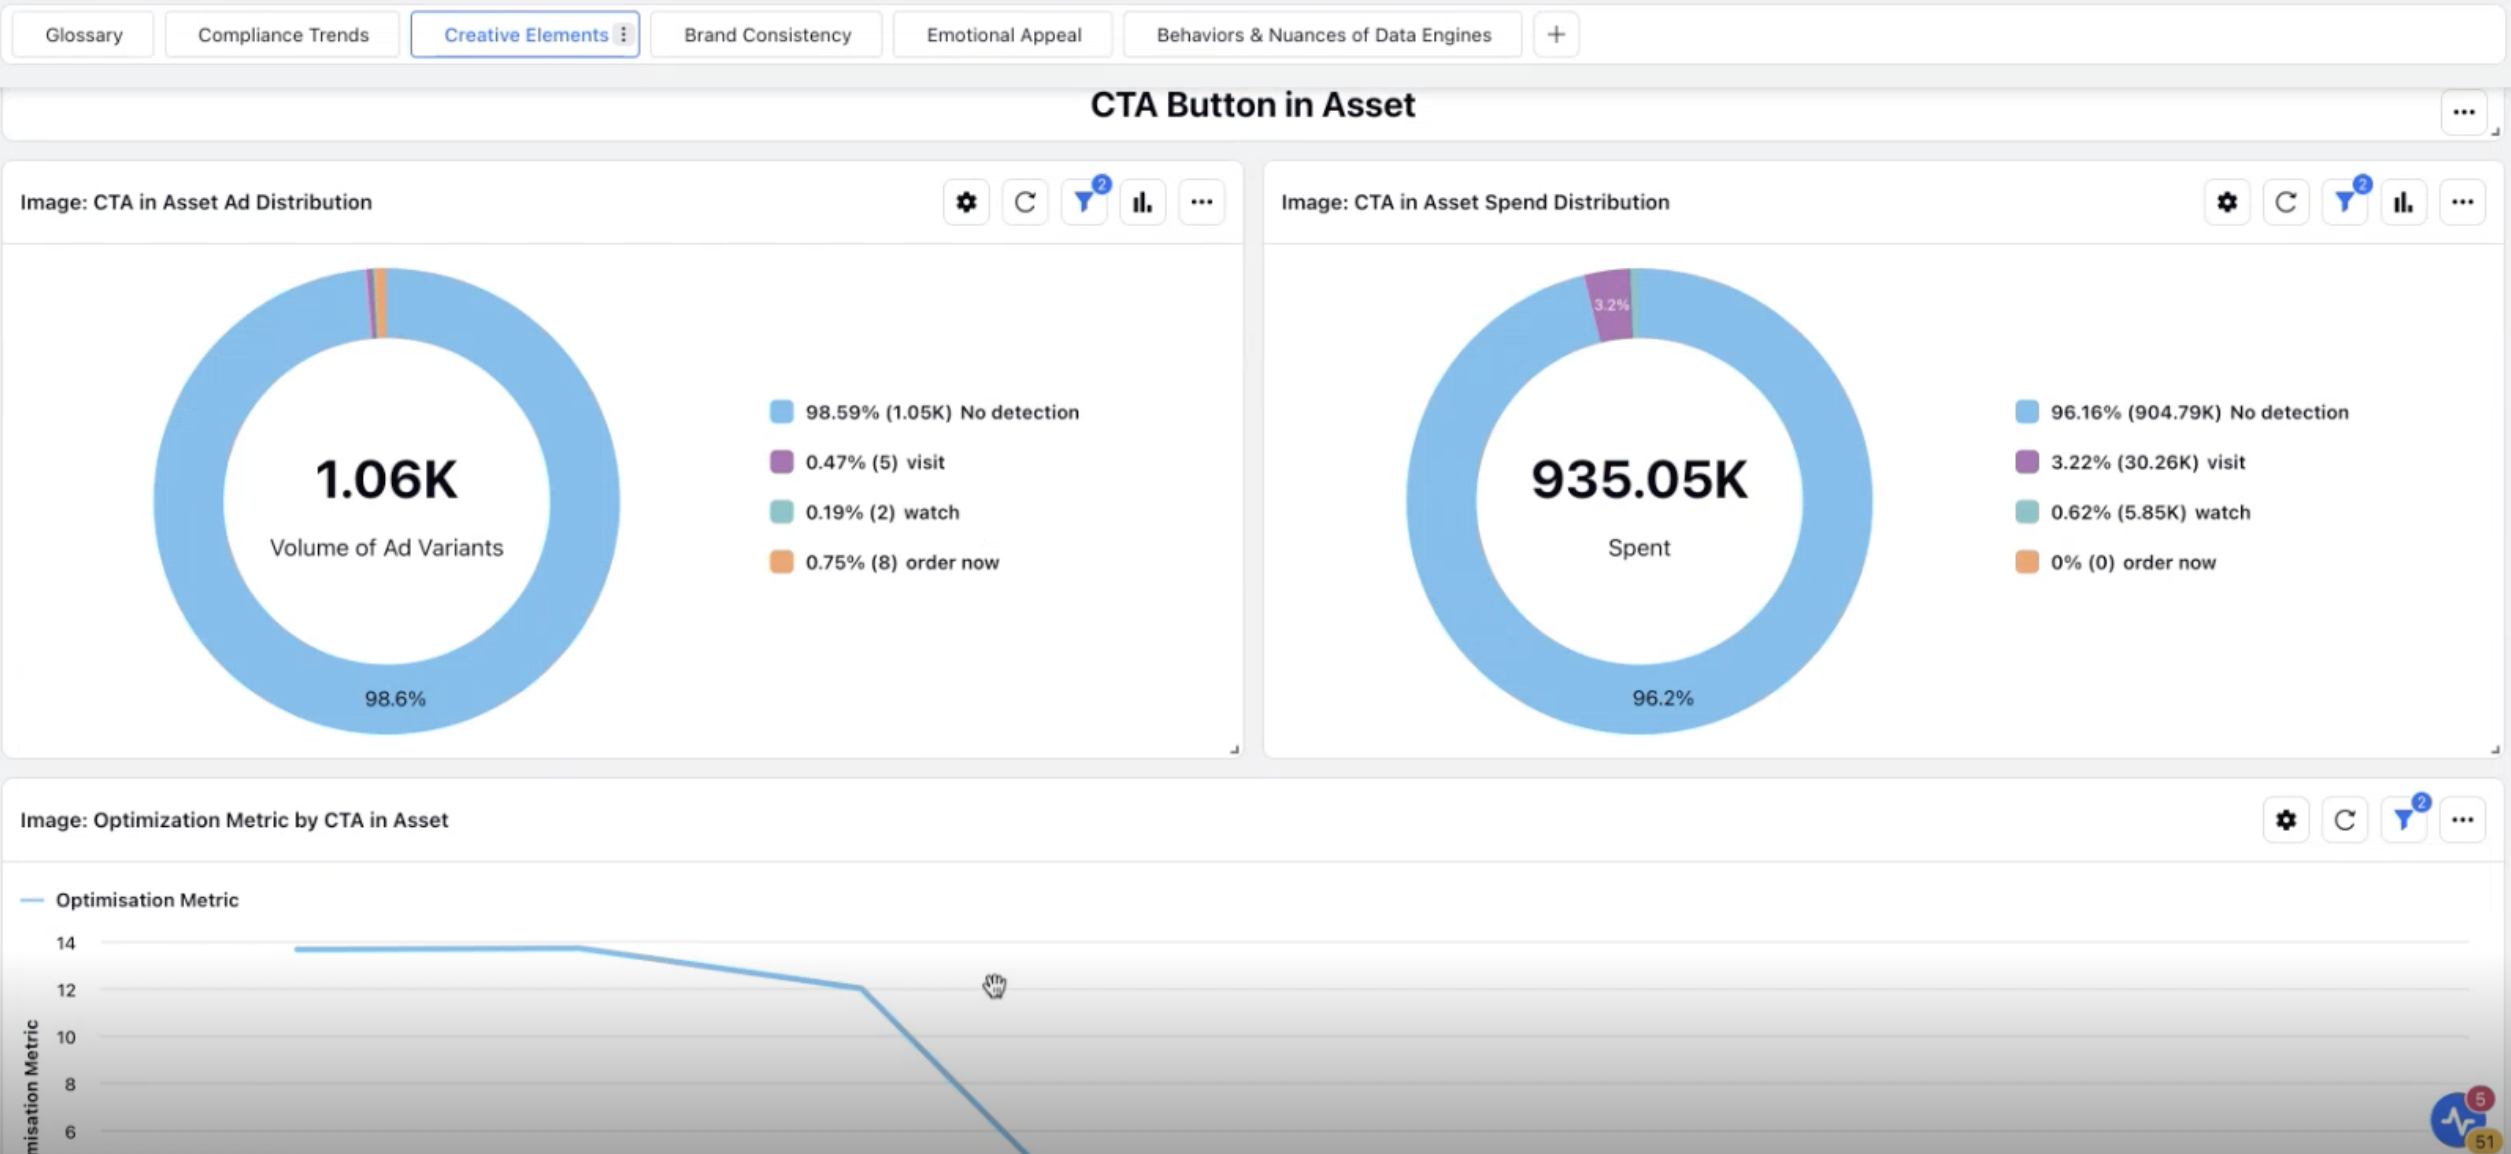
CTA Button in Asset: Analyzes the performance of different CTA buttons used in your image creatives, including spend distribution and the impact of CTA choice on optimization metrics.
CTA Position in Asset: Offers insights into how your audience responds to different CTA positions within the creative and shows how many of your ads are adhering to the selected positions.
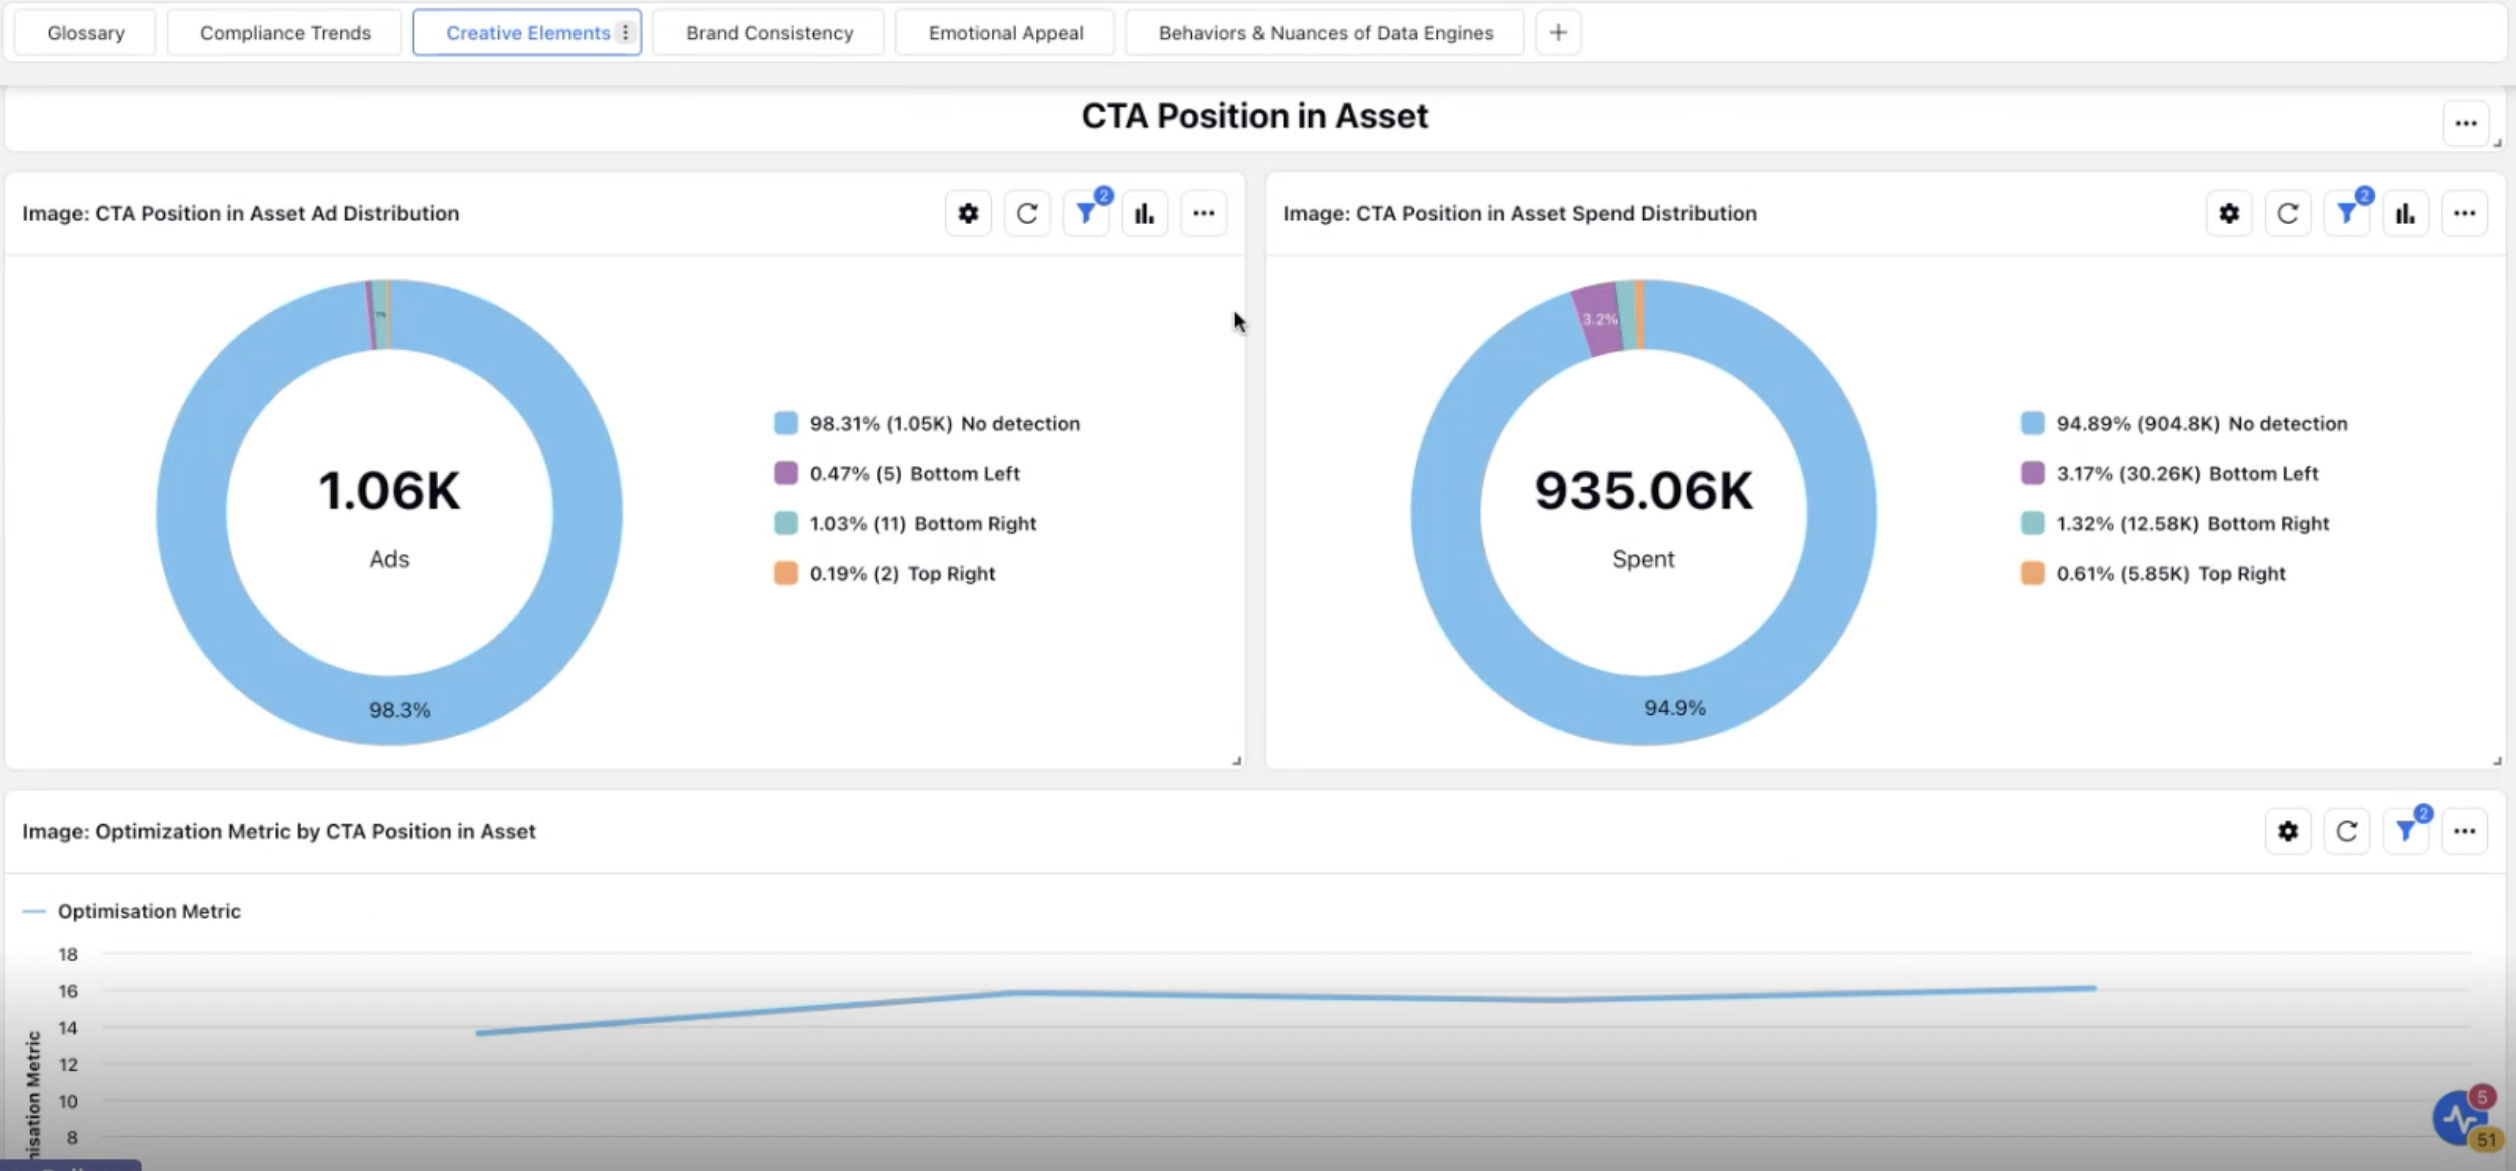
Headline Length: Assesses the length of the text within your asset (excluding the ad post) and its impact on performance.
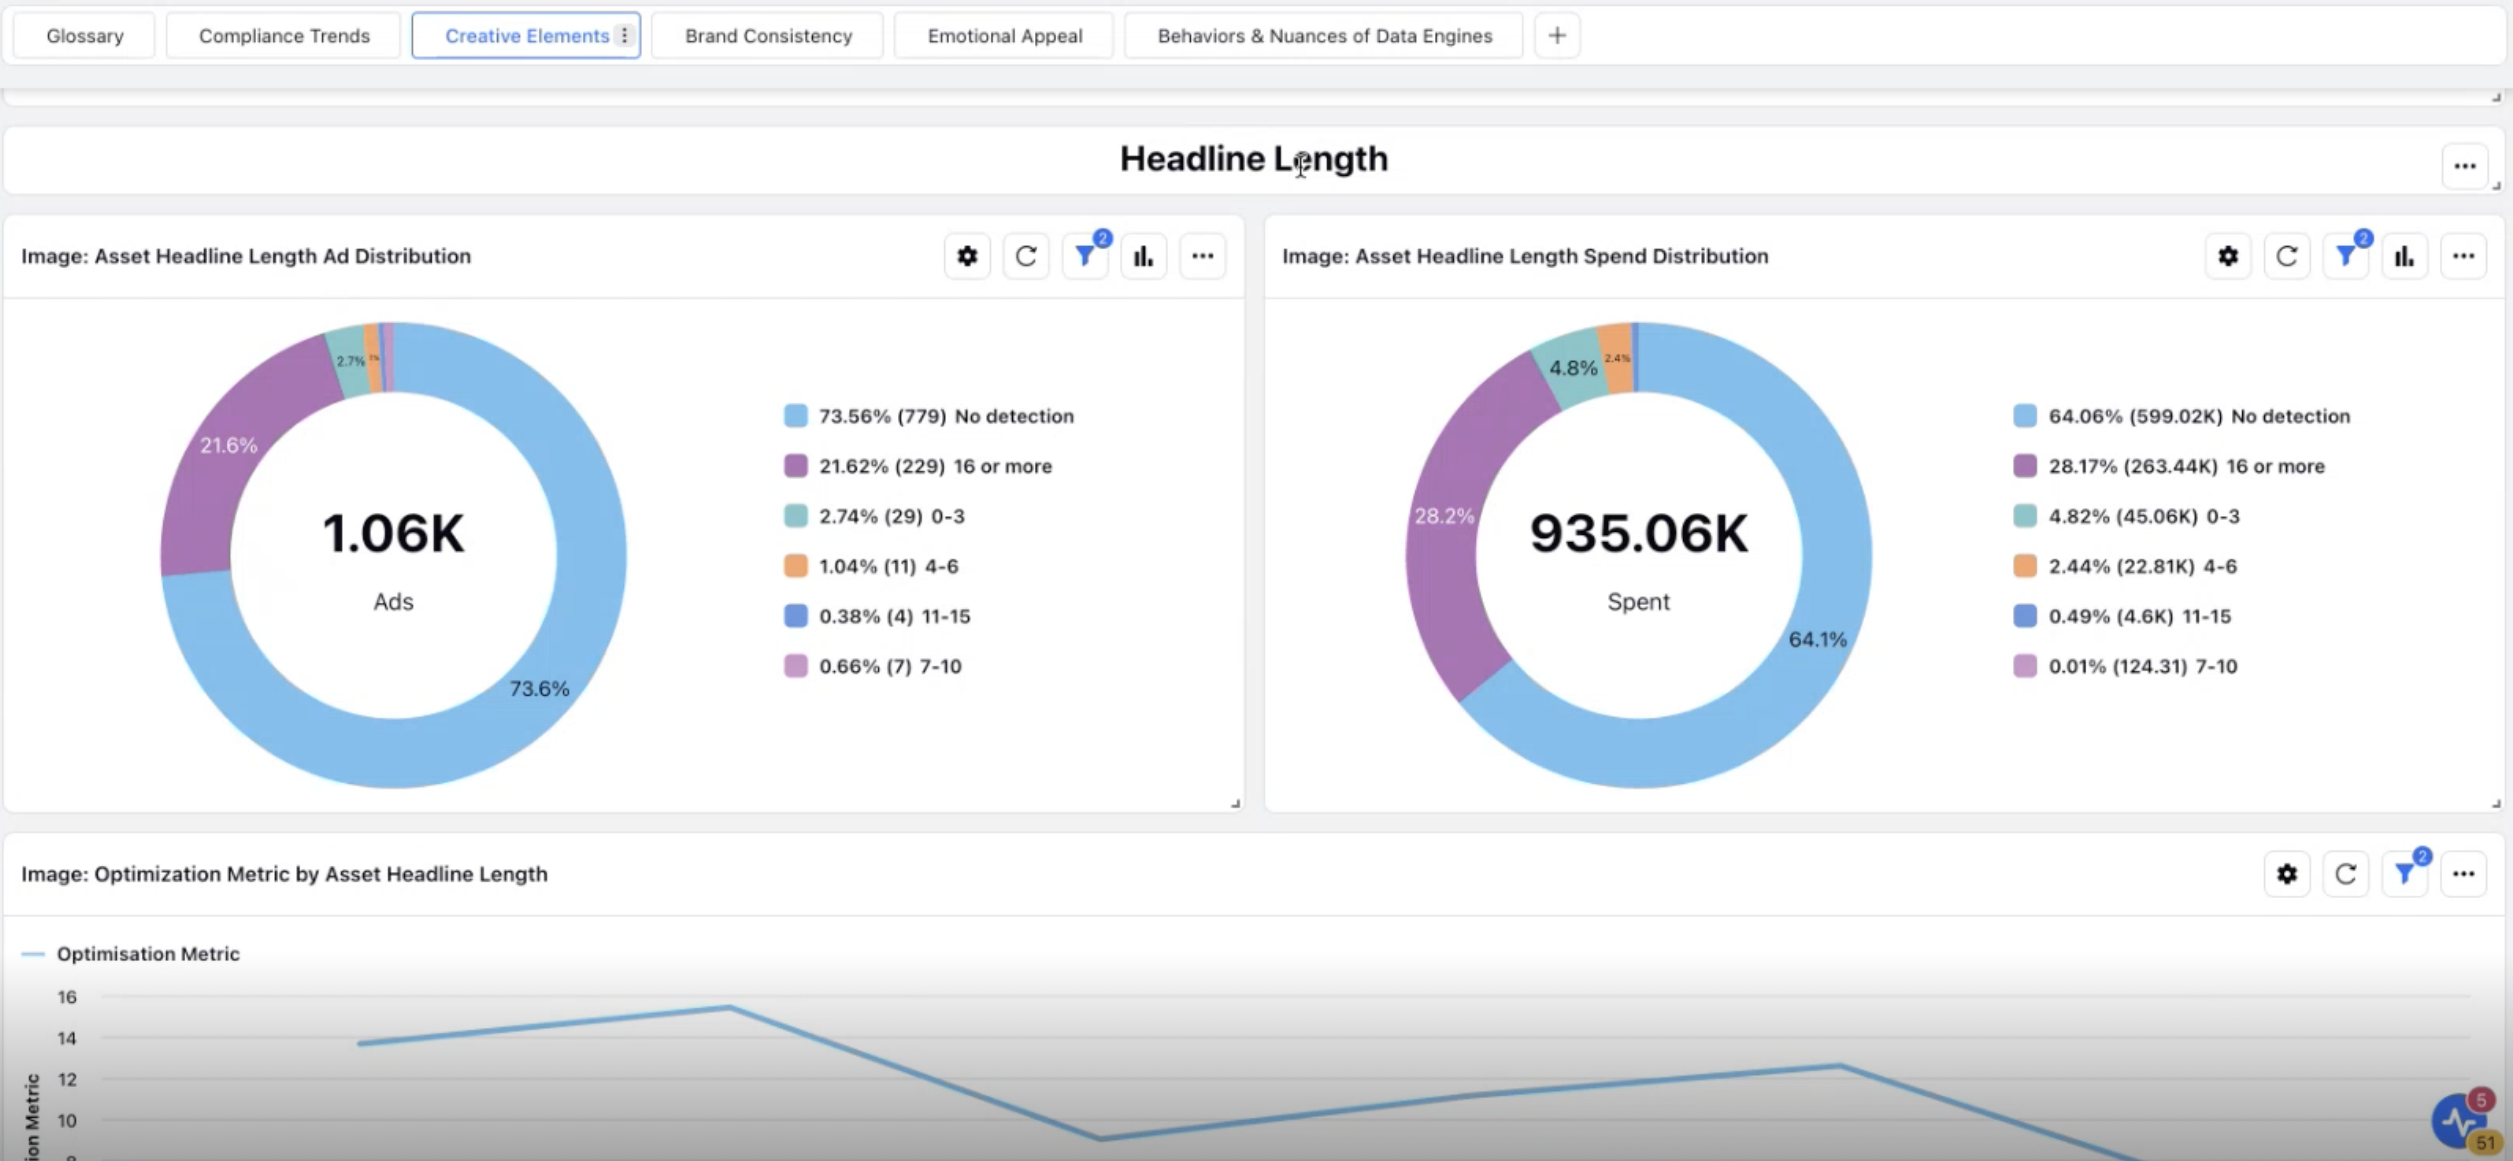
Prominent Colors: Identifies the colors detected in your assets and shows the percentage of each color's presence across the total number of assets, helping you assess color usage. For example, if Pink appears in 1 ad out of 1000 it's presence is 0.1%.

Language in Asset: Analyzes the language used in the text within the asset itself.
Language in Ad Copy: Focuses on the language used in the ad post, specifically the headline and description fields. This helps you identify if any ads are published in undesired languages.
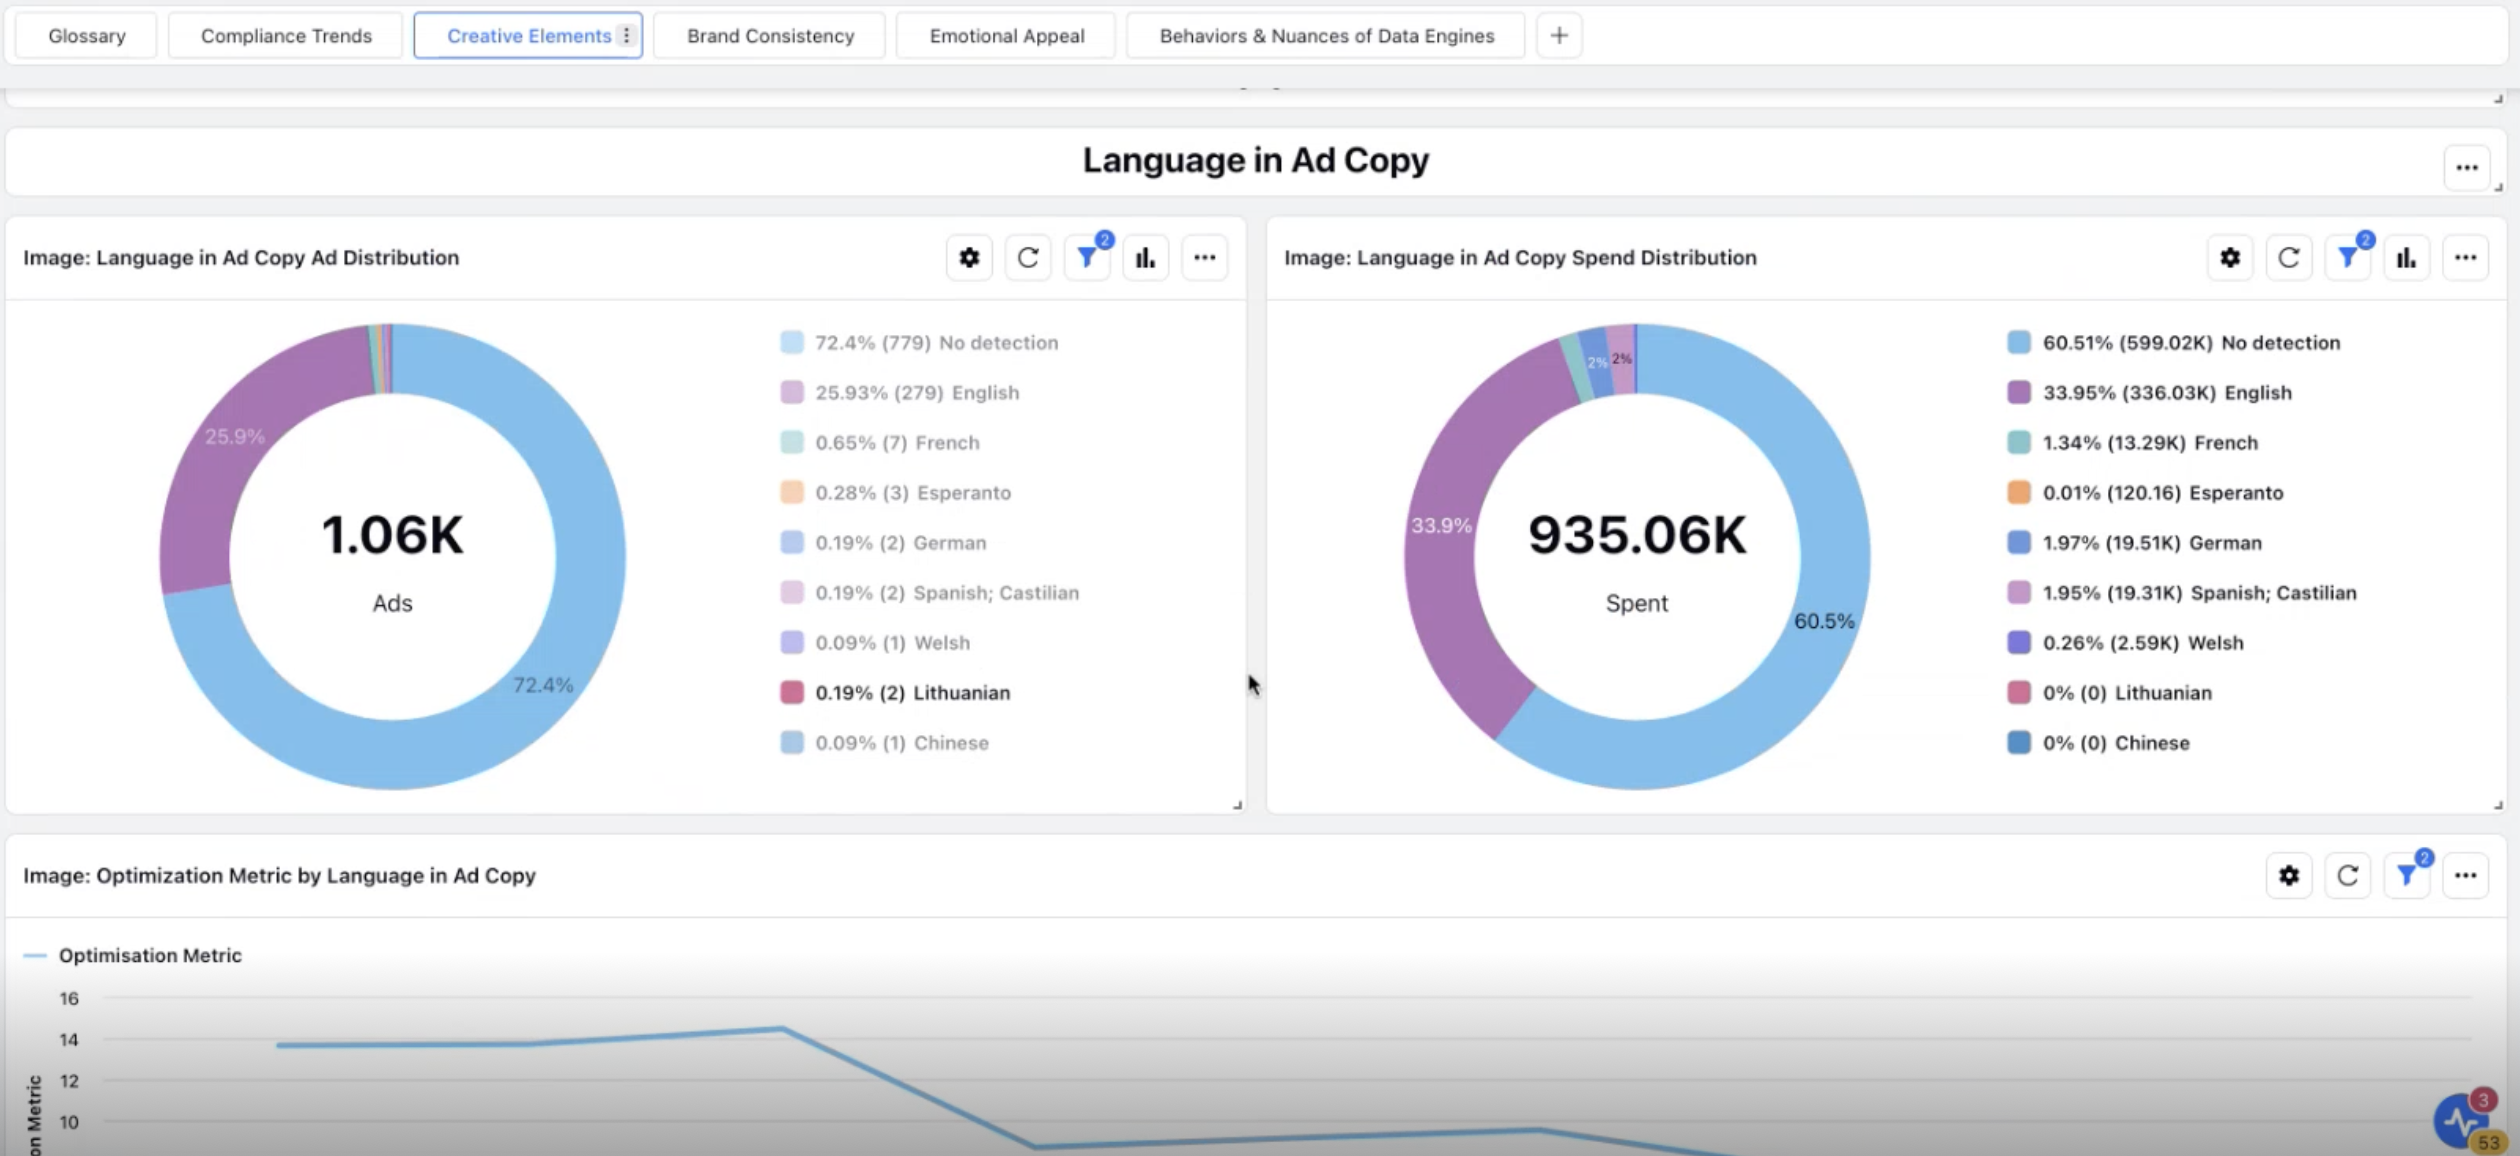
Text Overlay in # of words: Measures how much of your asset is covered by text and counts the number of words in different portions of your ads.

Urgent Claims in Ad: Tracks whether your ads include urgent claims, often used during seasonal sales (e.g., Black Friday, Cyber Monday). Examples include calls to action like "Buy Now," "Limited Availability," or "Subscribe Now."
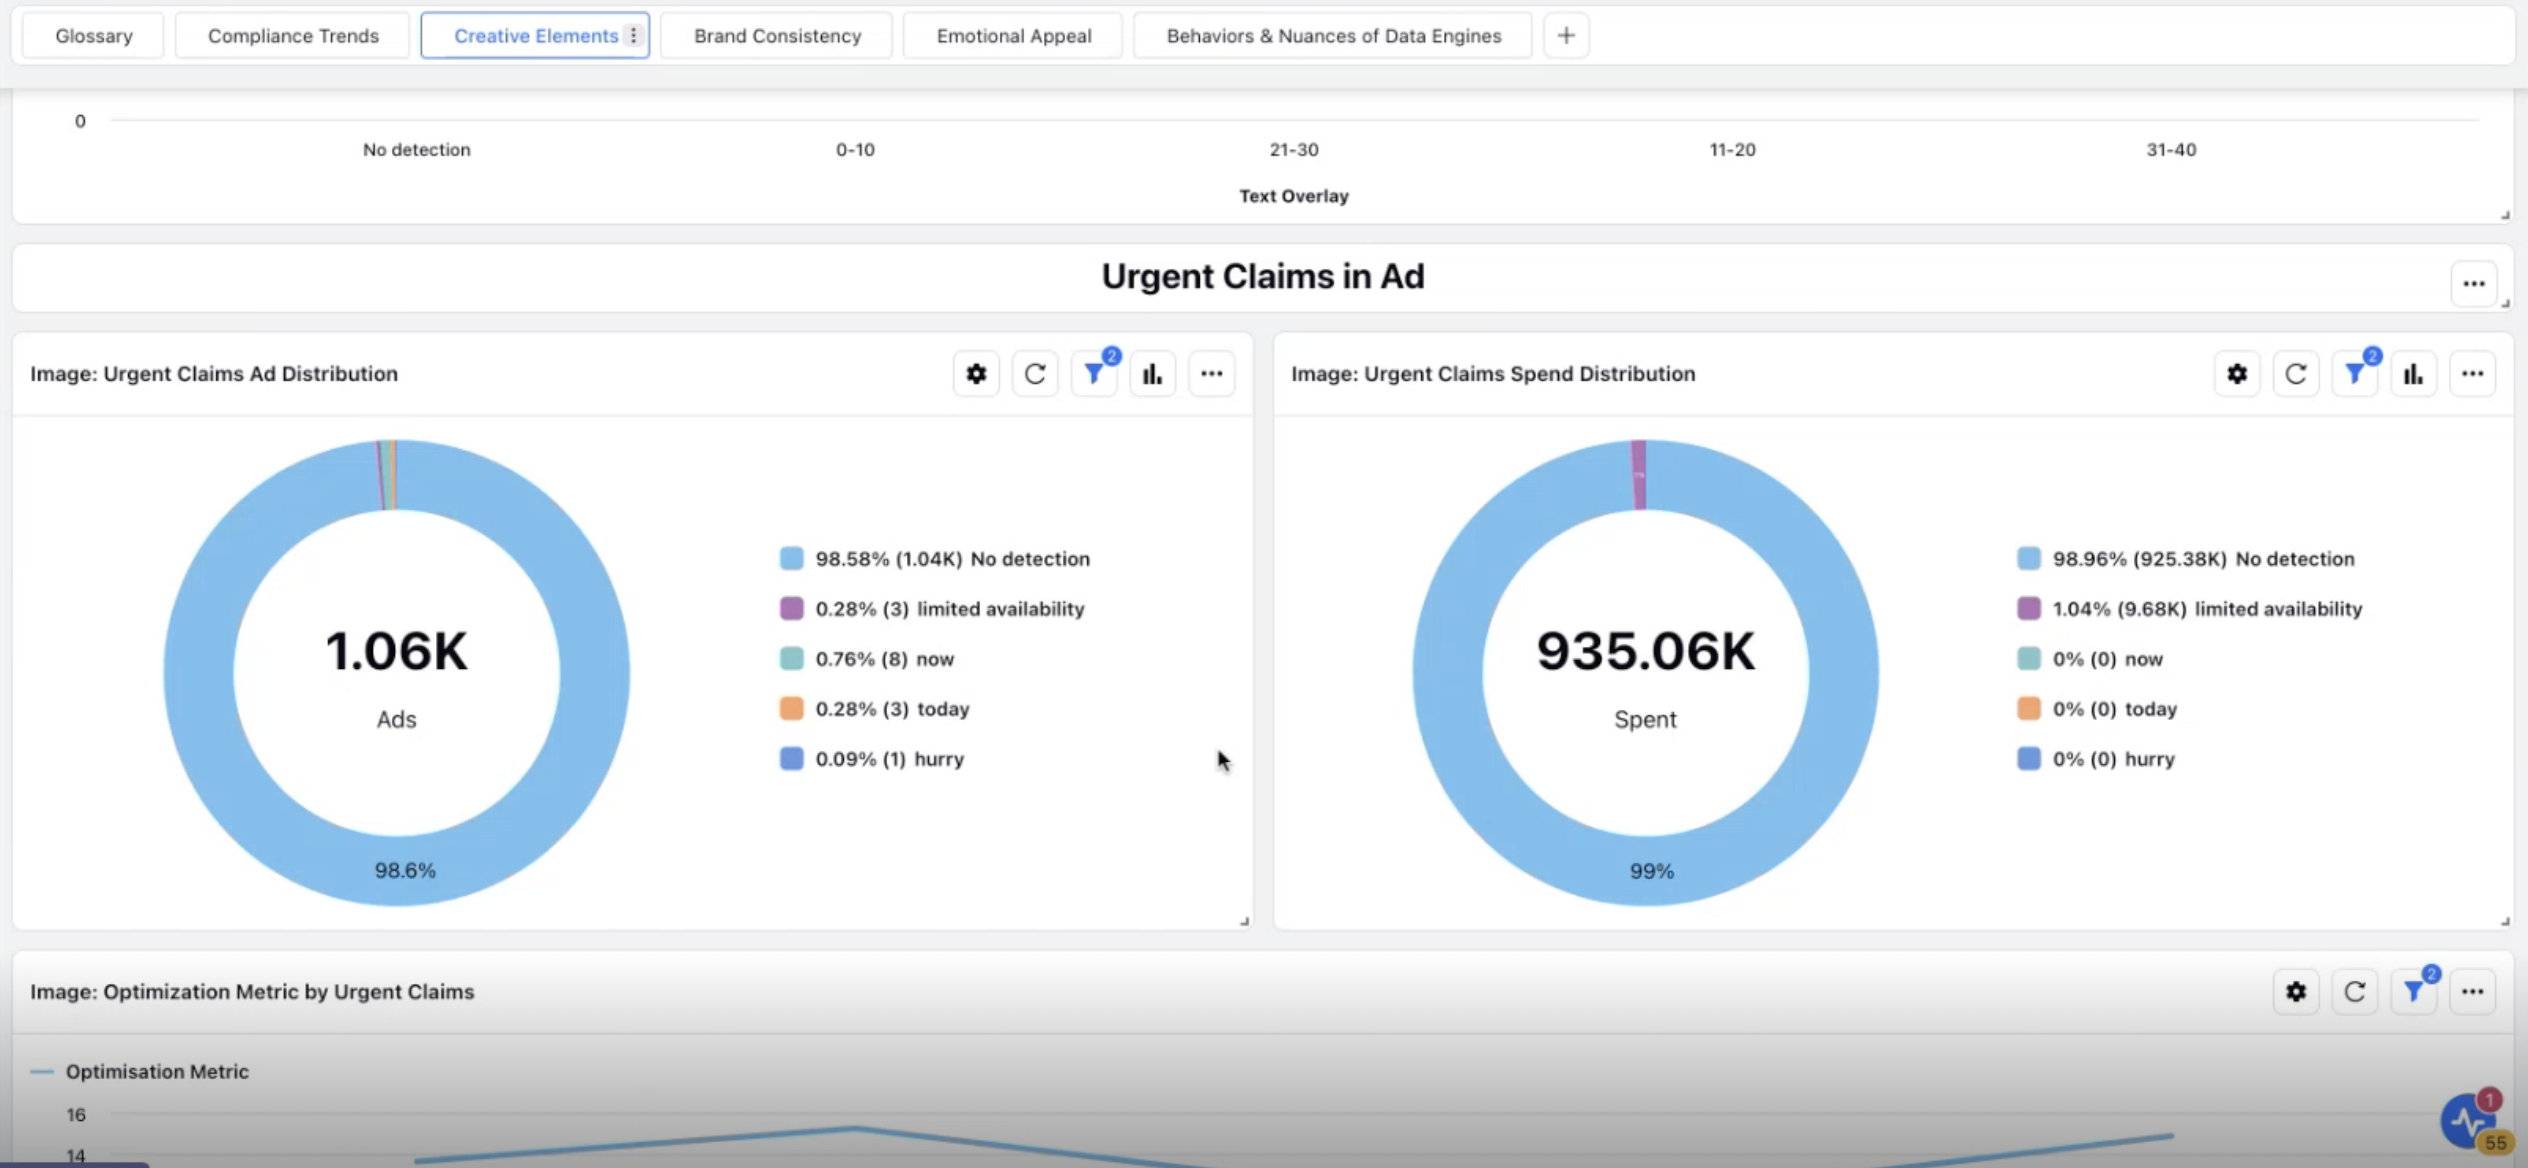
Video Creatives Performance Insights - For video creatives, several of the same dimensions used in Image Creatives Performance Insights (such as Aspect Ratio, CTA Button, Headline Length, Prominent Colors, and Language in Ad Copy) are also analyzed. Since video ads are evaluated at the frame level, each frame is treated as an individual image. For example, a 10-second video with 4 to 5 frames will have each frame analyzed for performance, and the overall video will be linked to the relevant aspect ratio and dimensions.
In addition to the dimensions covered for image creatives, video assets are evaluated based on the following additional elements:
Video Length: Assesses the length of the video and how it aligns with channel guidelines, which often recommend keeping video assets under a certain size or duration.
Sound Presence: Identifies whether your video asset contains audio.
Audio Language: Analyzes the language used in the audio of the video.
Subtitle Presence: Evaluates the presence of subtitles, including text size, position, and whether the subtitles appear continuously across all frames of the video.
Language in Asset: Breaks down the language used in any text within the video.
Subtitle Language: Analyzes the language used in the subtitle of the video.
Brand Consistency
Brand consistency ensures that your creatives align with your brand identity. It checks for key brand elements, such as your logo, brand image, and overall design. It involves delivering messages that reflect core brand values in a consistent tone, displaying your logo in a uniform way, and using the same color scheme across all visual elements. Consistency also guarantees that your brand remains easily recognizable across various marketing channels and touchpoints. In this section, brand consistency is evaluated separately for image and video assets -
Images - Brand consistency for images is evaluated based on the following elements -
Brand Present in Asset: Identifies the absolute count and percentage of ads that feature brand logos or text in images, along with the distribution of spend across those ads.
Brand Name Present in Asset: Analyzes text and logo image within an asset to identify the presence of brand or sub-brand names and tracks the spend distribution for these ads.
Logo Presence: Detects the logos or sub-brands used in your assets (excluding textual mentions of logos).
Logo Position: Examines the positioning of logos within your creatives, as audience interaction varies based on where the logo appears. The analysis categorizes logo positions as top left, top right, bottom left, bottom right, and center.
Videos - Brand consistency for videos is evaluated based on the following elements -
Brand Present in Asset - Identifies the percentage of video ads that include brand logos, text, or audio and tracks the distribution of spend across these videos.
Brand Name Present in Asset - Detects the presence of brand names or audio mentions within the video.
Logo Presence - Identifies the logos or sub-brands used in your video assets (excluding textual mentions of logos).
Logo Position - Analyzes where logos are placed in video assets. Audience engagement can vary based on the logo's position, and the detection process categorizes this as top left, top right, bottom left, bottom right, or center.
Brand Recurrence - Tracks whether the brand appears in at least three key frames of the video, either as a symbol or text. This helps assess whether repeated brand exposure can increase audience engagement.
Early Brand Introduction - Measures the volume and spend distribution of video assets where the brand name is introduced within the first 5 seconds, which is crucial for early audience recognition.
Emotional Appeal
Emotional Appeal evaluates how effectively your creative assets connect with your audience on an emotional level. This focuses on the human elements in your content, including the presence of people and how they are portrayed when showcasing your products. It measures how these elements impact the end user. Emotional Appeal is assessed separately for image and video assets.
Images - For images, we evaluate two key dimensions:
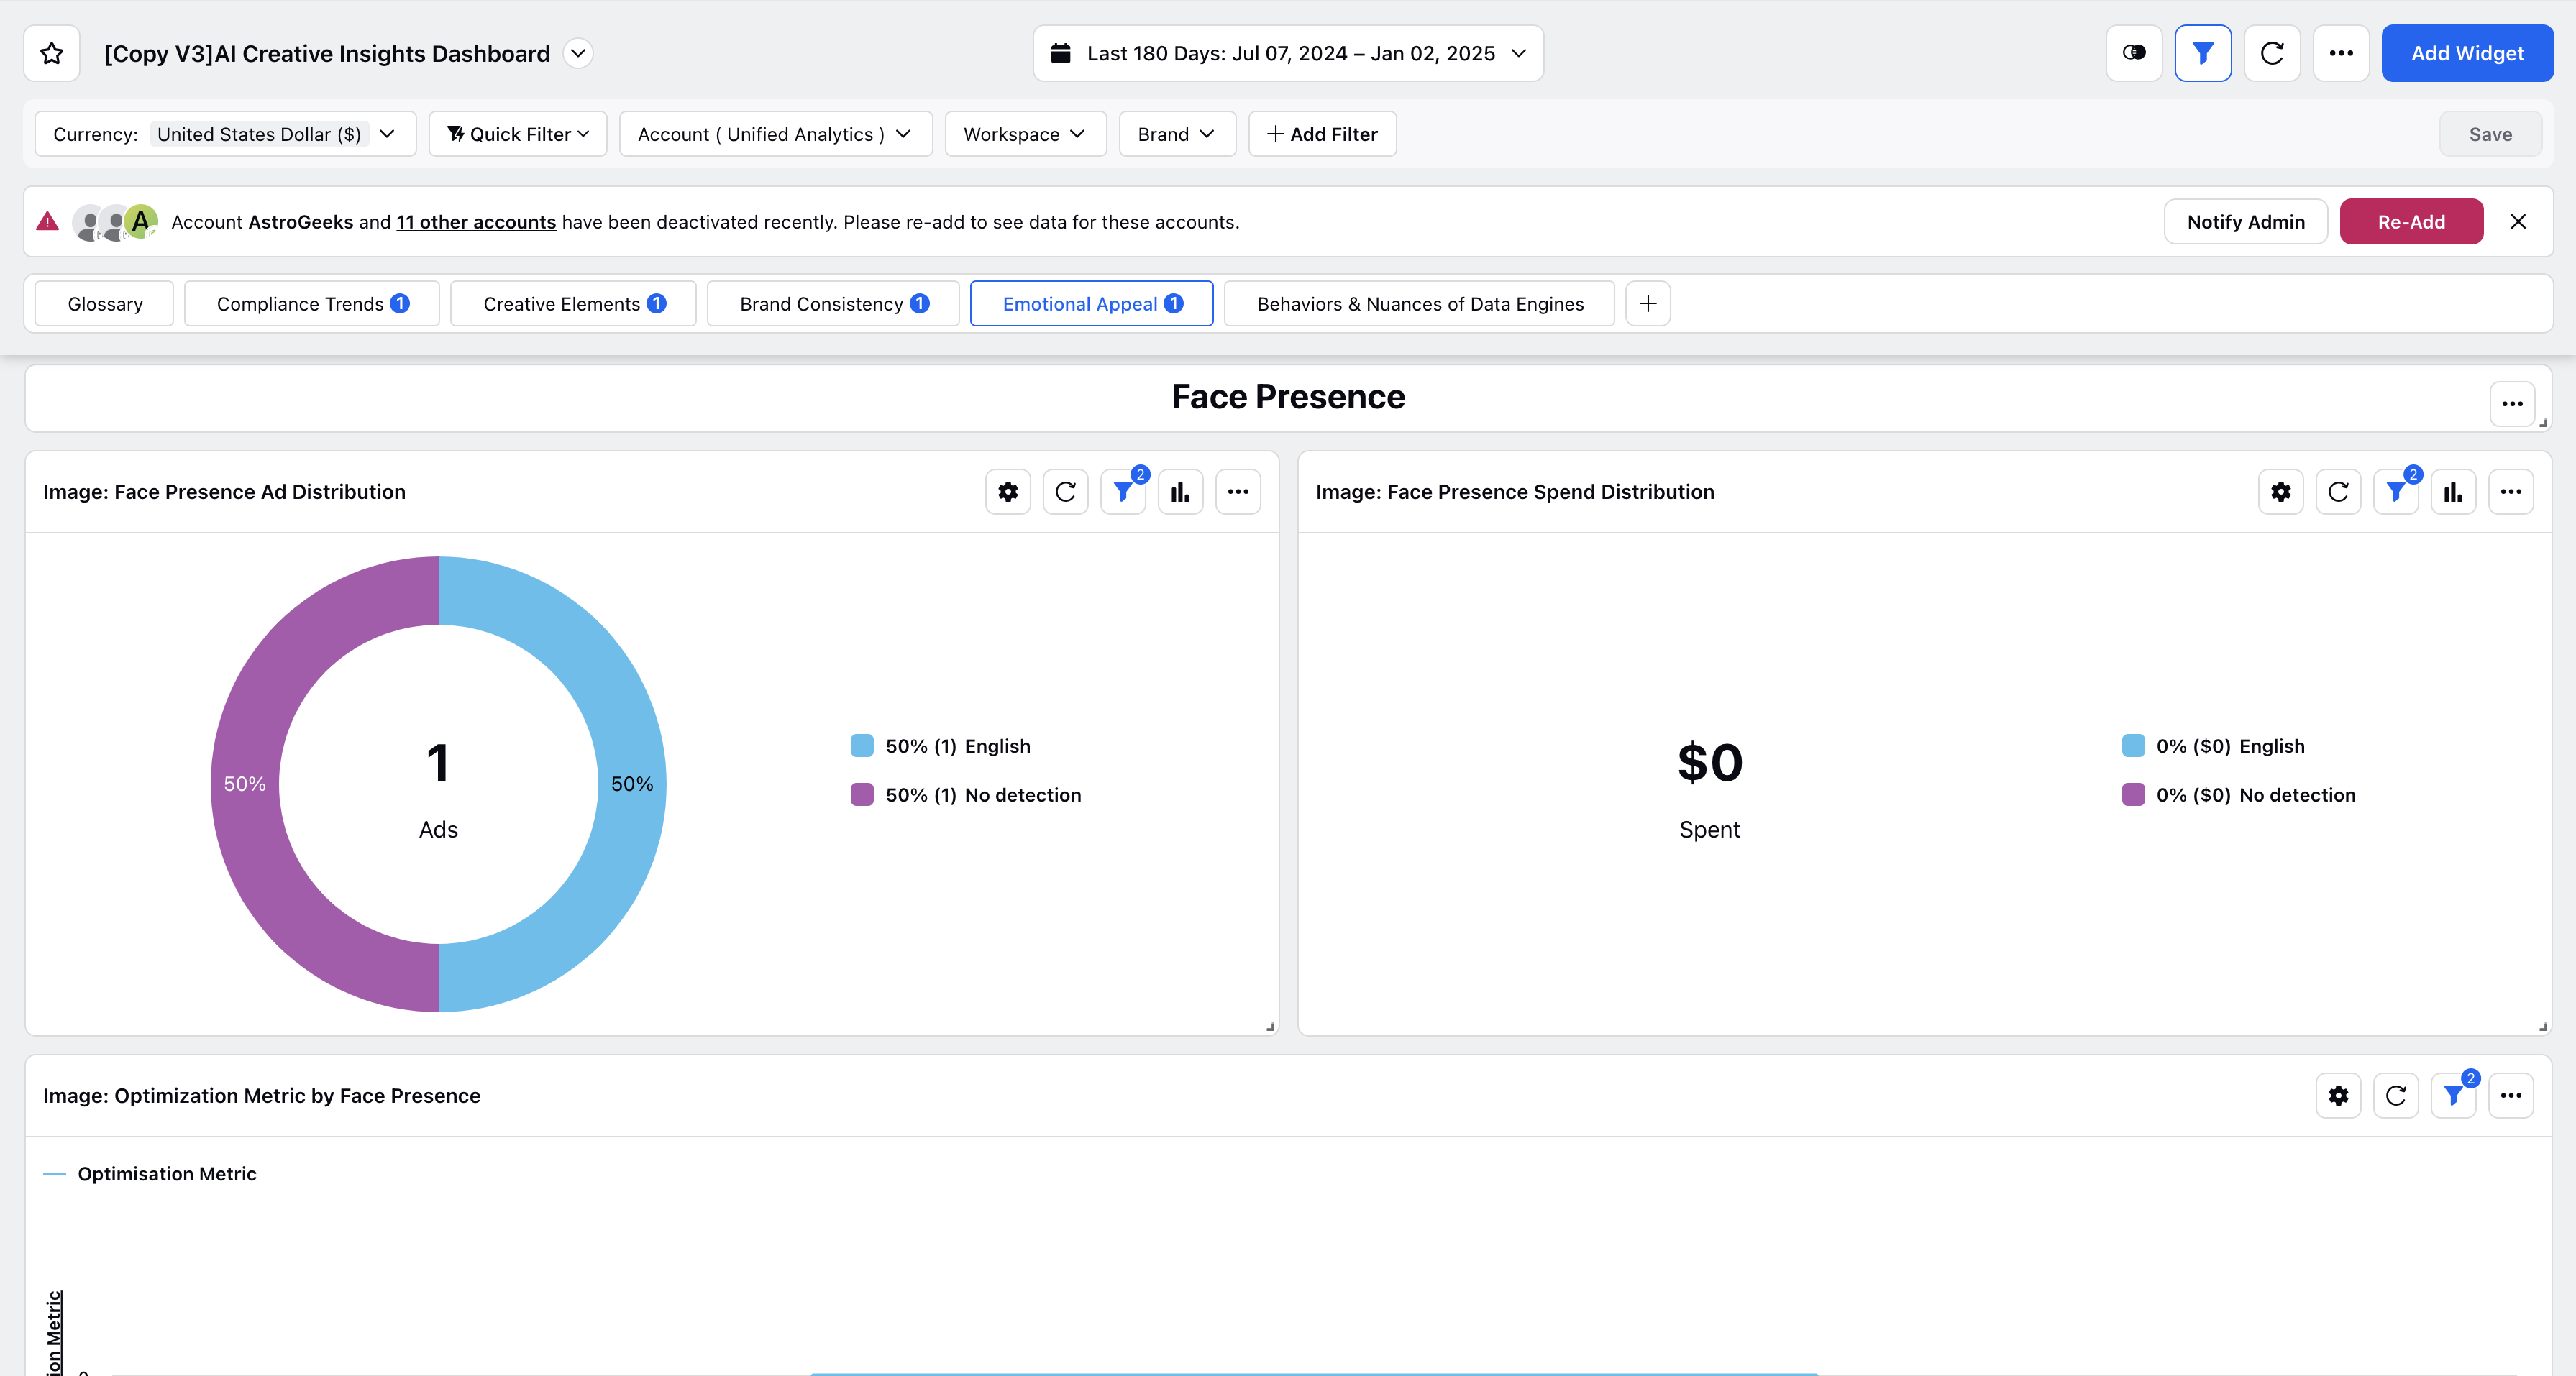
Face Presence: We analyze the volume and spend distribution of ads featuring images with faces.
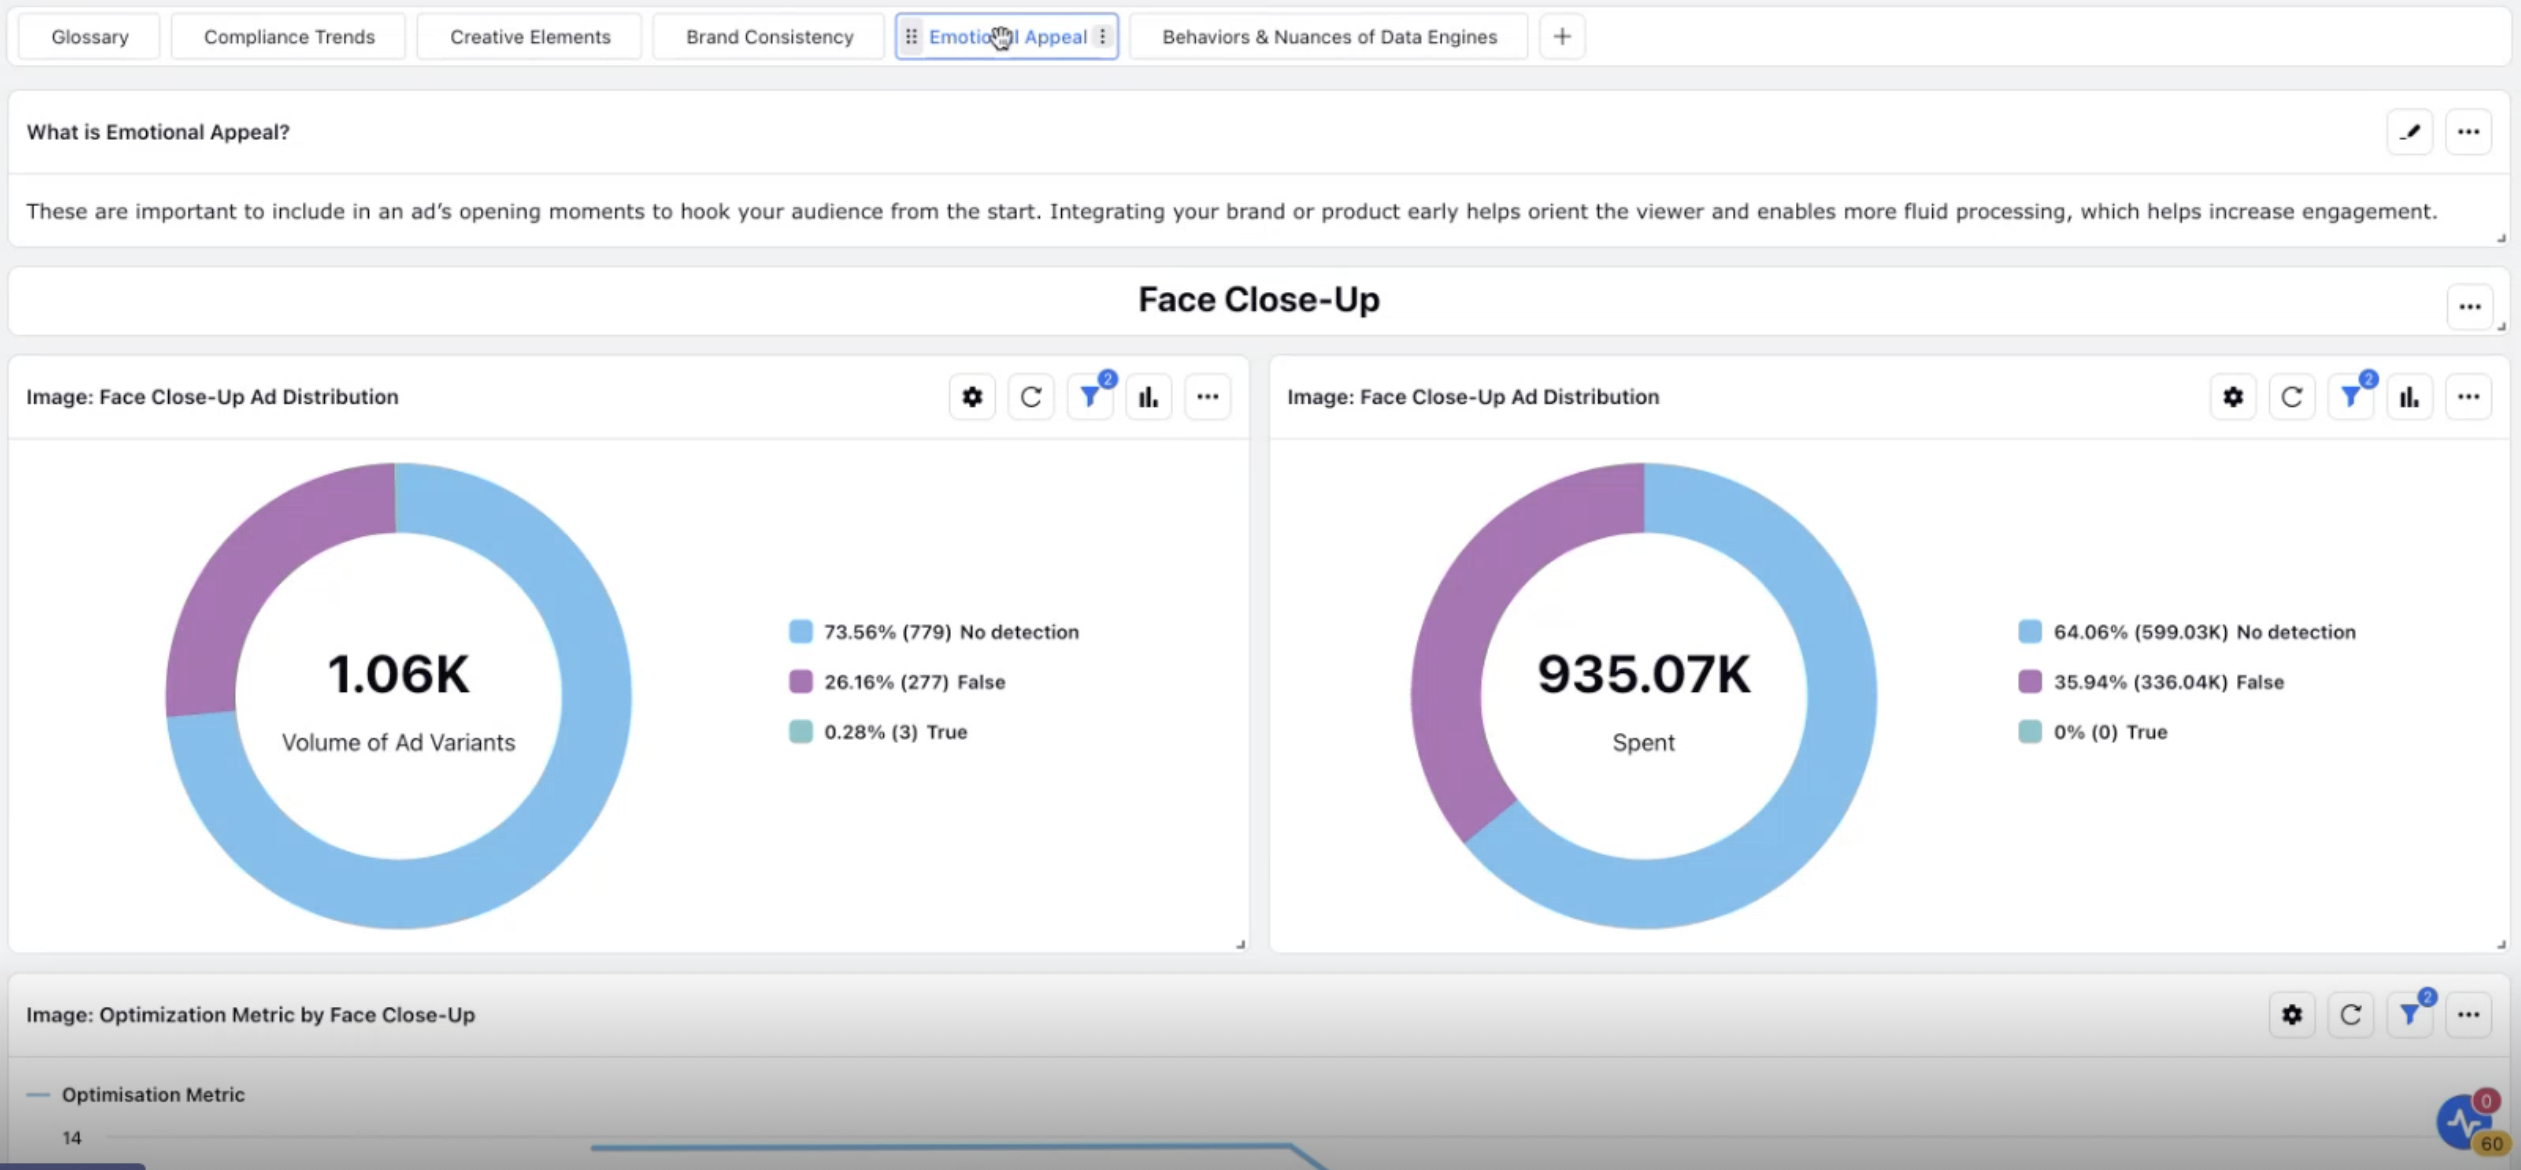
Face Close-Up: We analyze the volume and spend distribution of ads featuring images with a face close-up. An image is considered to have a face close-up if a human face occupies a significant portion of the image.
Human Presence: We assess the volume and spend distribution of ads with images that include a human presence.

Videos - For videos, we consider the following dimensions:
Face Presence: We analyze the volume and spend distribution of ads featuring videos with faces.
Face Close-Up: We analyze the volume and spend distribution of ads with videos that feature a face close-up.
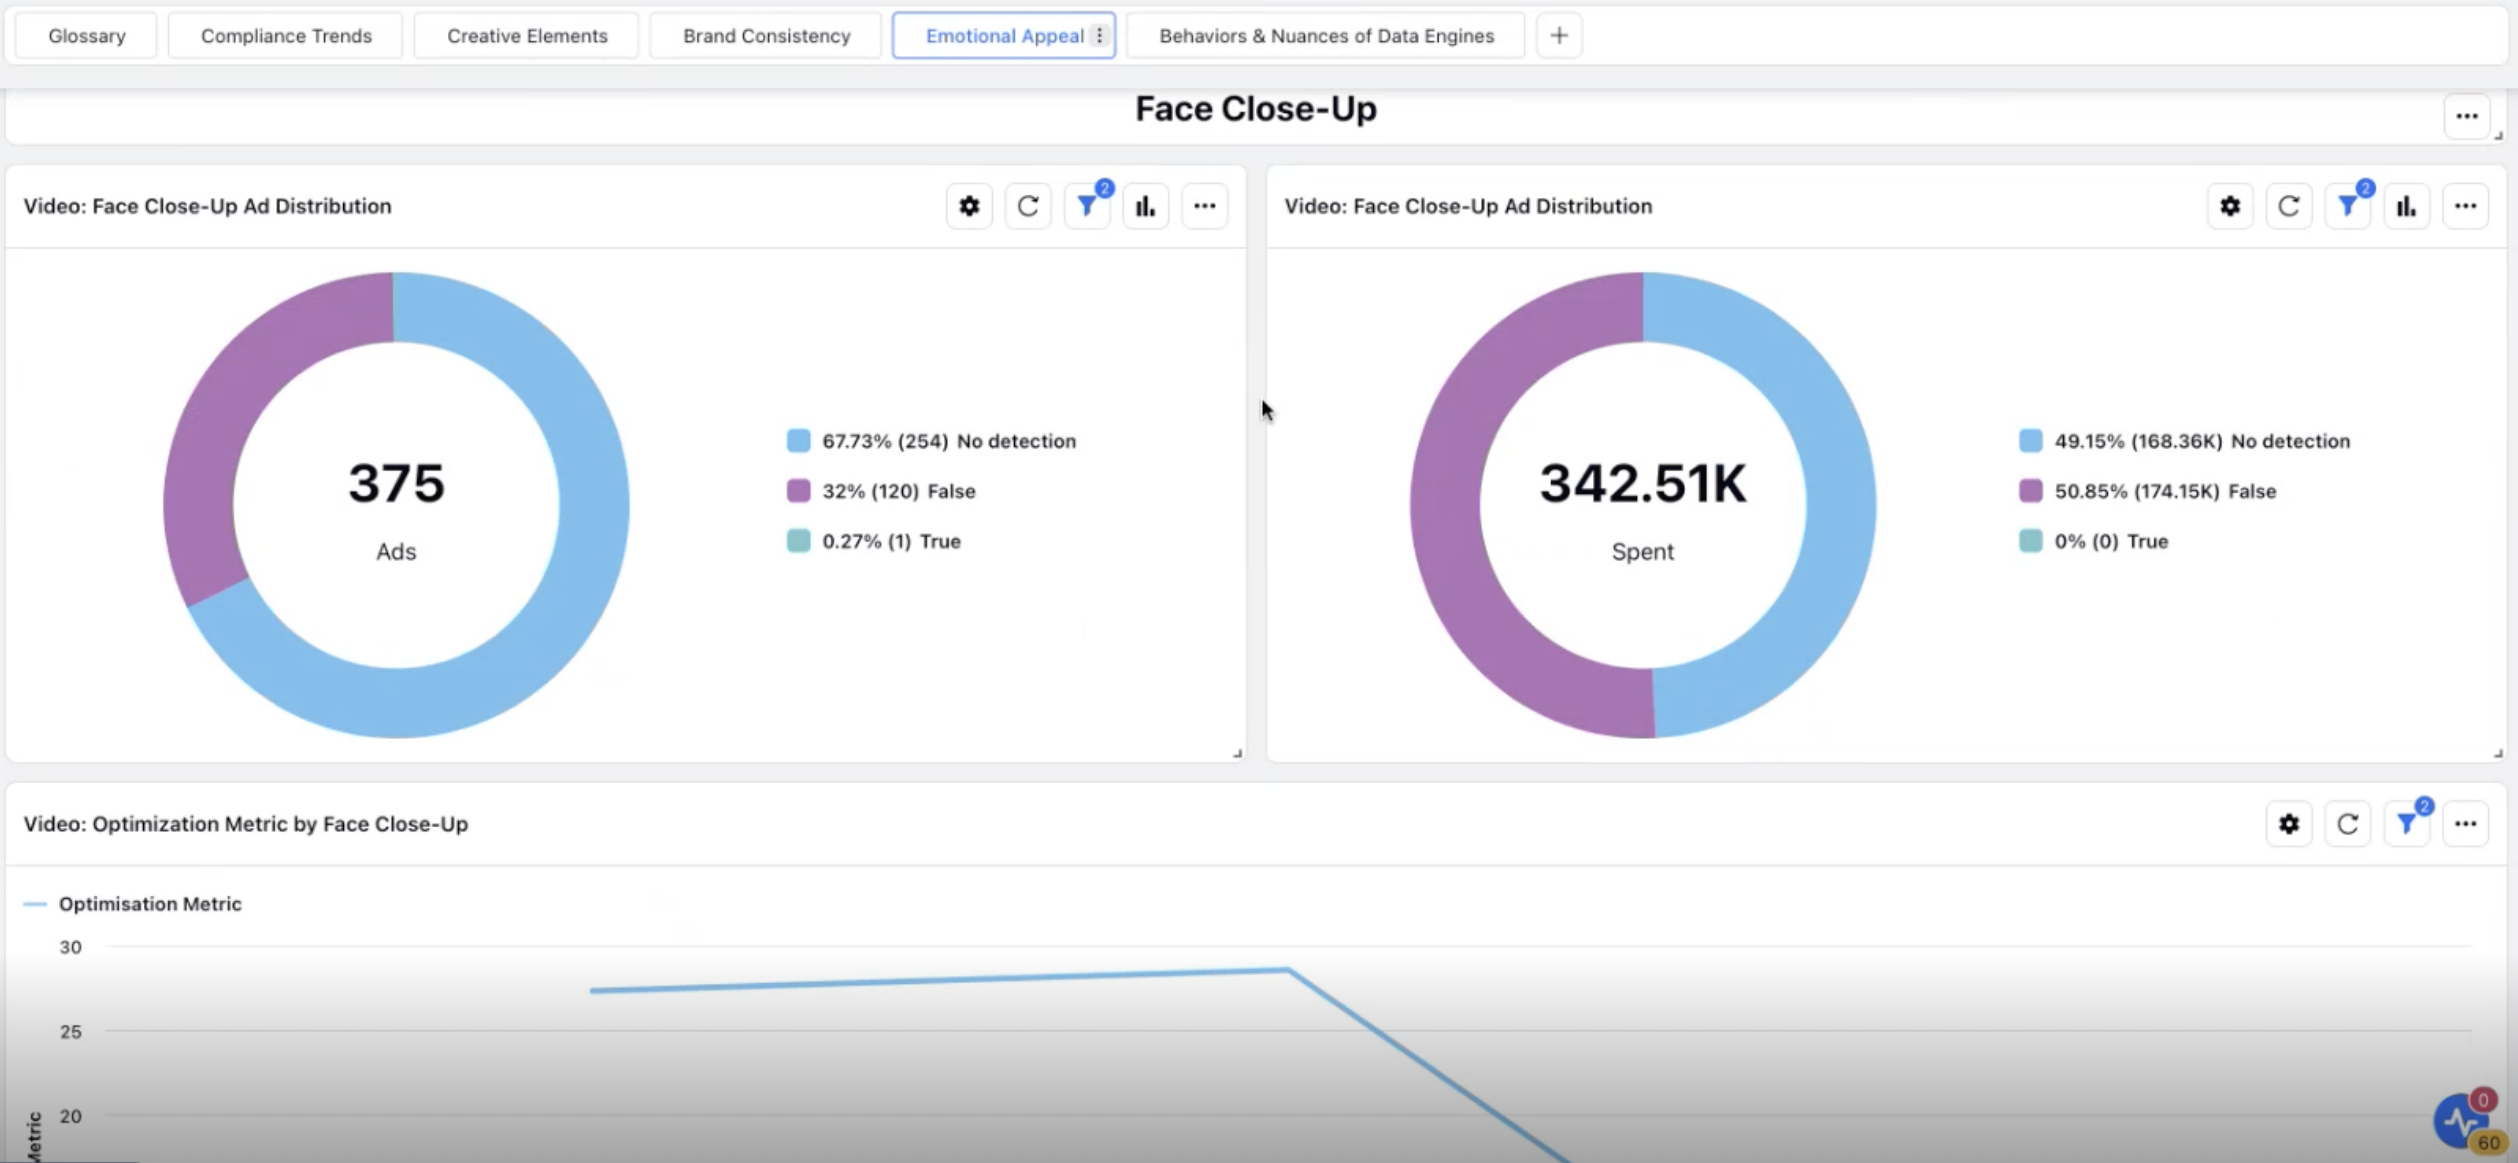
Face Presence within 5 Seconds: We assess the volume and spend distribution of ads where a face appears within the first 5 seconds of the video. This is a distinct dimension from face close-ups.
Human Presence: We evaluate the volume and spend distribution of ads with videos featuring a human presence.
Human Presence within 5 Seconds: We measure the volume and spend distribution of ads where a human appears within the first 5 seconds of the video.
Motion in the First Second: We examine whether there is any motion within the first second of the video. Motion at the start typically engages viewers, encouraging them to stay engaged and want to see what happens next.
Behaviours and Nuances of Data Engines
This section outlines how each engine is expected to function, its potential limitations, and the output you can anticipate from it. For example, when detecting colors, the engine will only identify the following colors: Green, Brown, Yellow, Purple, White, Red, Blue, Pink, Grey, Black, and Orange. For a detailed list of Creative AI Insights Limitations, click here.
