Filters in Reporting Dashboard
Updated
Filtering reporting dashboards and widgets can help you get relevant data quickly and easily, allowing you to hone in on the information that you need to see for a more focused visualization of data. Whether you need to see the social performance of a single social account, remove older campaigns from the data you're seeing, or zero in on a specific social channel, filters can help you work with reporting data without the need to duplicate dashboard creation.
Widget-Level and Dashboard-Level Filters
Filters are available at the dashboard level and at the widget level. Widget-level filters only apply to individual widgets in reporting and are available on custom dashboards only - standard reporting dashboards cannot be filtered at the widget level.
Dashboard-level filters apply to all the widgets on a reporting dashboard. Dashboard-level filters are available in custom and standard reporting dashboards.
To Apply a Widget-Level Filter
1. Click the New Tab icon. Under the Sprinklr Social tab, click Reporting within Analyze.
2. Select a custom dashboard or Create a New Dashboard using 'Create Dahsboard Option'.
3. Create a widget as per the required Data Point.
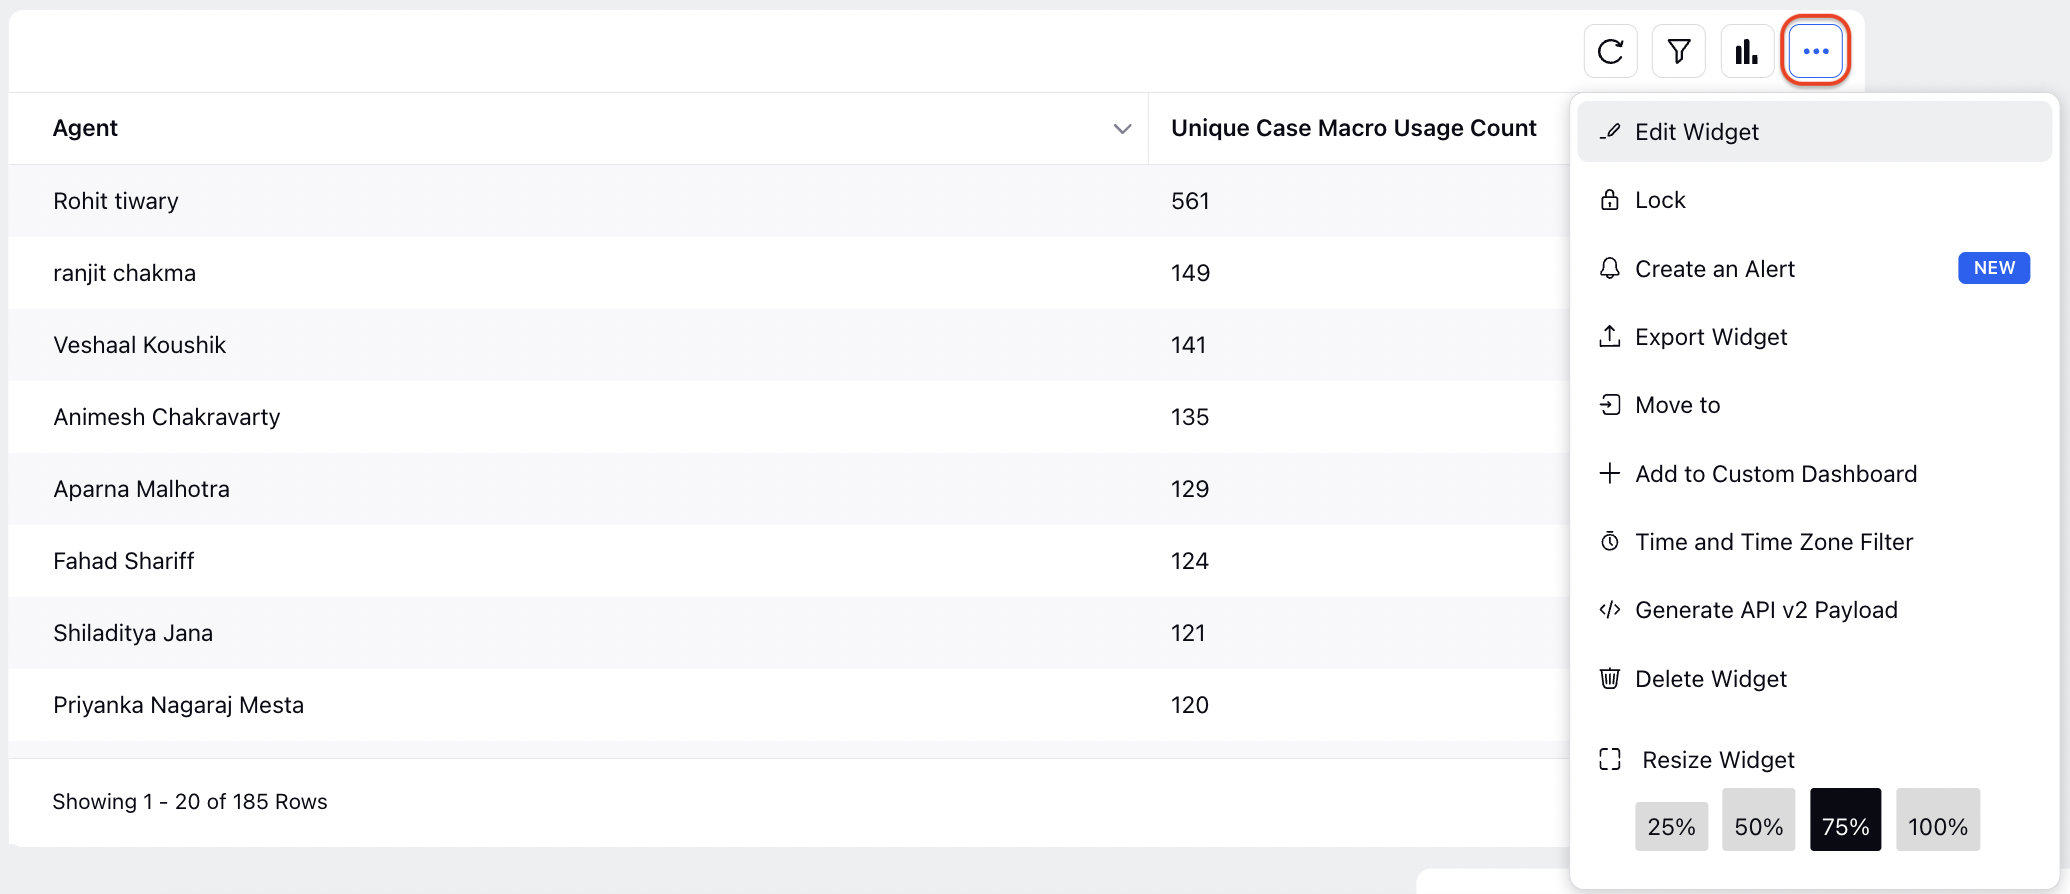
4. Select the Options icon in the top right corner of a custom widget and click Edit Widget to open the widget configuration window. This window is also available when creating new widgets.
5. In the Edit Widget window, you can apply filters to the widget in the Filters section.
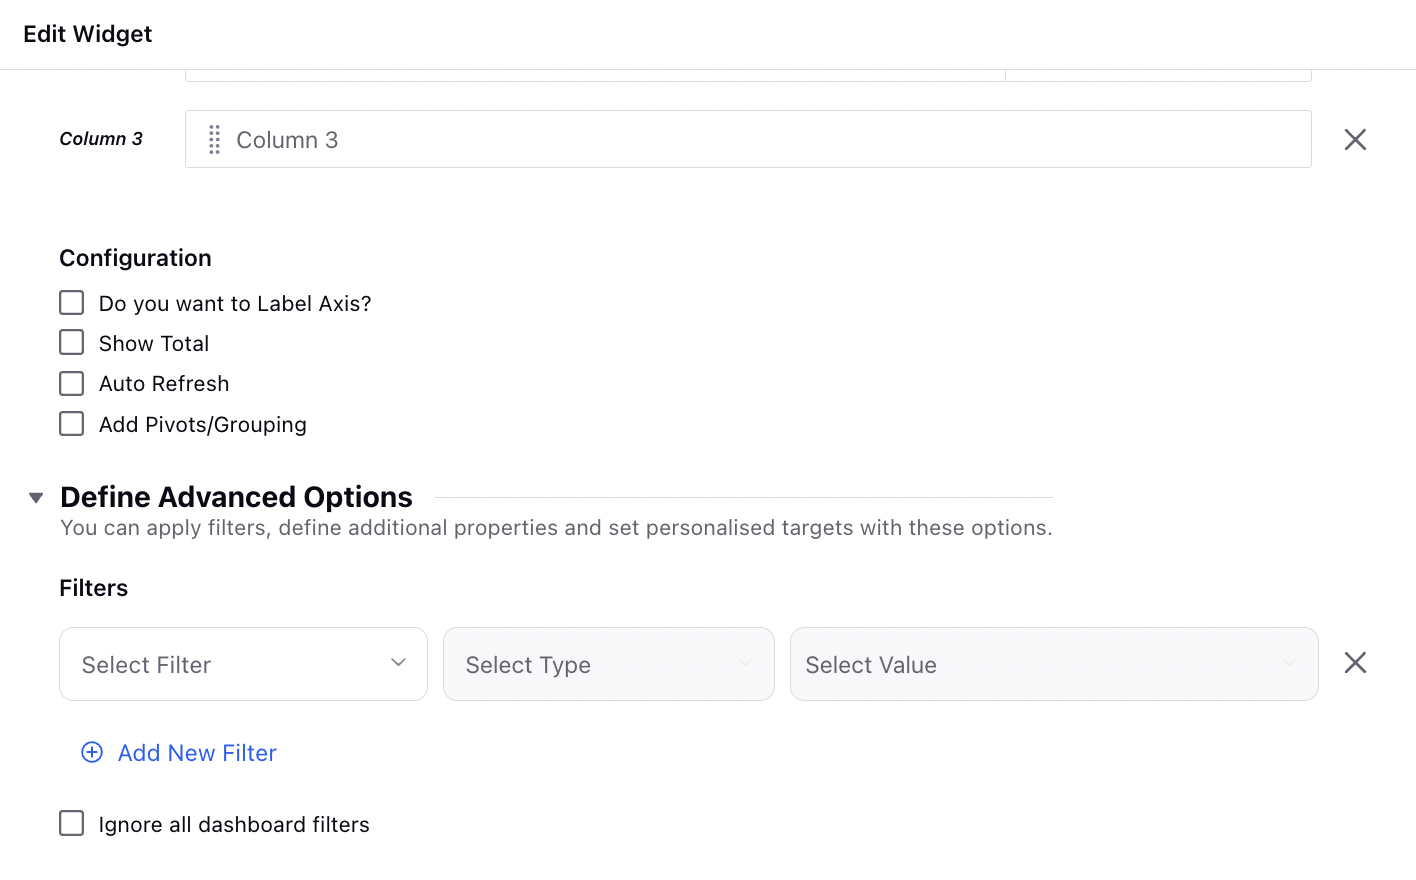
6. Select a dimension by which to filter, a filter type (the filter type generally notes if the widget will filter by data that does contain or does not contain the selected dimension), and set the values for the filter.
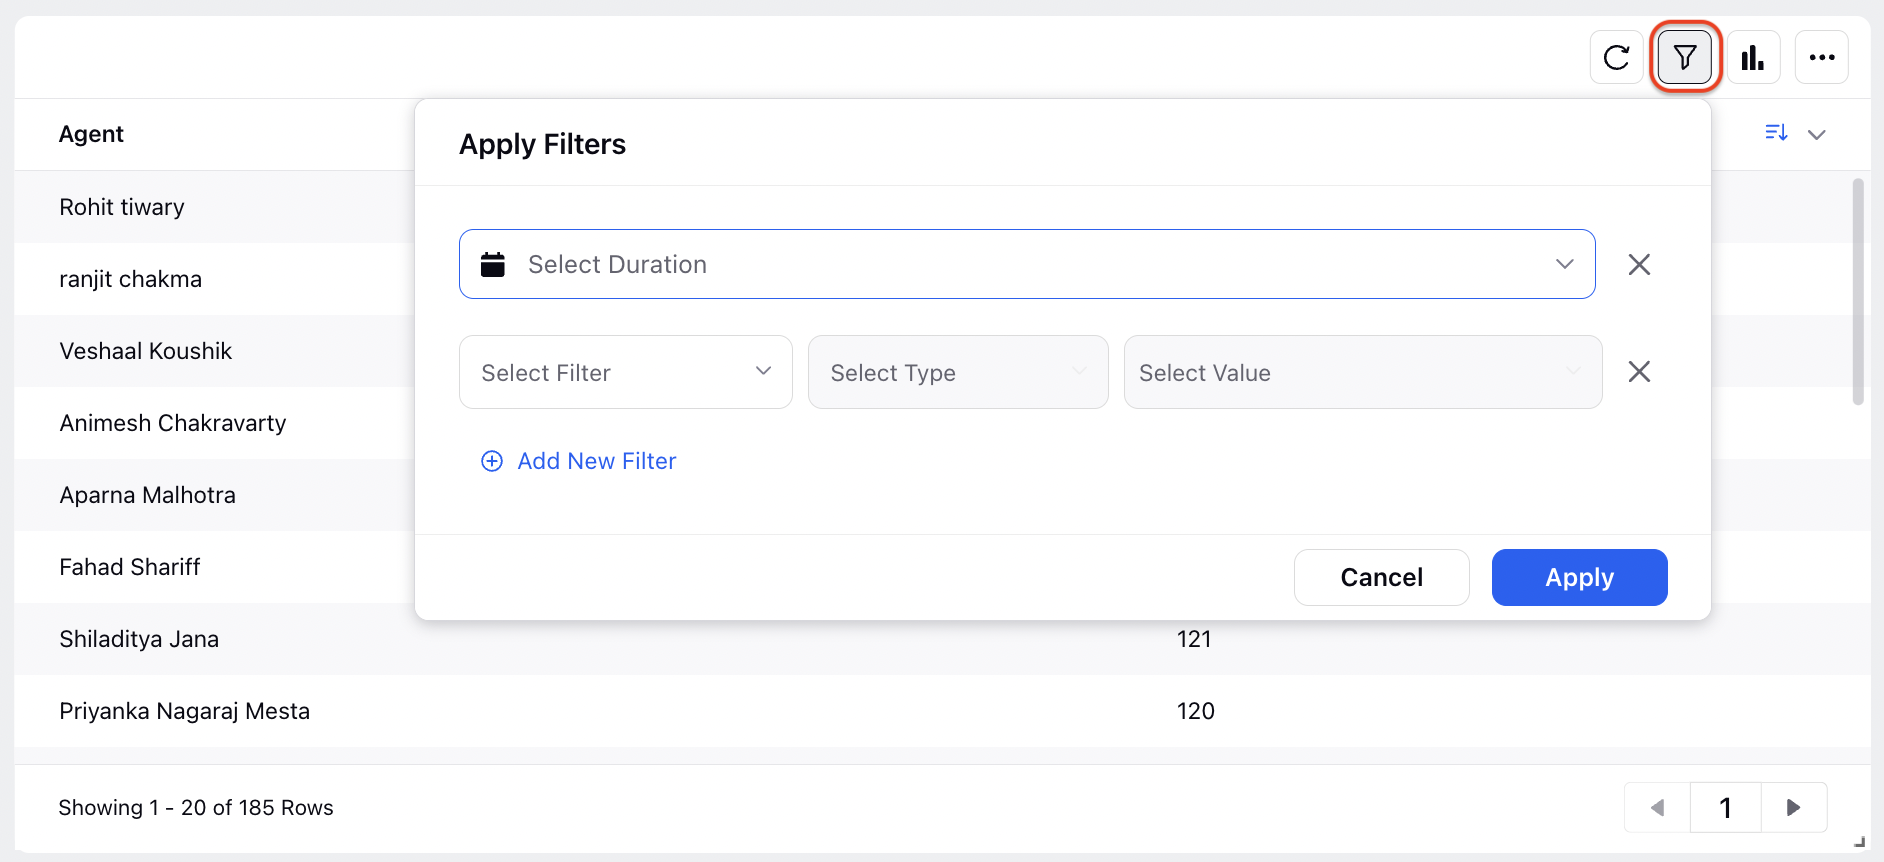
7.The same filter can be applied on clicking to 'Funnel' icon outside the widget.
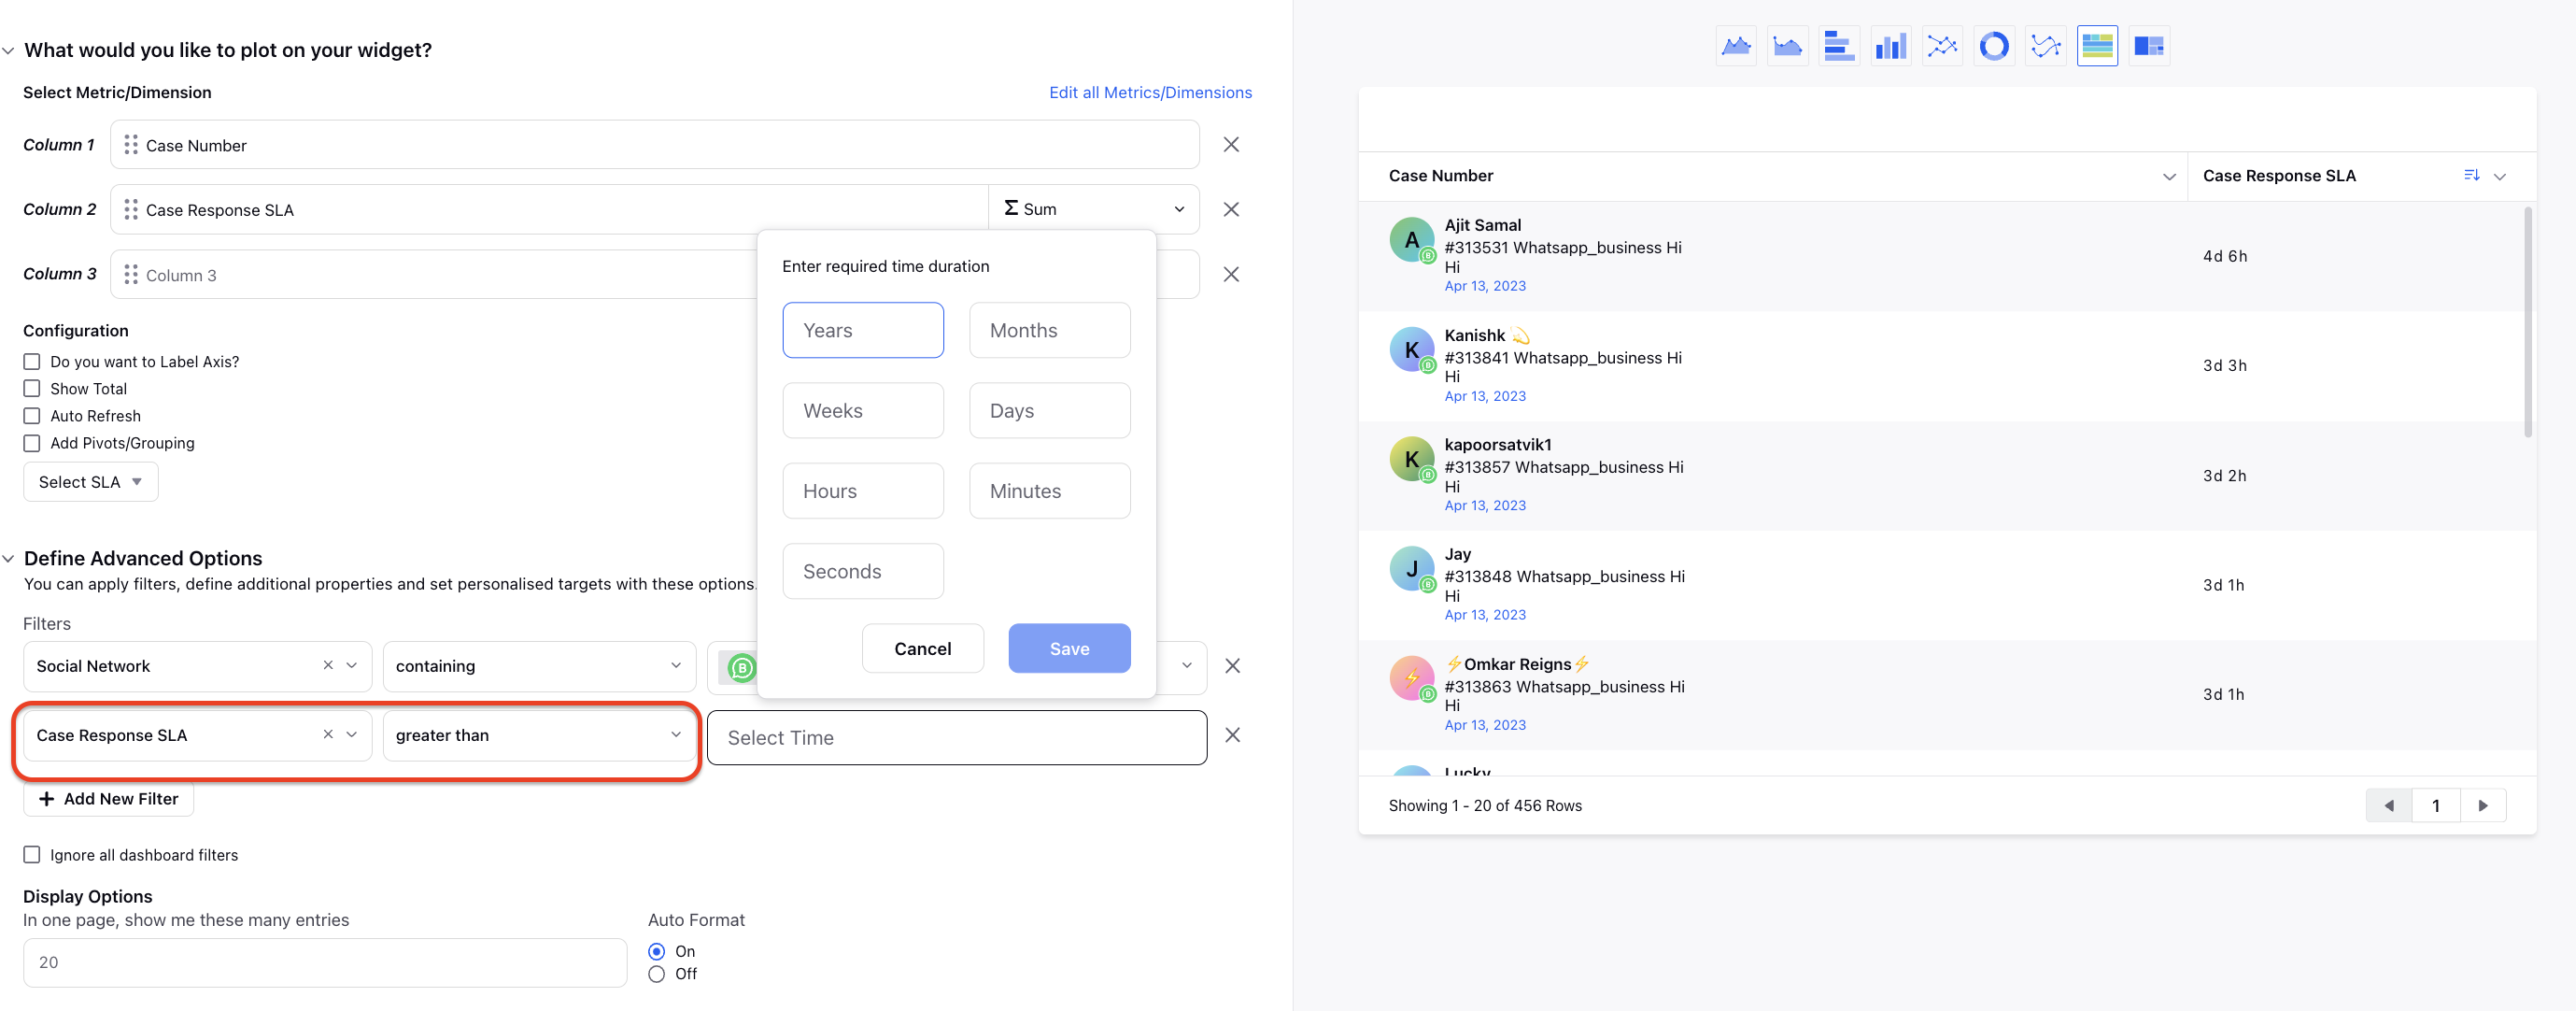
8. When you add a time-based metric or dimension filter in a reporting widget, it allows time-based values as filter options. This is also supported at the custom metric level.
Note:
While applying a metric filter to your widget, there must be metrics available within the widget or the filter won't work. However, this is not required for dimensions while applying a dimension filter to your widget.
While applying the second filter, you can show only those values which are applicable after applying the first filter. To get this capability enabled, please work with your Success Manager.
Internal note: REPORTING_FILTER_CUSTOM_PROPERTIES_VALUES_ENABLED_REPORTS("rpt.filter.custom.props.values.enabled.reports", SET, PARTNER)
String Values - Report Types. e.g. VOICE, VOICE_AGENT_PERFORMANCE, INBOUND_CASE
|
To Apply a Dashboard-Level Filter
1. Select the Filter icon in the top right corner to open up filter options for the dashboard.
2. Click Select Quick Filter in the top left corner to choose from existing Quick Filters. Alternatively, you can apply a new filter by clicking Add Filter to apply your desired parameters. You can also view the number of total values selected out of all filter values. 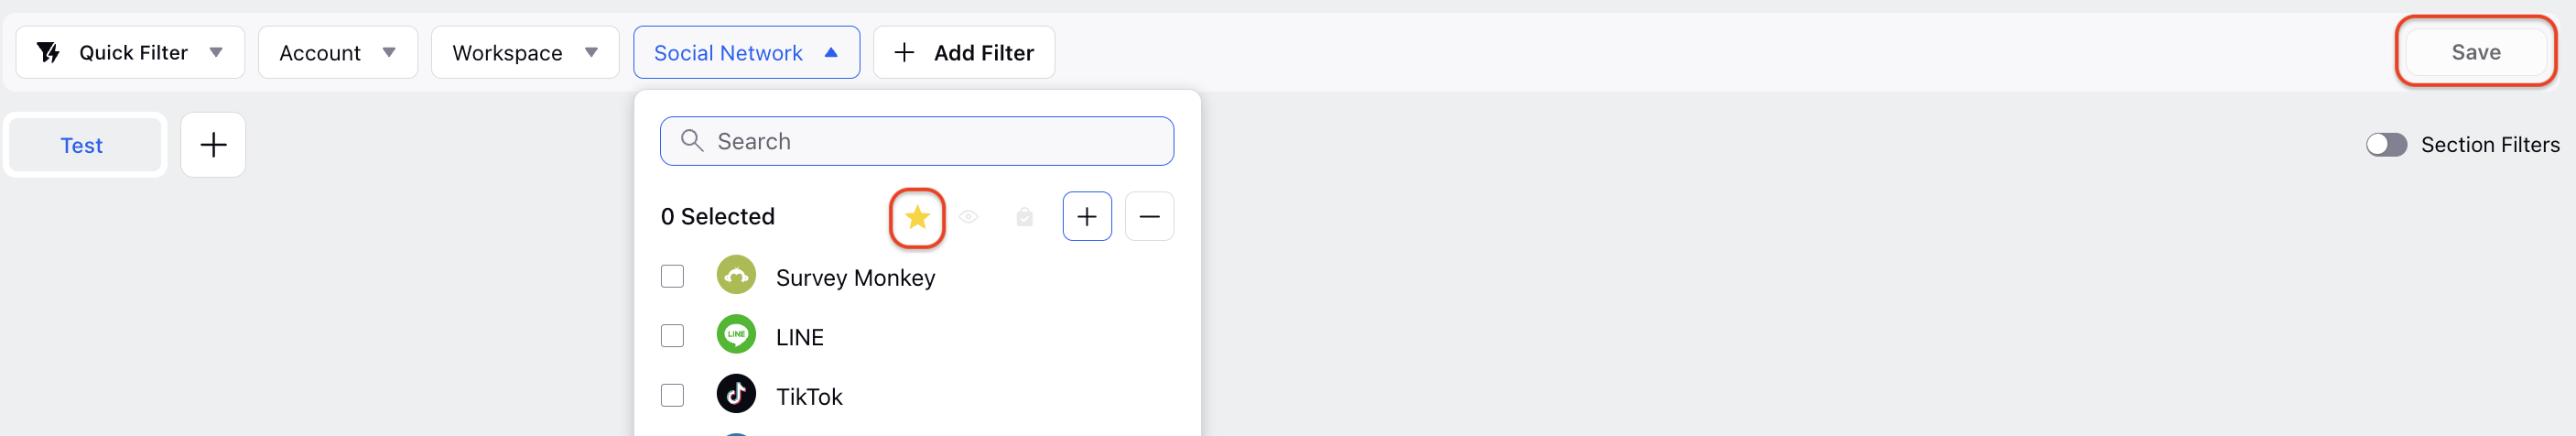
3. After selecting the parameters, click Apply Filter in the bottom right corner of the dropdown window.
4. Click the 'Save' option available at the Right Corner of the Filter Panel to save it as a Quick Filter.
Tip: If you wish to exclude a particular value of any parameter, select the value and click the minus icon on the top of the Add Filter list. The dashboard will be automatically filtered excluding the selected value. |
Date Range and Timezone Filters
In addition to the dimension filters available at the widget and dashboard-level, you can apply date range filters to focus on data from a specific date range. Date range filters can be applied to standard dashboards at the dashboard-level and can be applied to custom dashboards at the widget or dashboard-level. When a date range is selected, only data within that range will be shown. It is linked to the time zone, which by default is the time zone of your computer. This can be changed to fit a geographic time zone or the time zone of an account.
When teams work together across time zones, establishing standardized reporting over time can be difficult. A standard time zone used across all teams can ensure that reports and time filters in the Ads Manager and in Ads Reporting returns the same information for all and can help improve collaboration and ensure accurate and consistent information is delivered.
To apply Dashboard Level Date Range Filter and Timezone Filters
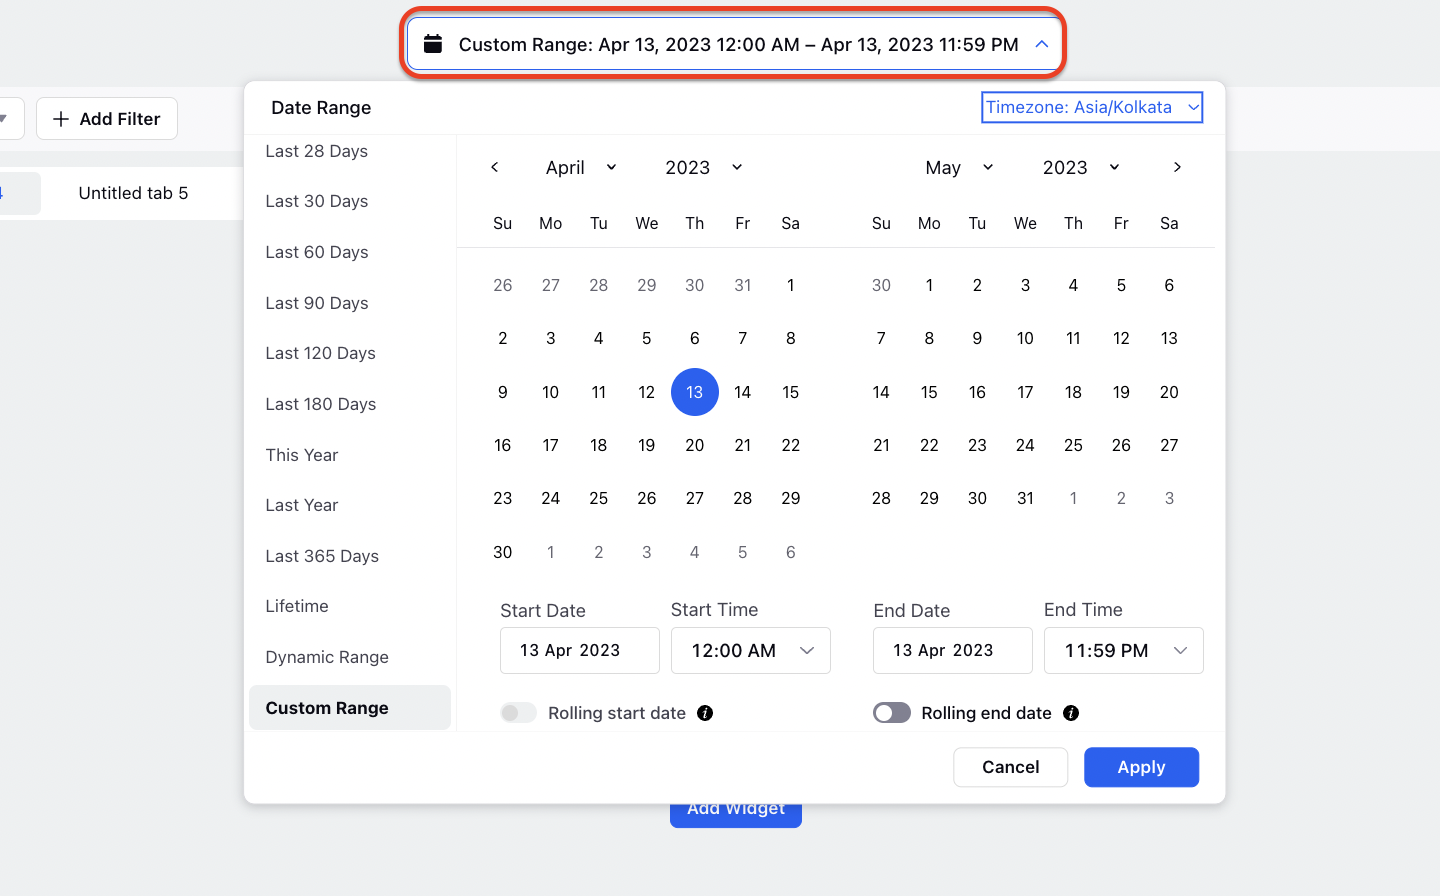
Set a predefined or custom range by clicking Duration Picker from the top of the dashboard and selecting the desired range to see reporting data for that range.
You will see a Range Menu on the left of the pop-up window to either select a predefined range or custom range. For any predefined range, you’ll be able to view the exact dates. Also, if you try to make any changes in the predefined range, you’ll be automatically navigated to the custom range.
Note:
|
For custom range, easily select the start and end dates in the same view. You can Cancel or Clear the selection. Click Save in the bottom right corner of the pop-up window to update the view based on the selected duration.
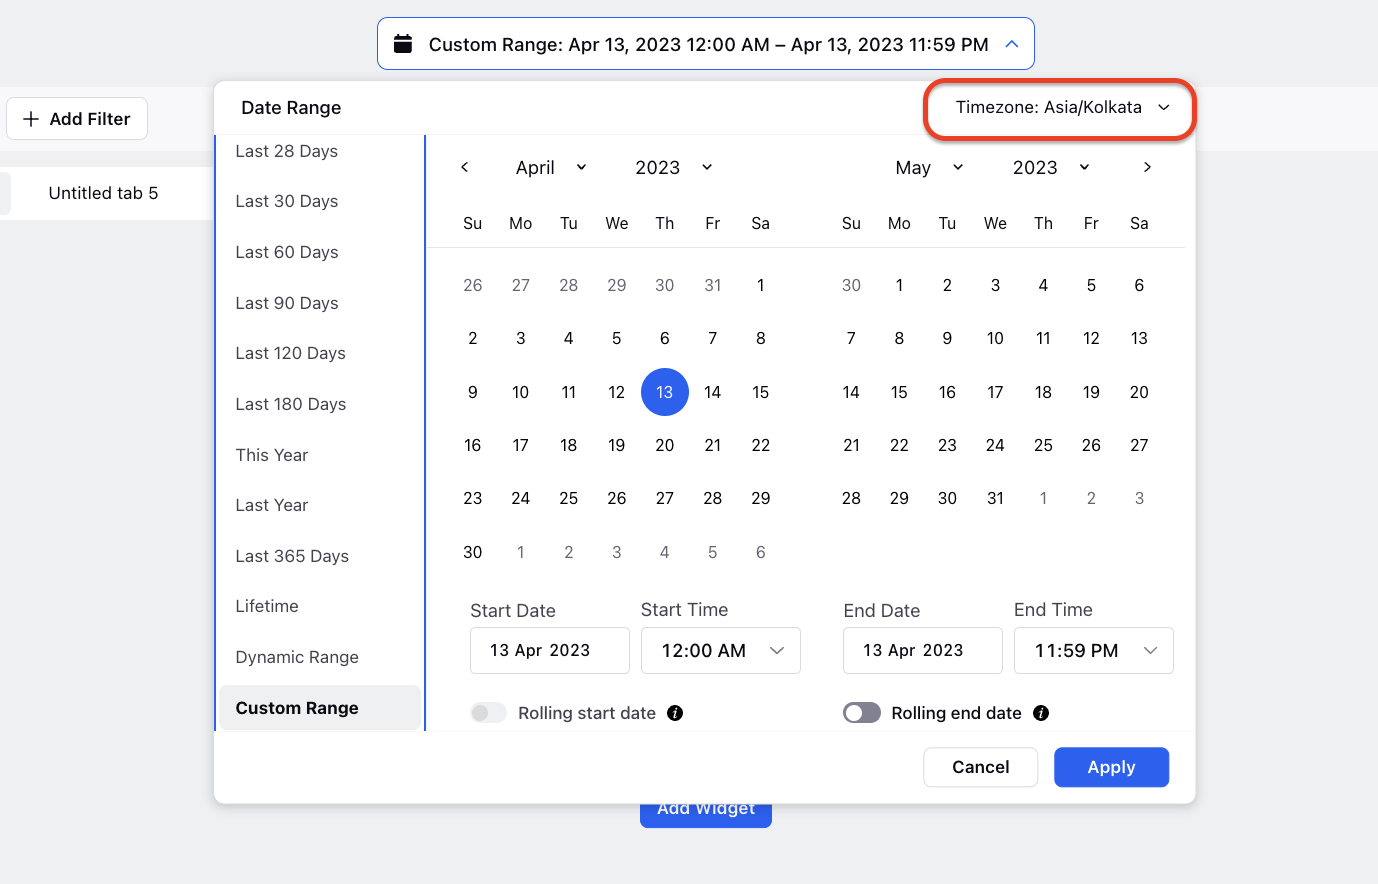
To Apply Dashboard Level Timezone Filter
On the Duration Picker pop-up window, click the Timezone in the top right corner. Select the desired timezone from the drop-down to set a standardized time zone for the desired Reporting Dashboard.
You can select a timezone for your dashboard from the following:
Sprinklr Timezone - This will depict the reporting data in the corresponding account timezone for accounts in different timezones.
Account Timezone - This will depict the reporting data in the selected account timezone.
Geographic Timezone - This will depict the reporting data based on the timezone of a particular geographic region.
To Apply Multiple Keyword Filtering
Dashboards can be filtered by users through the input of multiple keywords, with the system processing these inputs to display relevant data.
Boolean Operator Implementation:
Boolean operators (AND, OR, NOT) are supported and can be utilized by users to construct complex queries, with the system interpreting these operators to refine search results.
Custom Aggregation data:
You can manually define aggregations based on metrics and use them while plotting widgets. These aggregations will be saved in a separate window like we currently have with Time-based cohorts. You will be able to Edit, Create, or Delete aggregations as per your use case.
Comma separated on multi-select pick list:
Comma separated values on list of items with similar items with one different attribute can be sorted in a same list and be separated using commas.
Multi Level Widget sorting in Reporting:
Widget data can now be sorted on multiple parameters in reporting. People can sort the widget data on multiple parameters like ascending order on date, then on impressions.