Create a Custom Metric in reporting
Updated
Custom Metrics allows you to create your own derived metrics using standard reporting metrics. These custom metrics can be used to collect and analyze data that reporting does not track automatically. Custom Metrics offer the capability to build dynamic metrics based on industry-standard norms and various business use cases.
Steps
Under a Reporting Dashboard, you can select the More options at the top right corner
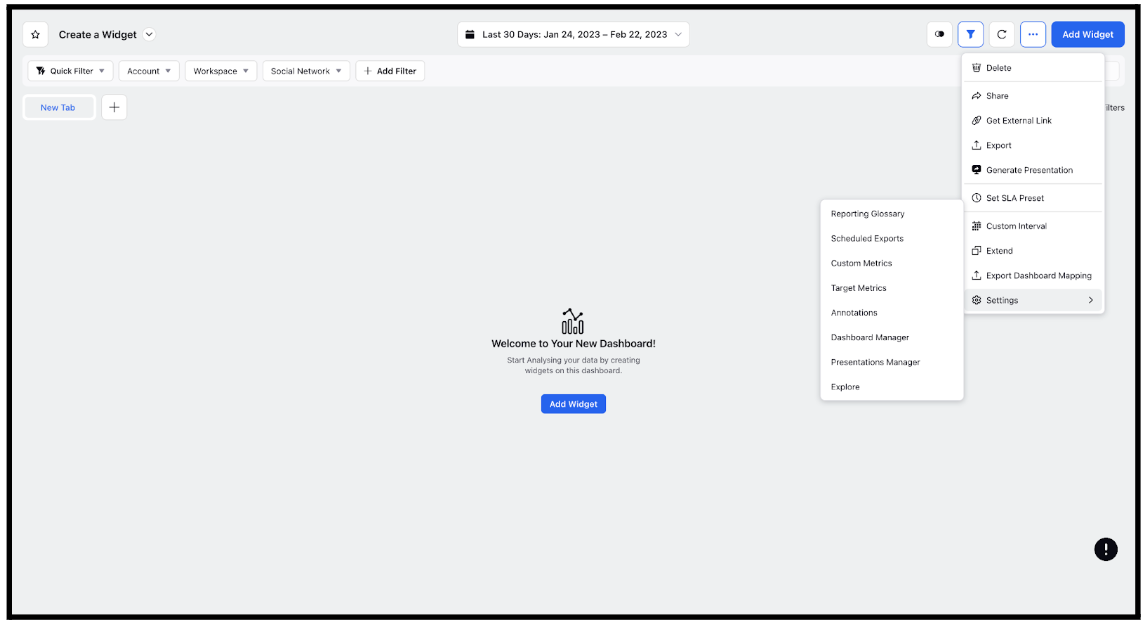
On the Settings section, click Custom Metrics.
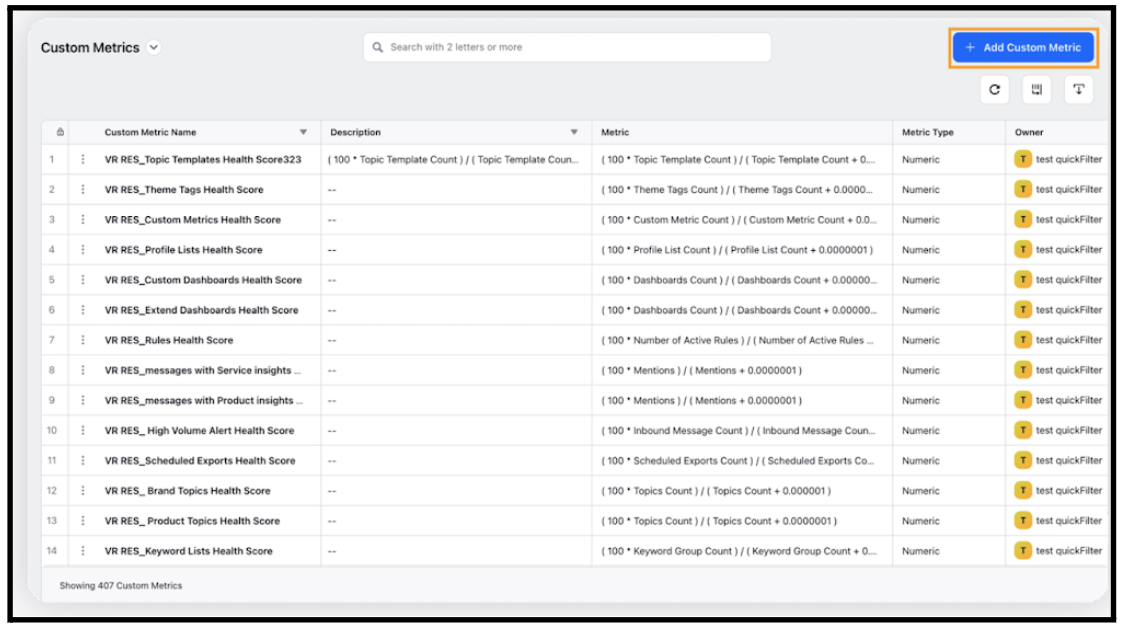
On the Custom Metrics window, click Add Custom Metric in the top right corner.
On the Create Custom Metric form, enter the Custom Metric details and click Create. For more information, see Custom Metrics Field Descriptions in the next section of this article.
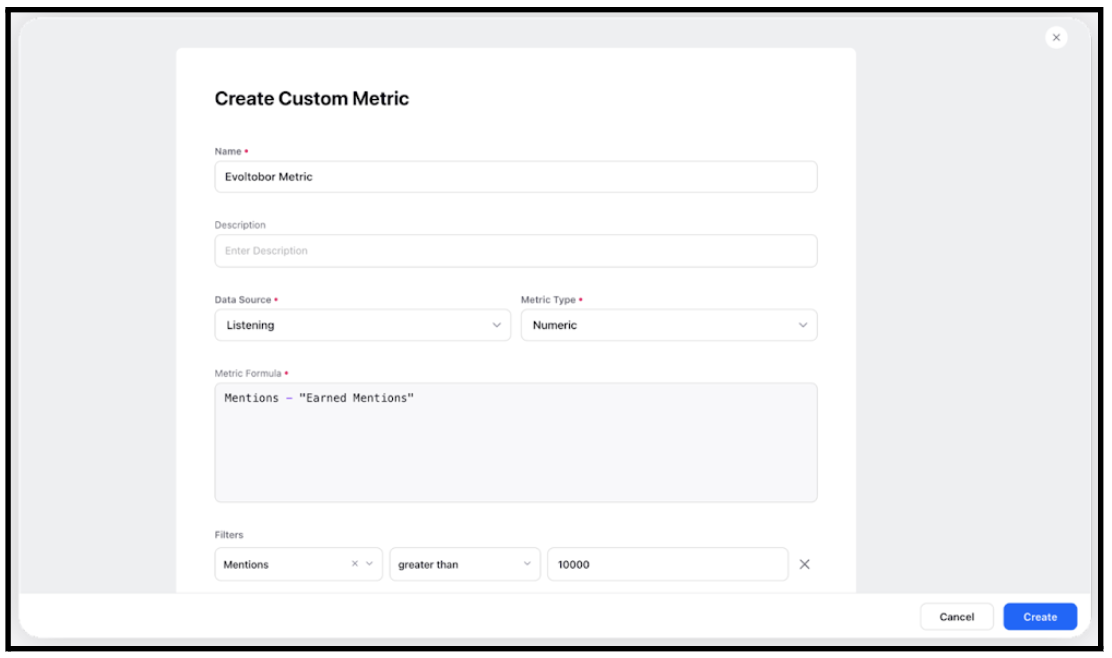
Note: Once the custom metric is created, you will have to refresh any reporting pages you have open for the metric to become available for use in reports or other custom metrics.
Field Descriptions
Field | Description |
Name | Enter a name for the metric. |
Description | Enter a description of the metric that you want to create (optional). Note: A description will be automatically filled based on the formula used in the custom metric, if the description field is empty. |
Data Source | Select the desired data source – Social Analytics Inbound Analytics Consumption Analytics |
Metric Type | Select the desired metric type. The metric type is the unit in which the data count gets reflected. You may select from the following metric types: Numeric: Data is returned in numeric form Percentage: Data is returned in percentage (%) Currency: Data is returned in currency Date Time: Data is reflected in the format of date and time Time Difference: Data is reflected in the format of time difference |
Metric Formula | Select the metric(s) from the list. You can select a numeric operator from the list and add another metric. You can create a custom metric from an existing custom metric. For example, if you have created a metric named Average reach per post, where the metric is Post Reach/Volume of Published Messages, you can create another custom metric with Average reach per post as one of the metrics in the metric field. |
Filters | Select dimensions, filter type, and select values. |
Color Coding | Define the desired value ranges and associated colors. These will be reflected in Table widgets where the metric is used. |
Note:
Standard Dashboard: The metrics that are fetched to the dashboard correspond to their published date and provide the total number of the metrics received from the date published to the present date.
Custom Dashboard: You can view the trend in certain metrics from the custom dashboard and group the metrics according to specific dates to understand the trend.
Examples
Custom Metric | Description | Metric |
Average Number of Clicks per Post | Total clicks divided by the volume of published messages. | Total Clicks (Bot + Non-Bot) / Volume of Published Messages |
Average Engagement per Post | Total engagement divided by the volume of published messages. | Total Engagements / Volume of Published Messages |
Average Reach per Post | Post reach divided by the volume of published messages. | Post Reach / Volume of Published Messages |
Click through Rate | Total clicks divided by post reach times 100. | Total Click (Bot + Non Bot) / Post Reach * 100 |
Kochava CPA | Total spent divided by the number of Kochava events. | Spent / Kochava Events |
Net Promoter Score | Calculated using the responses received to a single survey question, using a 0-10 scale. | (Number of Promoters / Total Survey Results) - (Number of Detractors / Total Survey Results) Where, Number of Promoters = 9-10 Number of Detractors = 0-6 |
Smart Response Predicted % | Total smart responses predicted divided by the volume of outbound messages. | Smart Response Predicted / Volume of Messages |