Create a Widget
Updated
Widget is an element in Sprinklr Reporting that enables users to customize their own visualizations and add metrics that users wish to dive deeper into and derive actionable insights. A widget offers multiple customization options such as custom visualizations, various metric compatibility, different data sources to choose from, filters, sorting, and formatting. While adding a widget to your Social Reporting dashboard, you can use the Widget Library to easily customize and add pre-existing templates to your dashboard. You can also use the widget editor, where you create a widget from scratch.
Note: While creating a widget, you can view details related to the metrics/dimensions in the platform itself. These details include not only the description, but also which metric to compare with in native analytics, and if it's paid/organic/total. This will serve as a floating reporting glossary for you. Currently, this is only supported for the Social Analytics data source, and the top used 300 metrics/dimensions in this source. Support for all other metrics will be rolled out soon. For details, see Tooltips & Floating Reporting Glossary.
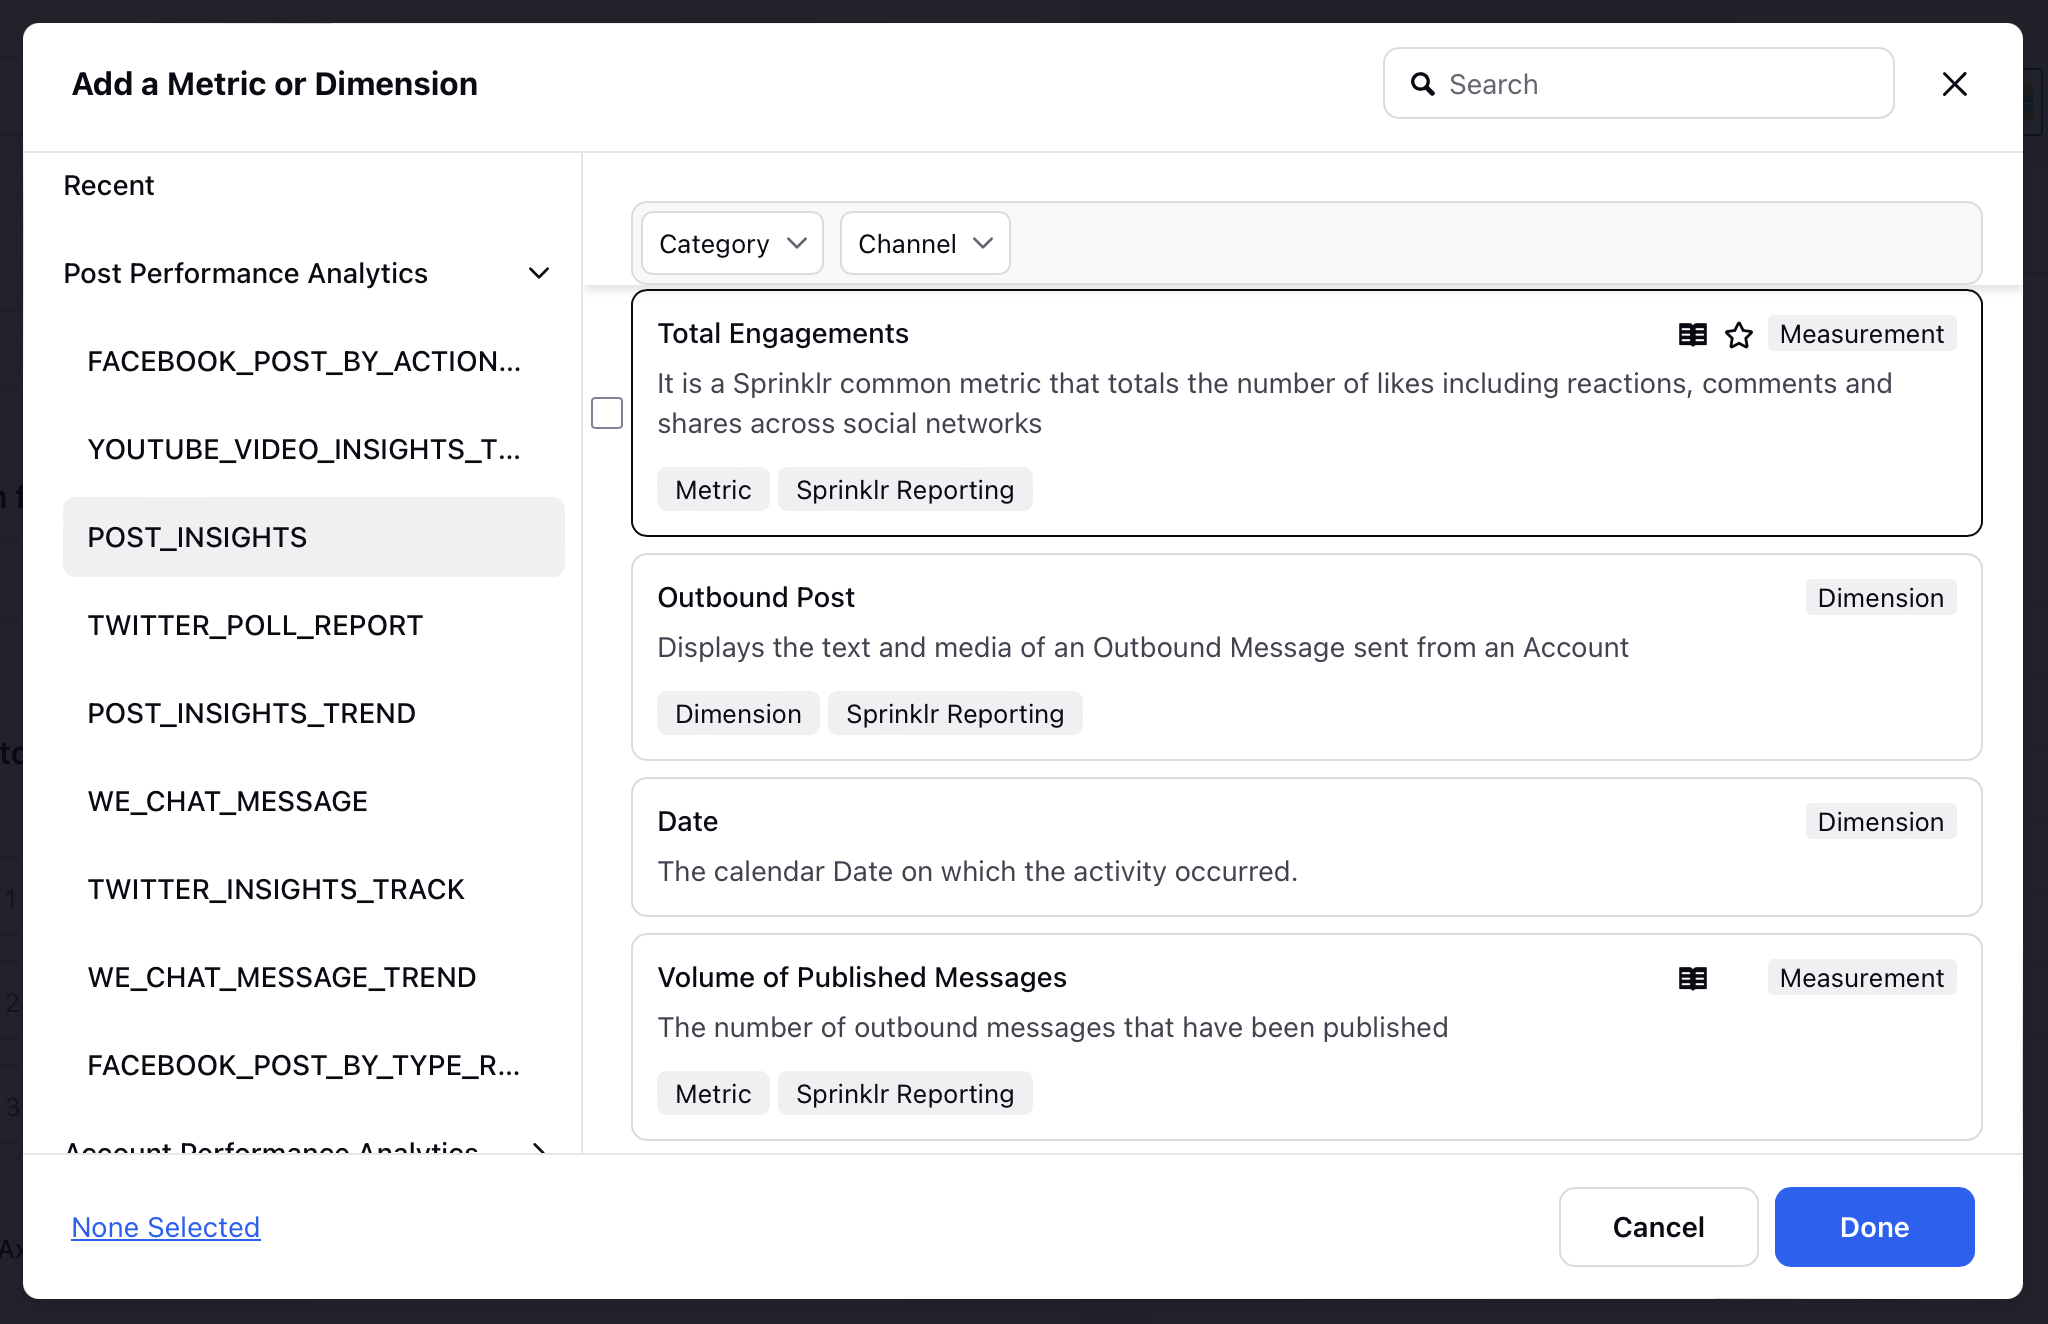
Note: Access to this feature is governed by a dynamic property and is currently available with limited accessibility. To enable it in your environment or for further details, please reach out to your Success Manager. Alternatively, you can submit a request at tickets@sprinklr.com.
To Create a Custom Widget
Click the New Tab icon. Under the Sprinklr Social tab, click Reporting within Analyze.
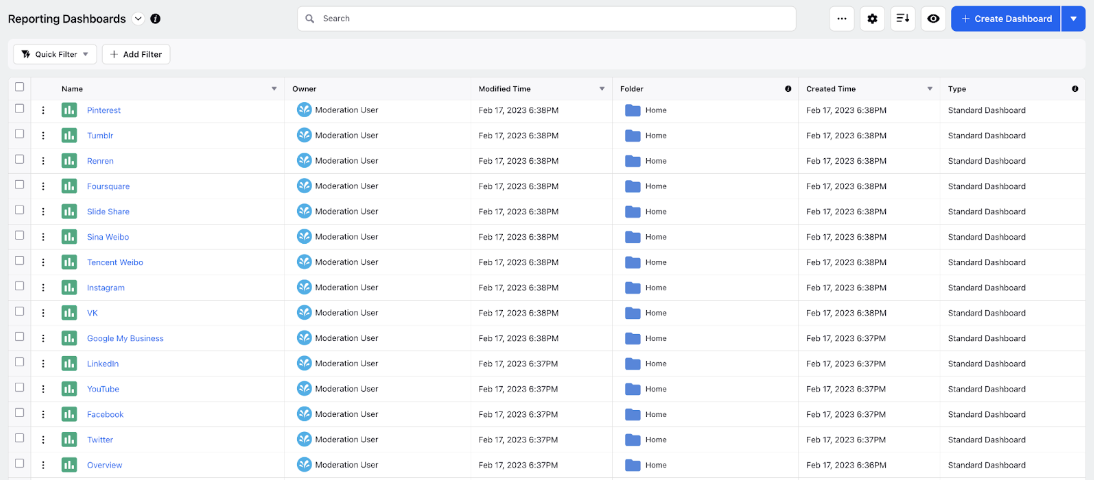
Select the desired reporting dashboard from the Reporting Dashboards home page.
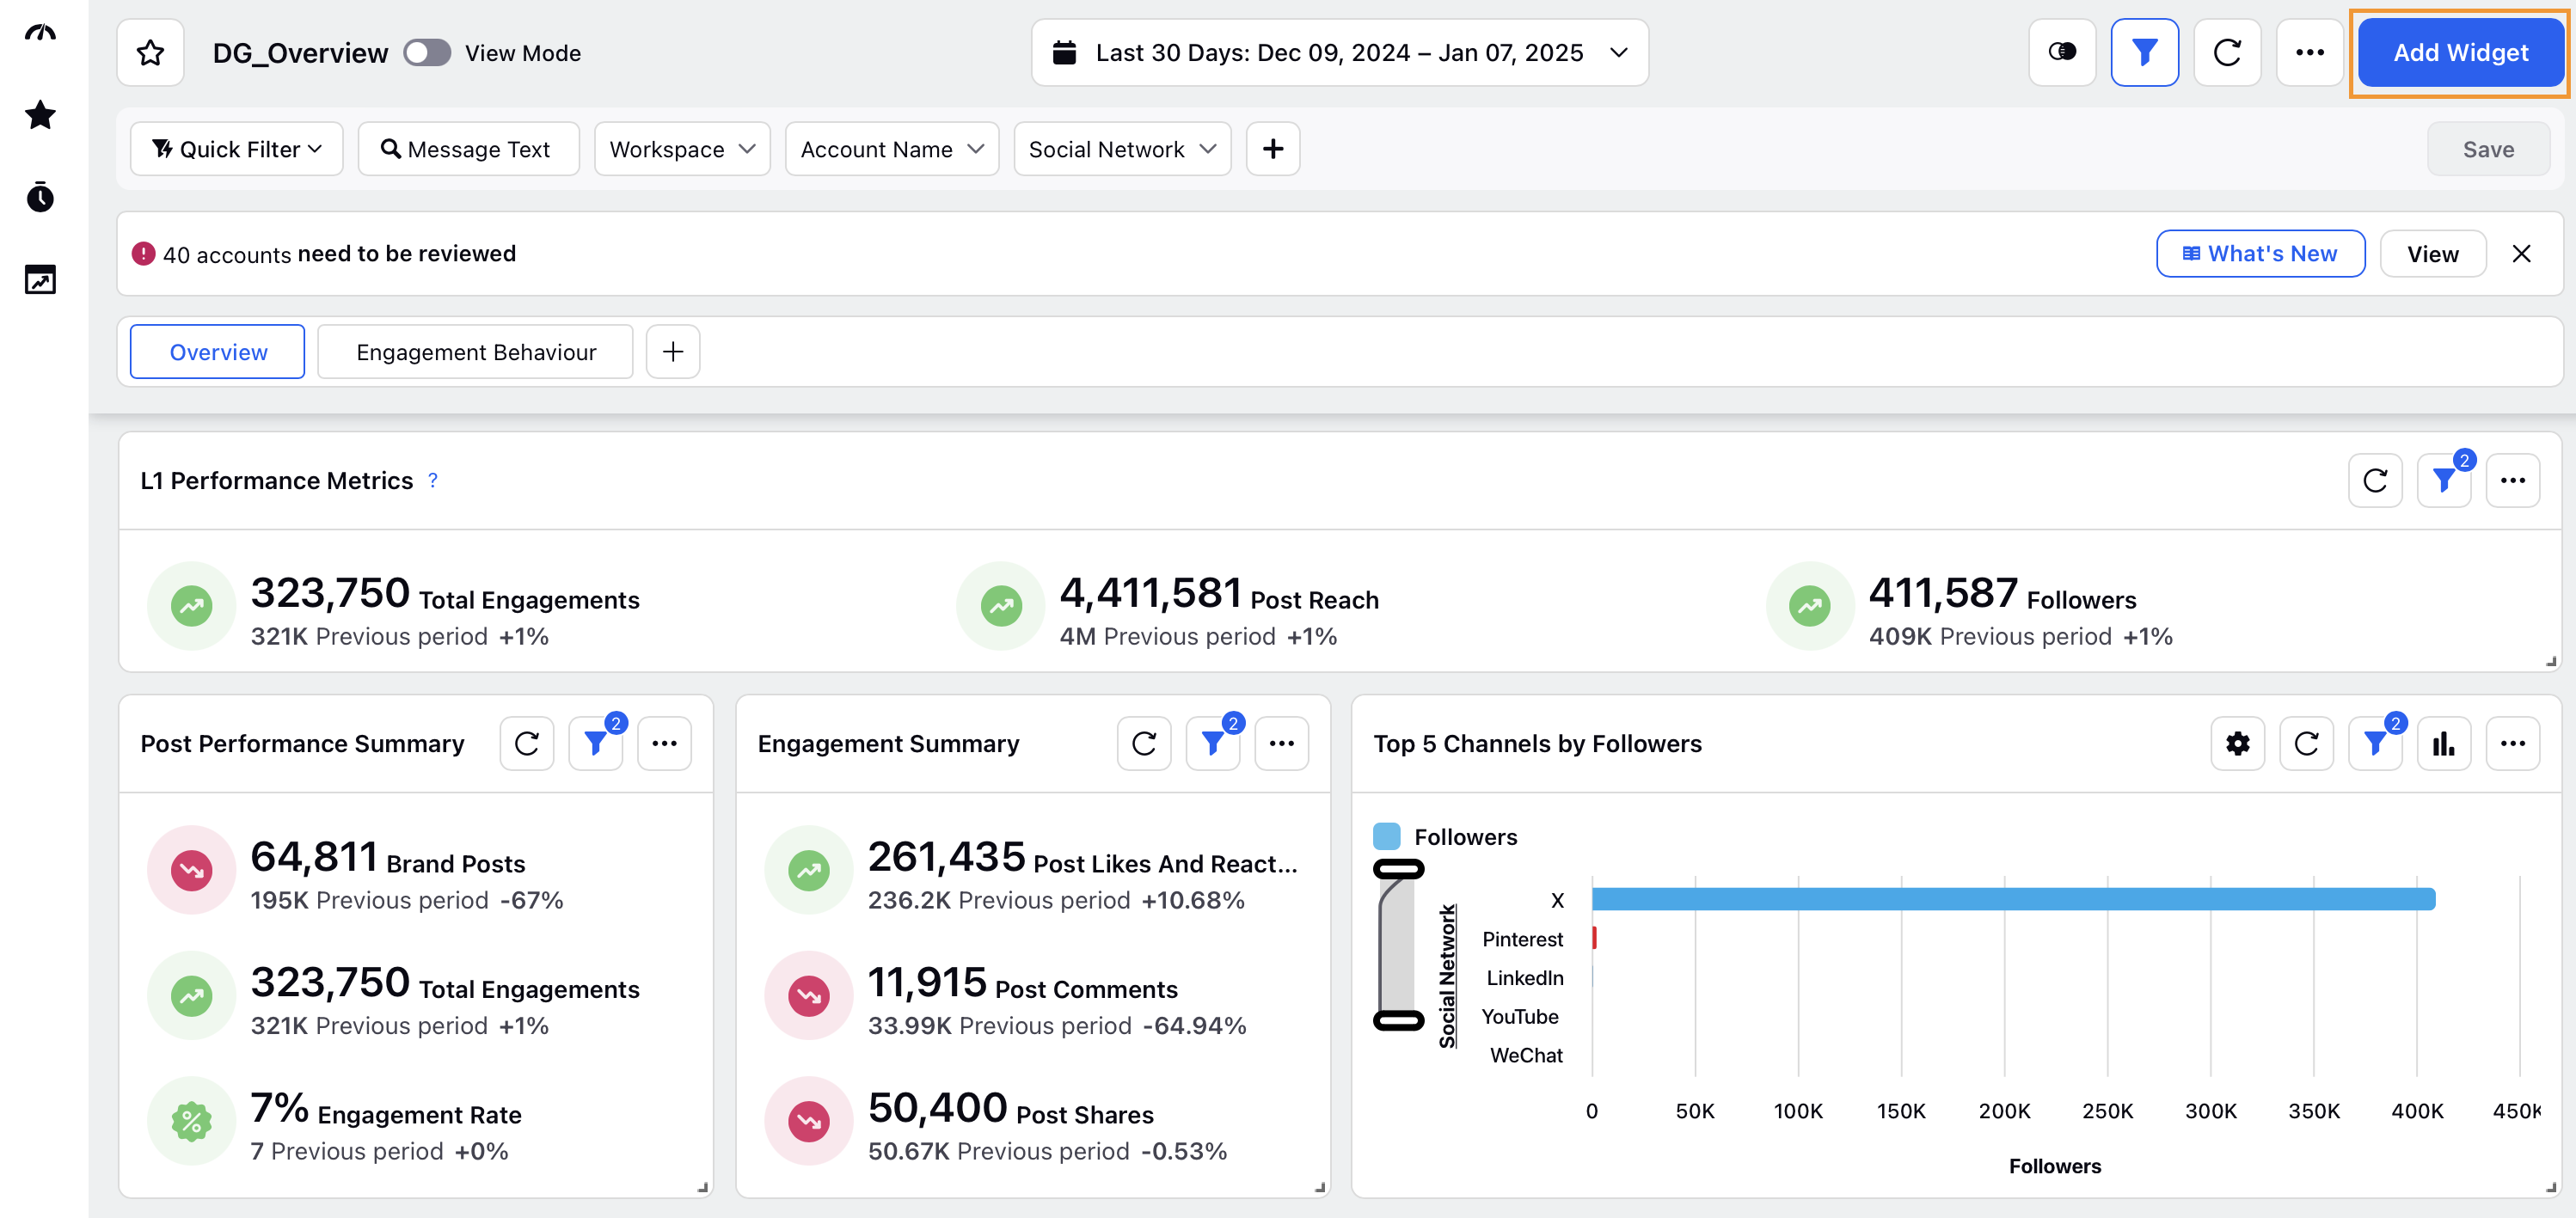
Click Add Widget in the top right corner of the desired reporting dashboard.
Fill in the following fields as required on the Create Custom Widget window.
Field
Description
Widget Name
Enter a name for the widget.
+ Add Description
Click to enter the description of your widget.
Data Source
Select Social Analytics as the data source for your widget. This will be pre-selected by default if you create the widget in Social Reporting dashboards. For more details on different data sources, refer to Widget Data Sources.
Select a visualization for your widget
Select a chart type for your widget.
What would you like to plot on your widget?
Add metrics/dimensions to your widget that are organized into different categories. Refer to Simplified Widget Builder for further details.
Click Bulk add Metrics/Dimensions to select both metrics and dimensions.
To find the required metric or dimension, simply use the search bar. The search functionality is optimized to enhance your search experience, including but not limited to the following features:
You can search for metrics or dimensions using common keywords. For example, searching for "Meta" will display metrics related to both Facebook and Instagram.
You can also search using secondary or tertiary terms in the metric name, and the relevant metrics will appear in the search results.
The search is case-insensitive, so it handles different letter cases automatically.
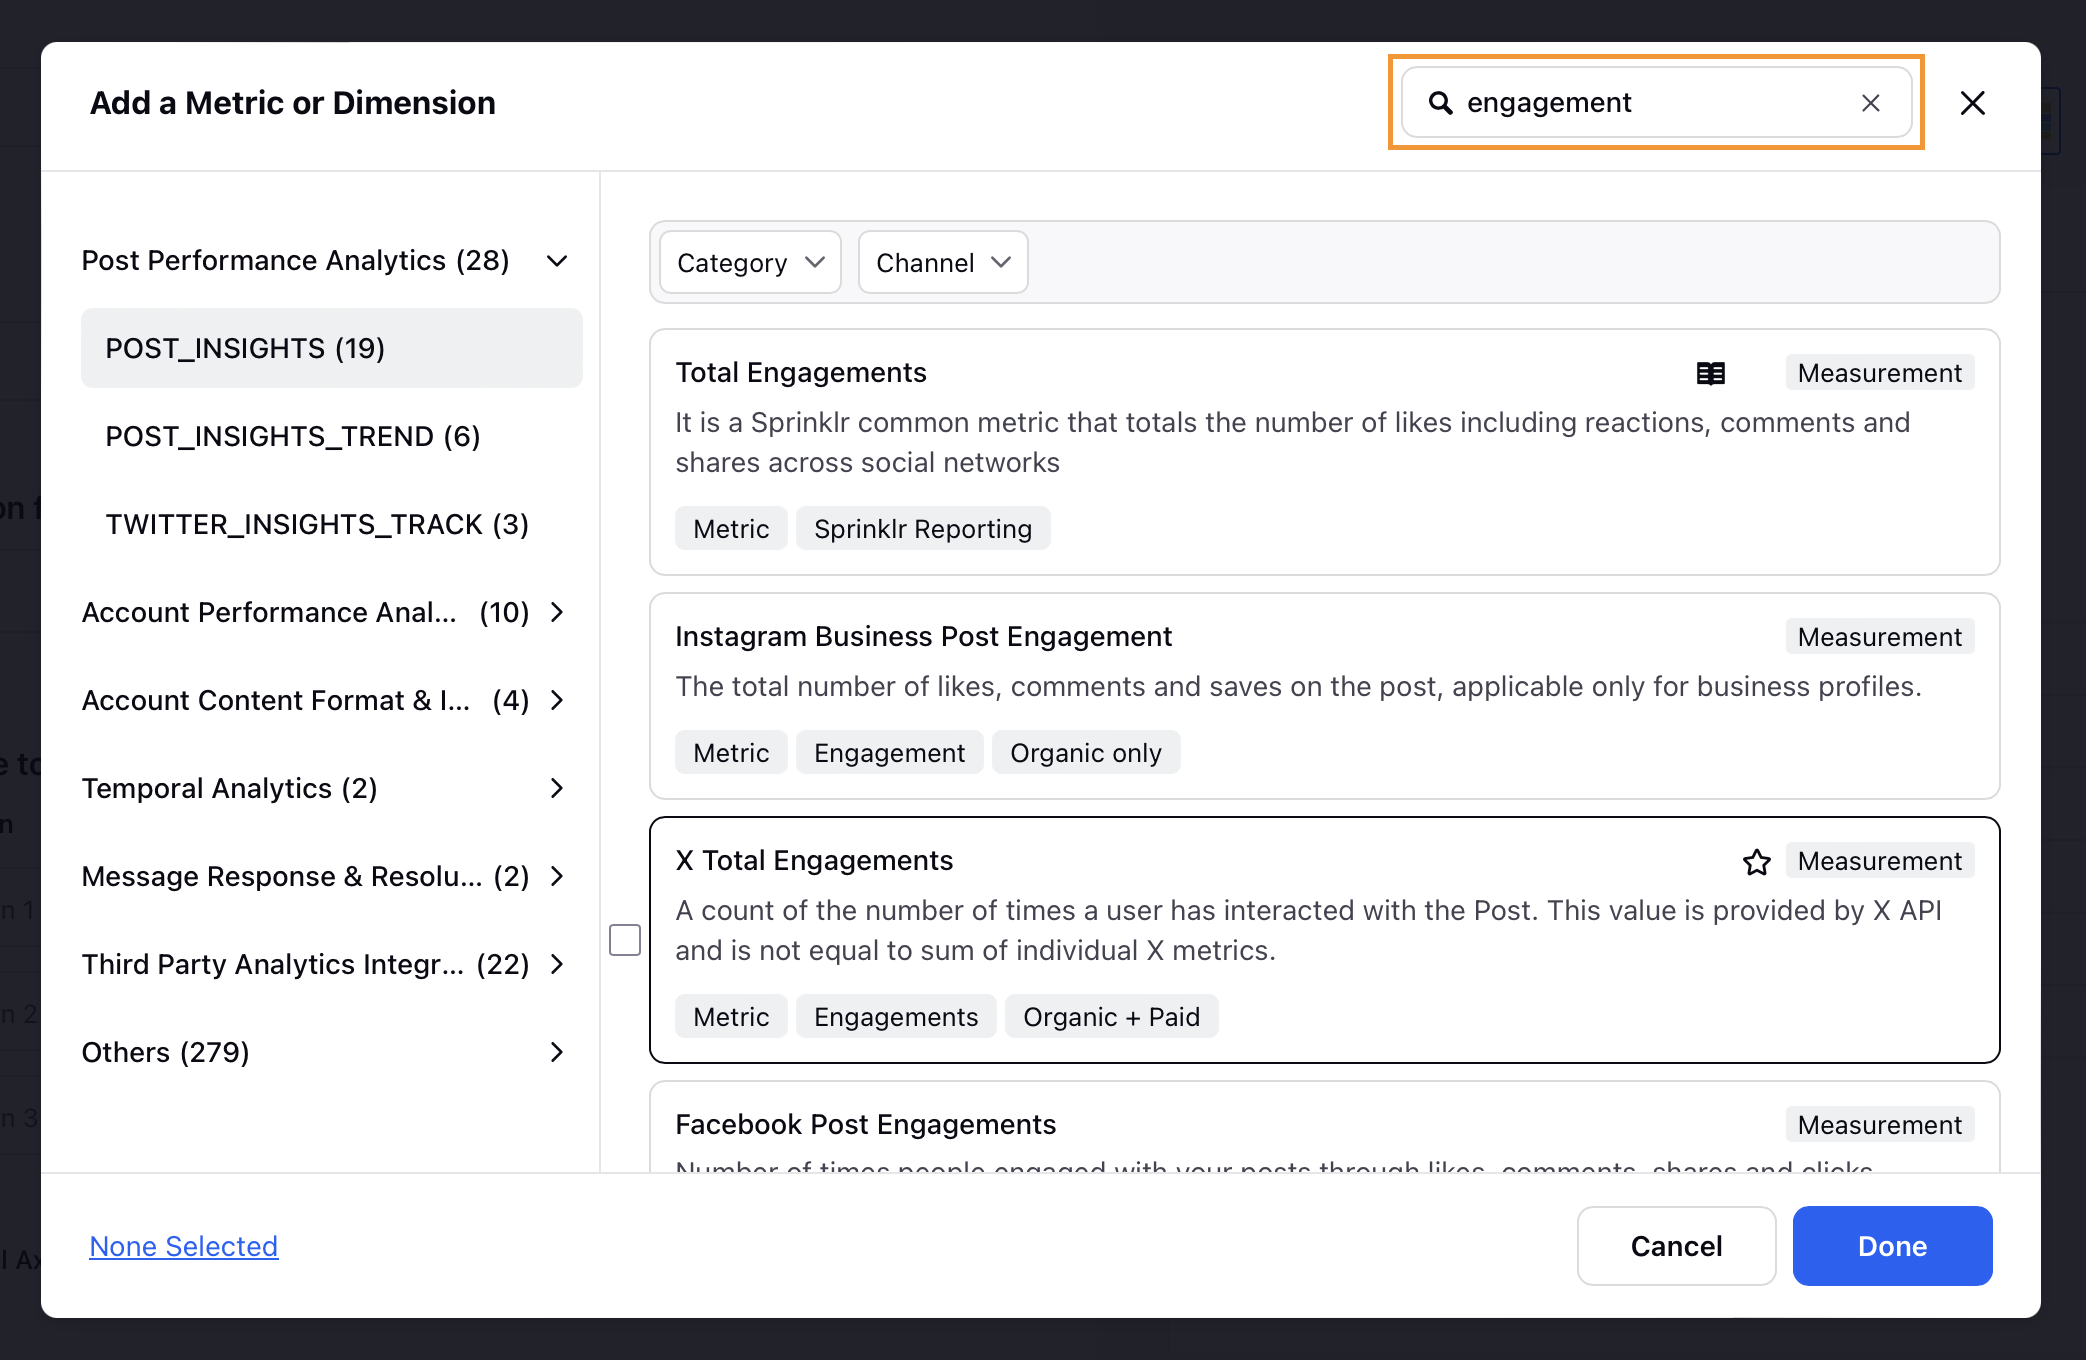
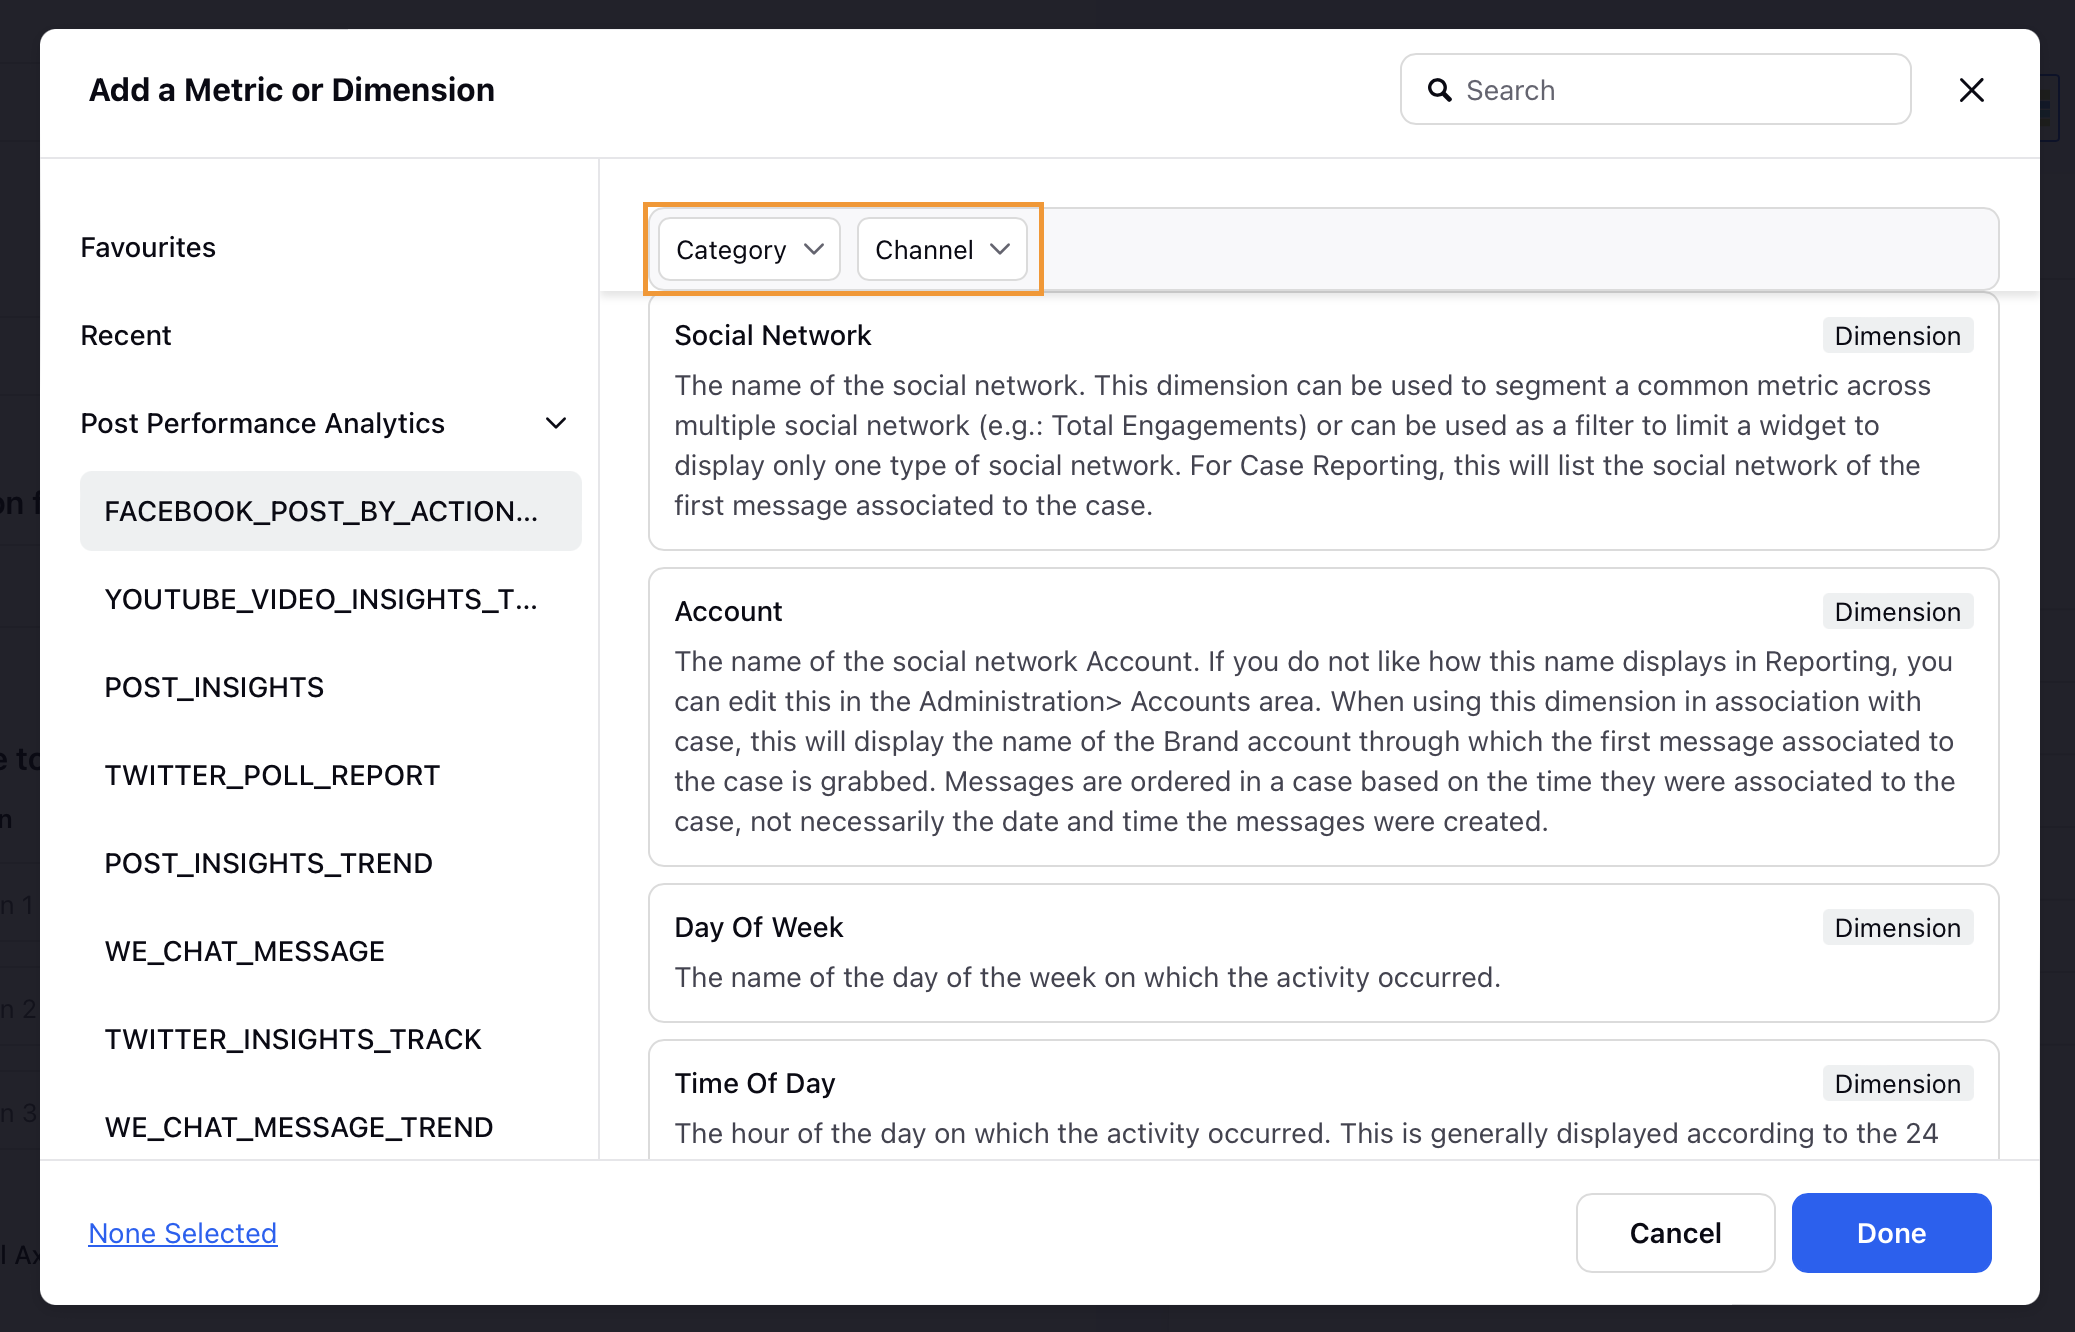
Use the Category and Channel filters to narrow down your search further.
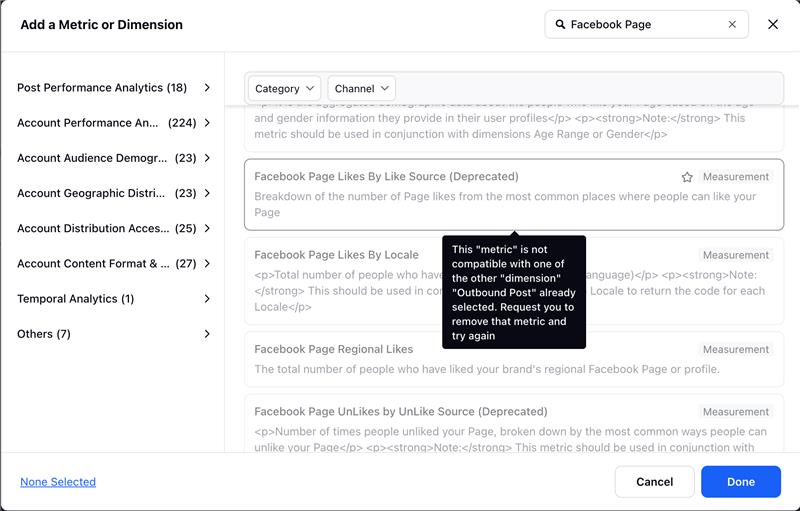
While choosing any metrics and dimensions in the widget builder screen, any incompatible metrics or dimensions will be disabled and a message will be displayed to provide more details on their compatibility depending on your current selection.
Configuration (The configuration may differ based on the selected visualization type)
Select the configuration for your custom widget as needed. You can select from the following options -
Do you want to Label Axis? - Provide a custom name to your reporting widget axes.
Show Total - This shows the sum total of the data at the top of the selected metrics' column.
Auto Refresh - Specify a time frame to automatically refresh your widget data.
Add Pivots/Grouping - Select a dimension to group your reporting data.
Include Data Labels - Labels the applicable chart with individual reporting data.
Define Y/X-Axis Scale - Set the chart scale in terms of Minimum and Maximum Y/X-Axis bounds, and Step Size (Interval) on Y-Axis between minimum and maximum values. The maximum and minimum values will be adjusted based on the number of divisions.
Filters
Apply custom filters, define additional properties, and set personalized targets.
Ignore all dashboard/section filters
Check the box to ignore all filters at dashboard level and only consider your widget level filters.
Display Options
Customize your widget display options as needed. You can configure the following -
In one page, show me these many entries - The number of entries you want within your widget.
Auto Format (enabled by default)- This will automatically format the number of decimal places in your reporting data. Select Off to specify the number of decimal places in your reporting data.
Define Sorting - Select the metric/dimension based on which your widget data will be sorted.
Click Add to Dashboard in the bottom right corner to add the widget to the dashboard.