When to use Home Page?
Updated
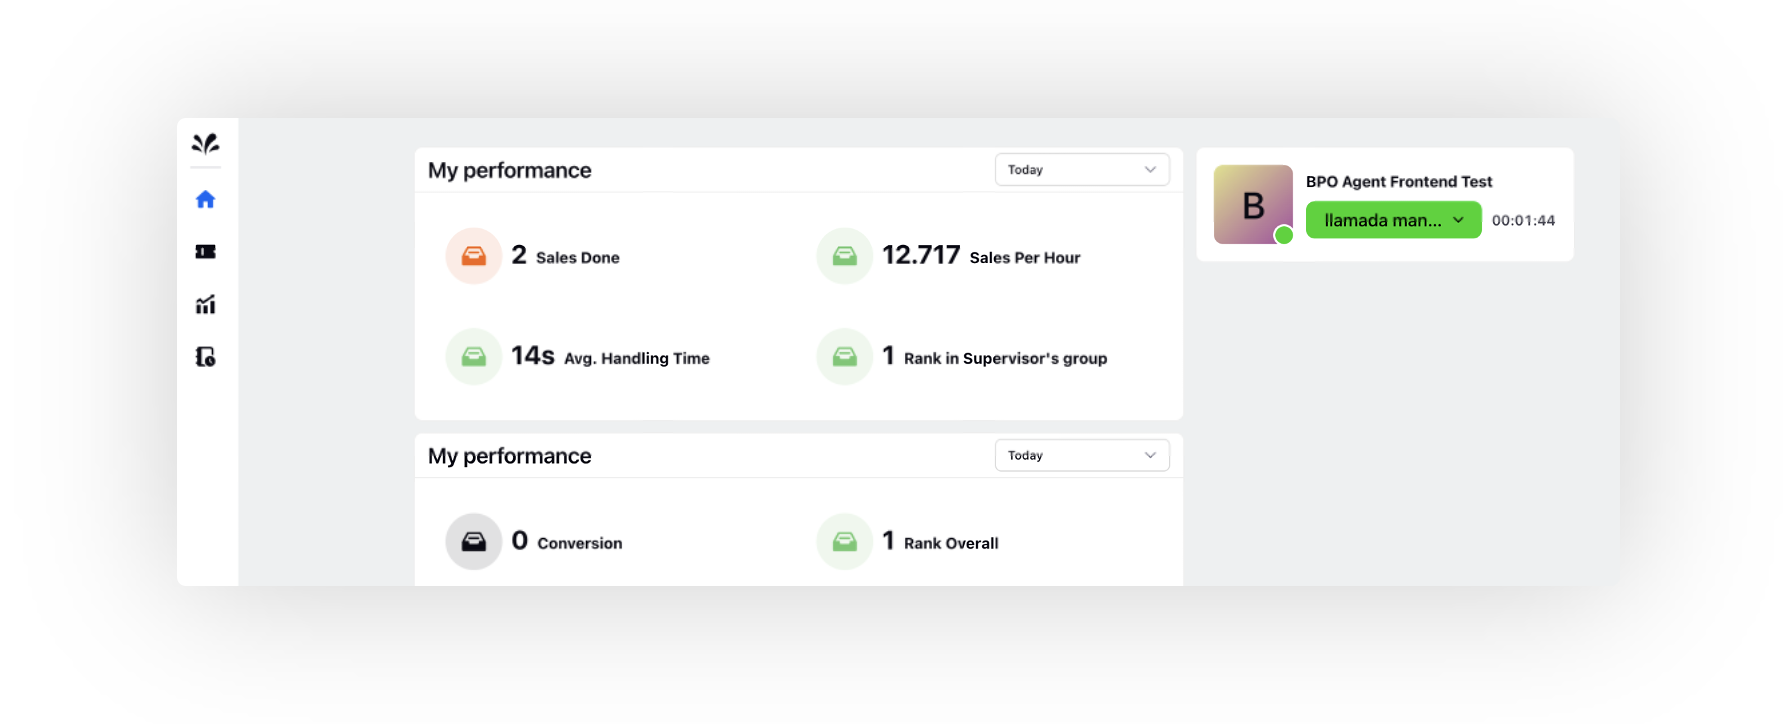
Quickly glance through the team performance over the last 24 hours
The performance of the agents is shown on the home page for last 24 hours, including case volume, response times, customer satisfaction scores, and other information. Supervisors can use this data to better understand how their agents are doing and spot any areas where they might need more assistance.

View escalated tickets
Supervisors can quickly address urgent client issues thanks to a widget on the home page that displays the status of all escalated tickets.

For viewing aggregate team status
Supervisors can monitor team status on the home page in real-time. Supervisors can use this data to assess the team's availability and take proactive action to manage case volumes.

For managing your To-Do list
The home page also features a To Do list that users can use to keep track of their own tasks.

Color Coding Custom Metric Values
You can create custom metrics of numeric and percentage types with distinct color codes designated for various ranges.
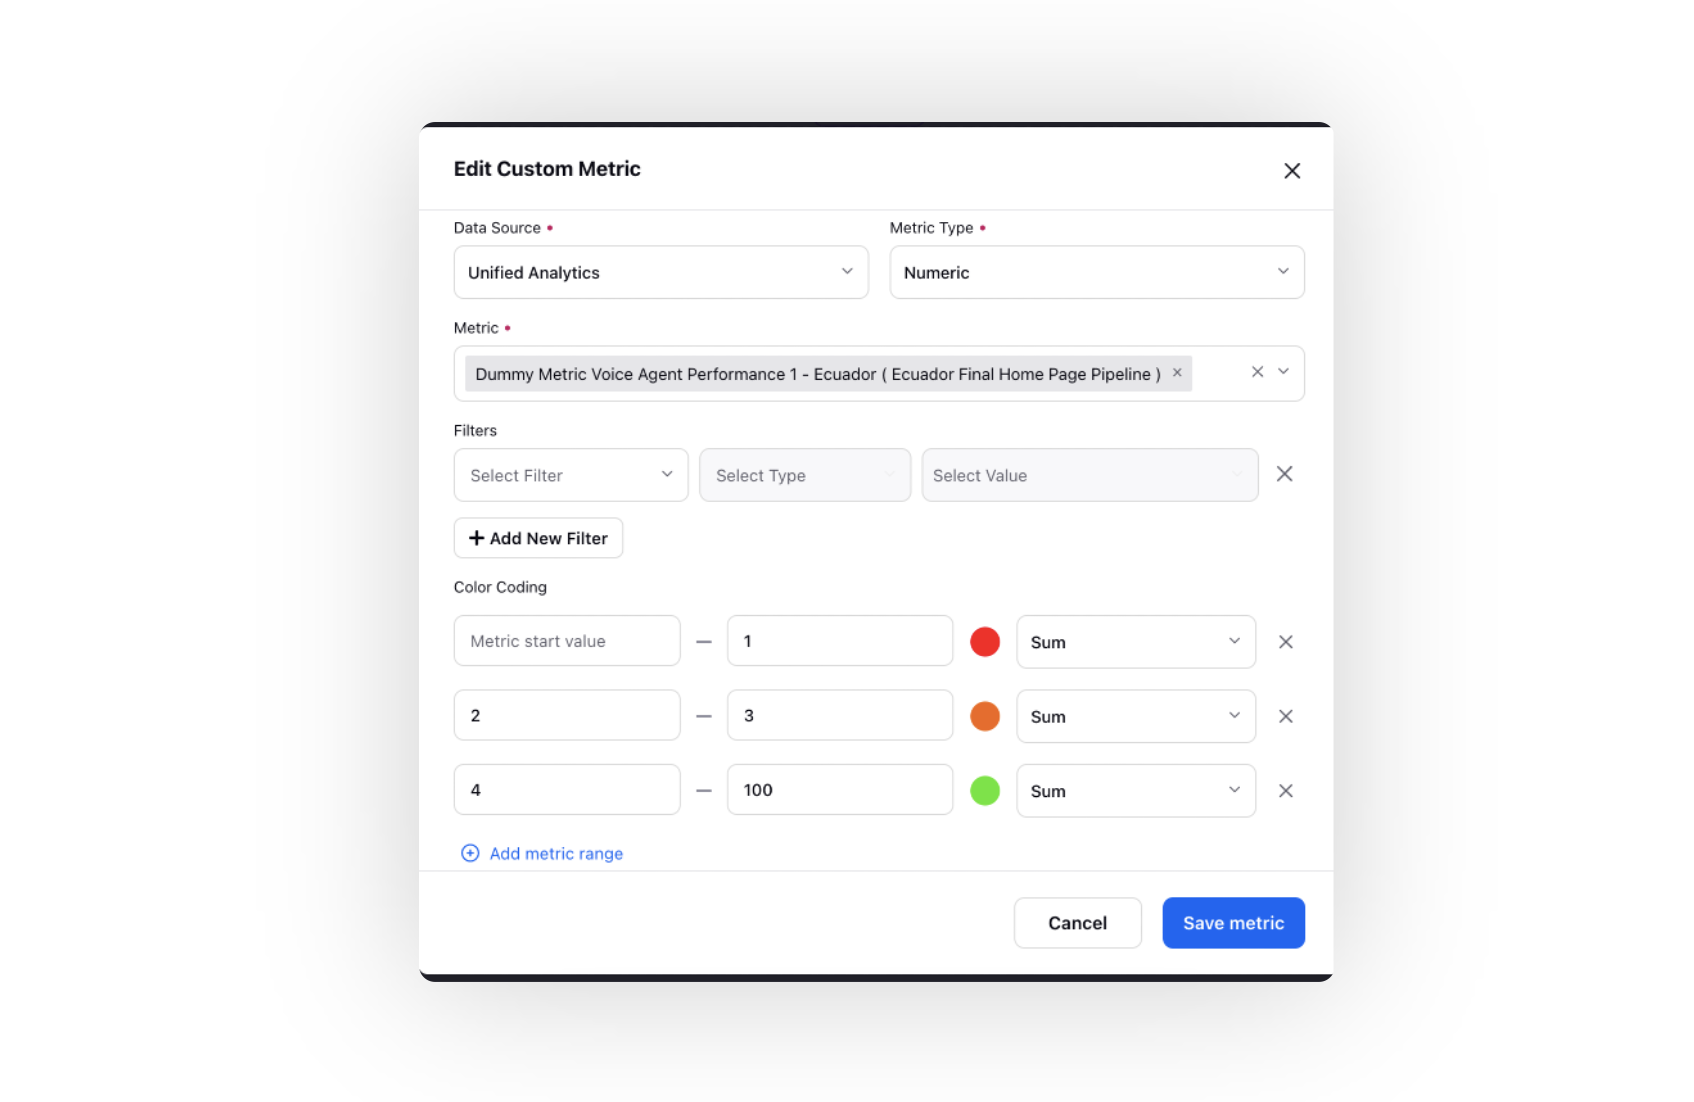
These color codes are applied in counter summary charts when the value of the custom metric falls within a particular range. Note that if the custom metric value doesn't fit within the range and is lower than the previous value, it is indicated in red. If the current value exceeds the previous value, it is depicted in green. When both the current and previous values are identical, the color remains black.