How to Compare Milestone Delays Using Custom Metrics
Updated
Compare milestone delays using custom metrics to identify friction in the brand’s workflows and improve the brand’s operations.
Use date custom fields as custom metrics in Reporting to identify friction in the brand’s workflows and improve the brand’s operations from the insights gathered through reporting. The date custom fields of the following entities can be used to report and collect data:
Campaign
Sub-Campaign
Outbound Message
Requests
Media Assets
The type of metric will be Time Difference, and you can filter it by Workflow Name. The new Standard Metrics to be available in reporting will be:
Campaign Duration
Description: The amount of time it takes for a campaign to complete. It is calculated by taking the difference between the campaign start date and the campaign end date.
The formula for metric calculation: Campaign End Date - Campaign Start Date
Condition: The end date exists for the campaign
Value = [Campaign End Date - Campaign Start Date]
Condition: The end date does not exist for the campaign
Value = [Evergreen]
Message Duration
Description: The amount of time it takes for a message to get published. It is calculated by taking the difference between message published time (or schedule time) and message created time.
Condition: Message is not published
Formula = Message Schedule Time - Message Created Time
Condition: Message is published
Formula = Message Publish Time - Message Created Time
Message Duration (including request intake duration)
Description: The amount of time it takes for a message to get published from when a request was raised for the same. It is calculated by taking the difference between message published time (or schedule time) and request created time.
Condition: Message is not published
Formula = Message Schedule Time - Request Created Time
Condition: Message is published
Formula = Message Publish Time - Request Created Time
Workflow Start Time (Metric)
"Workflow Start Time" already exists as a dimension in reporting. This will be exposed as a metric in reporting. You can use "Workflow Start Time (Metric)" in custom metrics and take the difference between "Workflow Start Time (Metric)" and date custom fields in Custom metrics.
How it works
Click the New Tab icon. In Sprinklr Marketing → Marketing tab, click Reporting within Analyze.
Search and select your Dashboard by typing in the desired keywords.
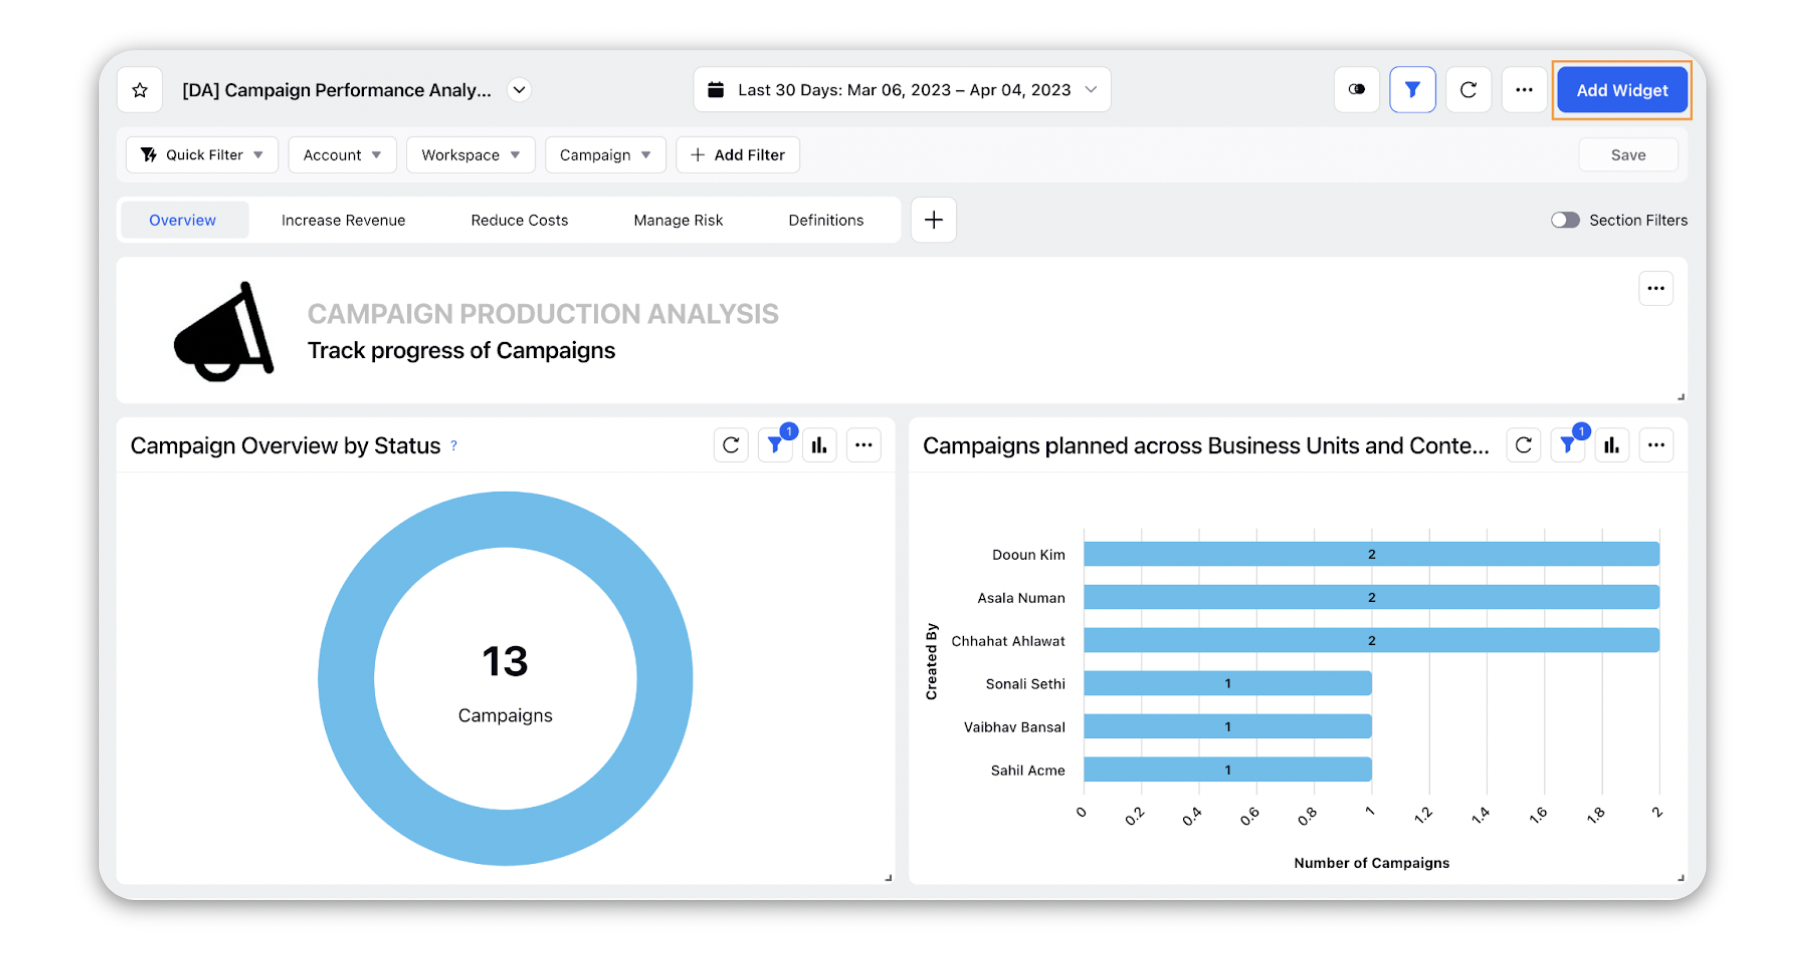
In the top right corner of the Reporting Dashboard window, click Add Widget
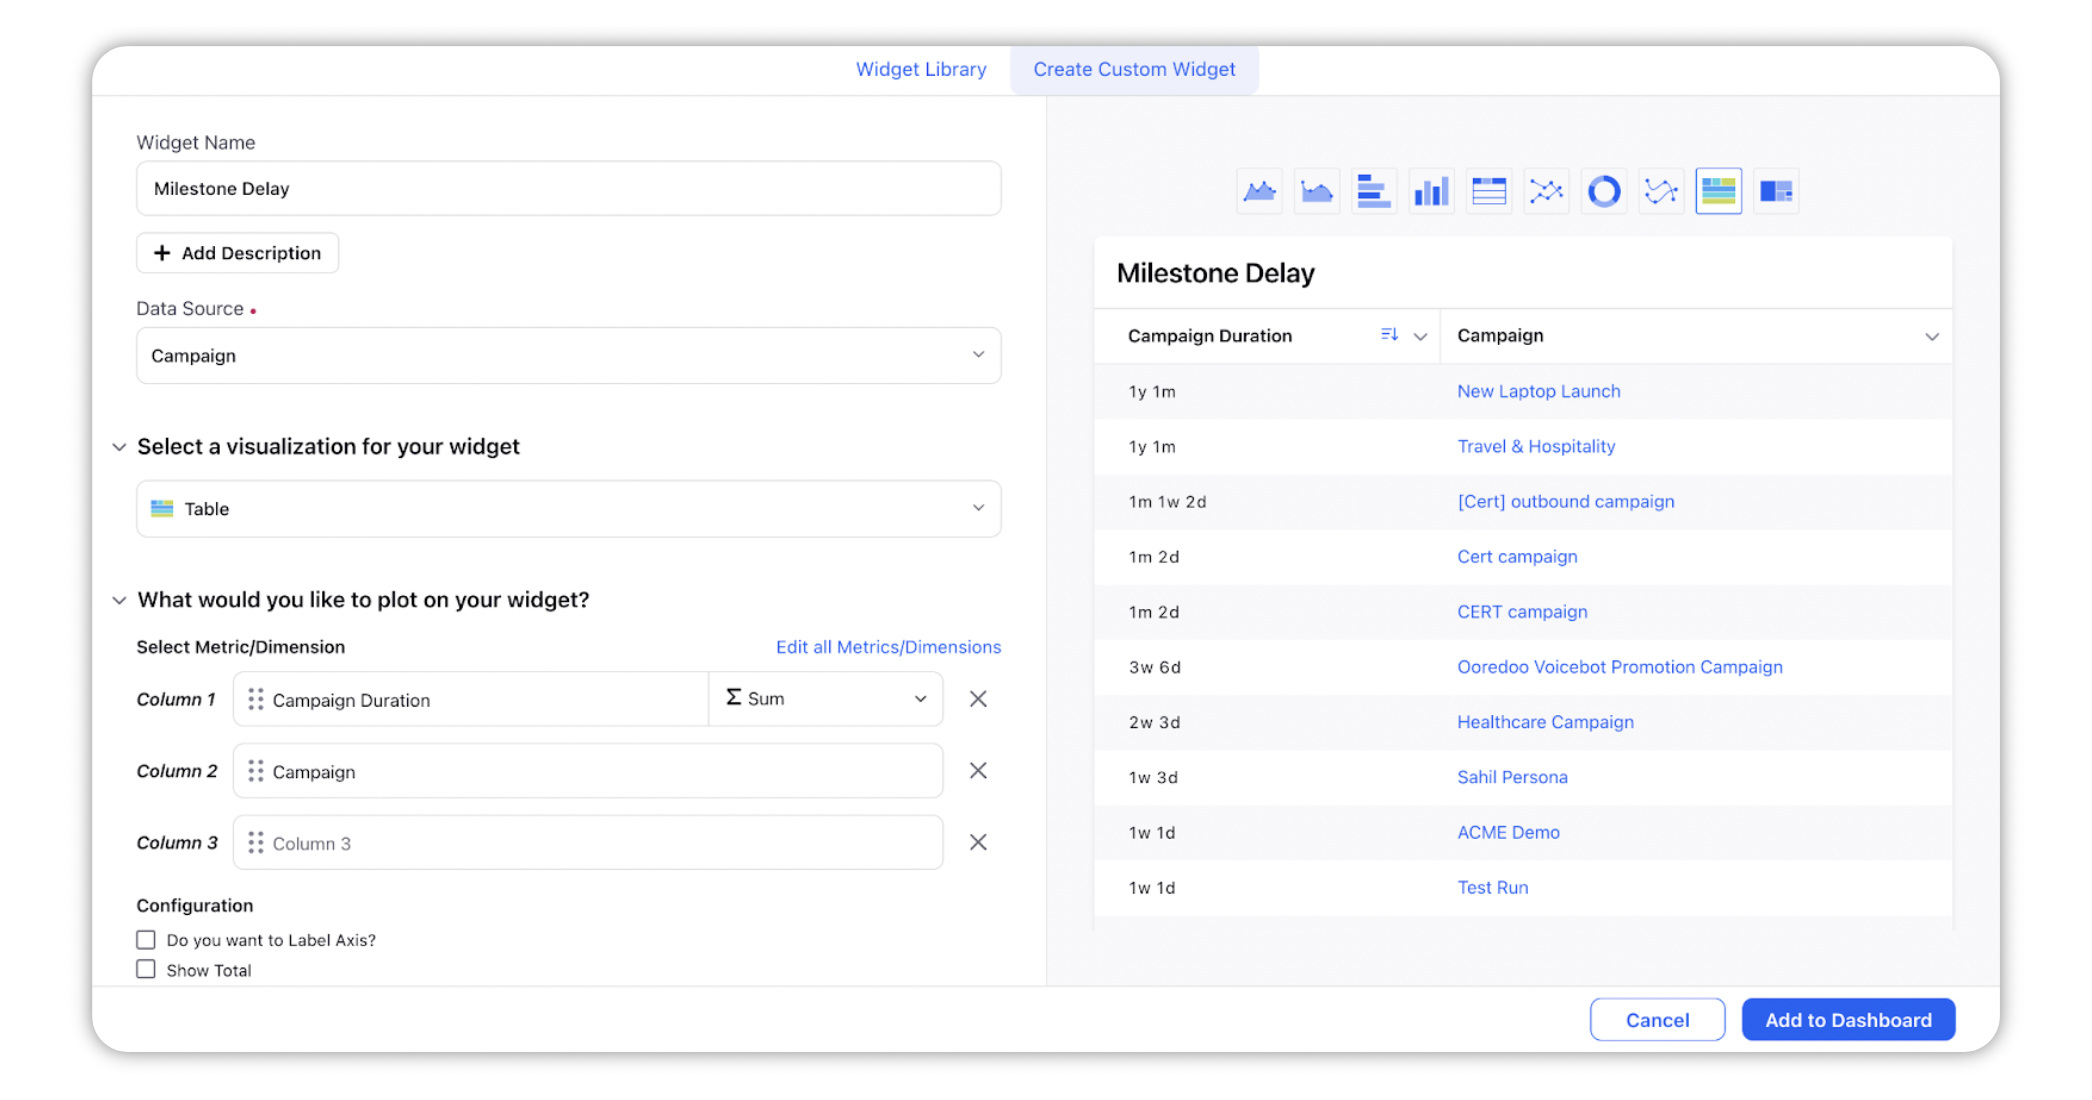
On the Create Custom Widget window, fill in the basic details.
Select the desired Data Source from the options available in the dropdown such as Campaigns, Outbound Message, Paid, Task, etc.
Select a Visualization type for your widget. Table is the preferred visualization type.
To plot on your widget, select the desired Metrics and Dimensions.
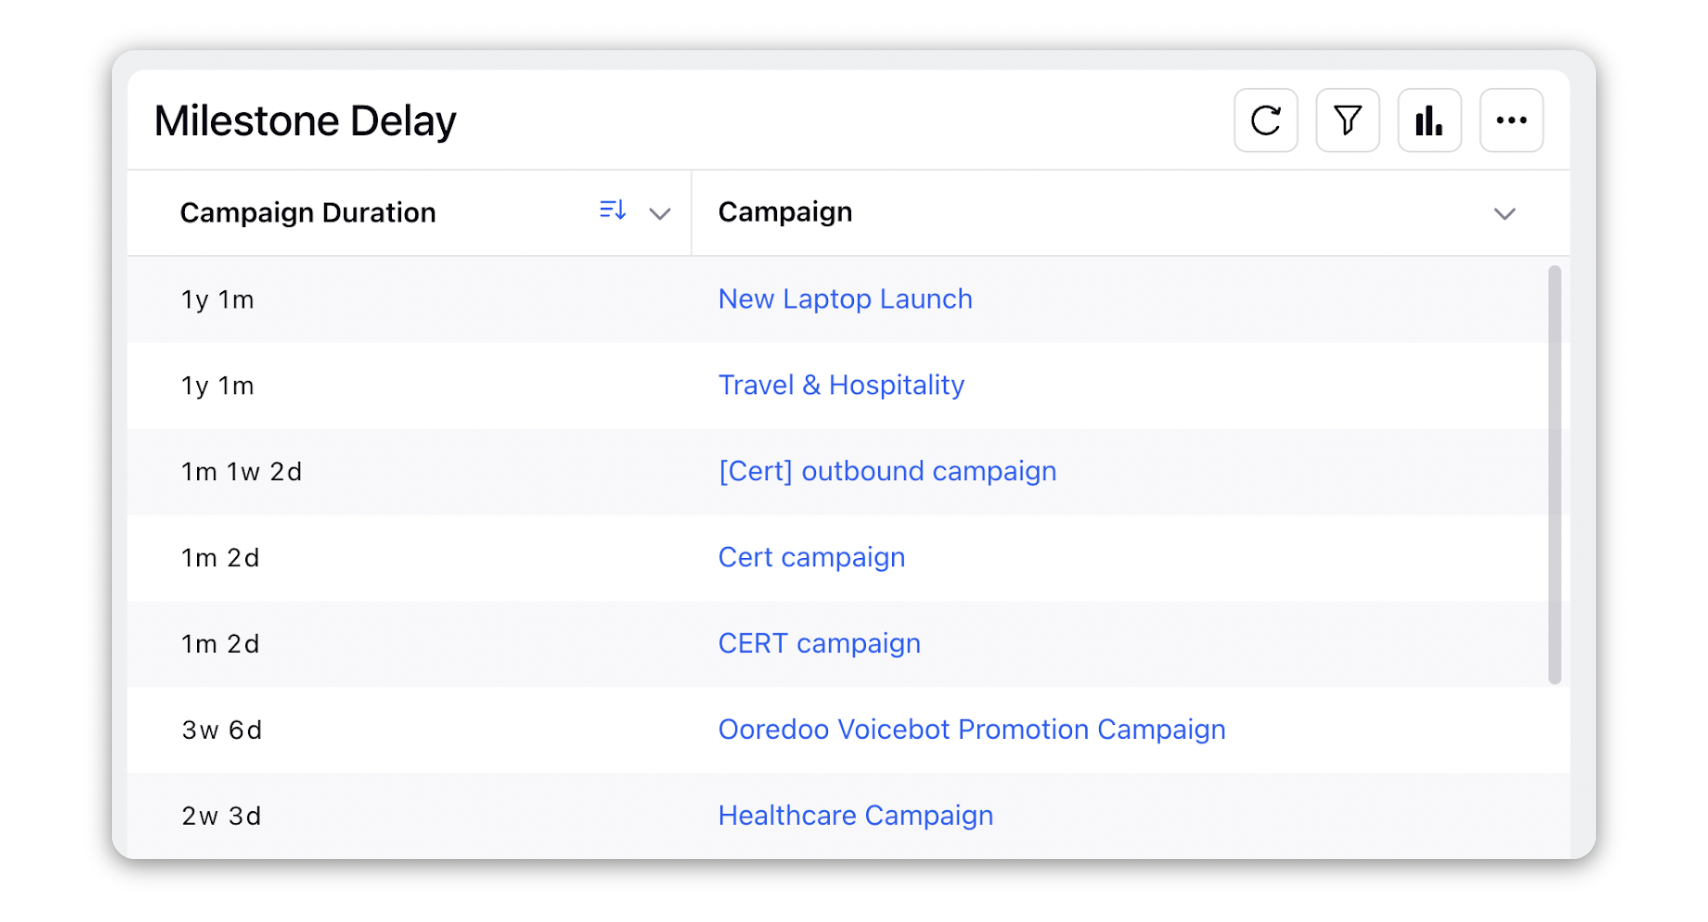
Click Add to Dashboard in the bottom right corner. Your widget will look like this.