How to View a Forecast
Updated
Forecasting for Workforce Management (WFM) is a crucial subject that aims to forecast and match an organization's personnel needs with the projected case volumes. To forecast the need for customer contacts in the future, this procedure entails analyzing historical data, market trends, and other pertinent aspects.
Note: The steps and information provided in this article pertain to Sprinklr WFM Version 1 (v1), which is the older version. For information on Sprinklr WFM Version 2 (v2), please refer to the Version 2 section.
Prerequisites for Viewing a Forecast:
Sprinklr WFM should be enabled for the environment and your user should have access to Workforce Planner Persona along with View permission under the forecasting section in the workforce management module.

Workload should be created & enabled and Work Queue should be mapped within each workload.
View a Forecast:
Once a forecast is created, supervisors can click on the eye icon beside the forecast name on the Records Screen to view the forecast. They can view the forecasted volume with and without adjustments. They can also see the workload-wise distribution of volume in a graphical format along with a tabular view to showcase the actual volume numbers.
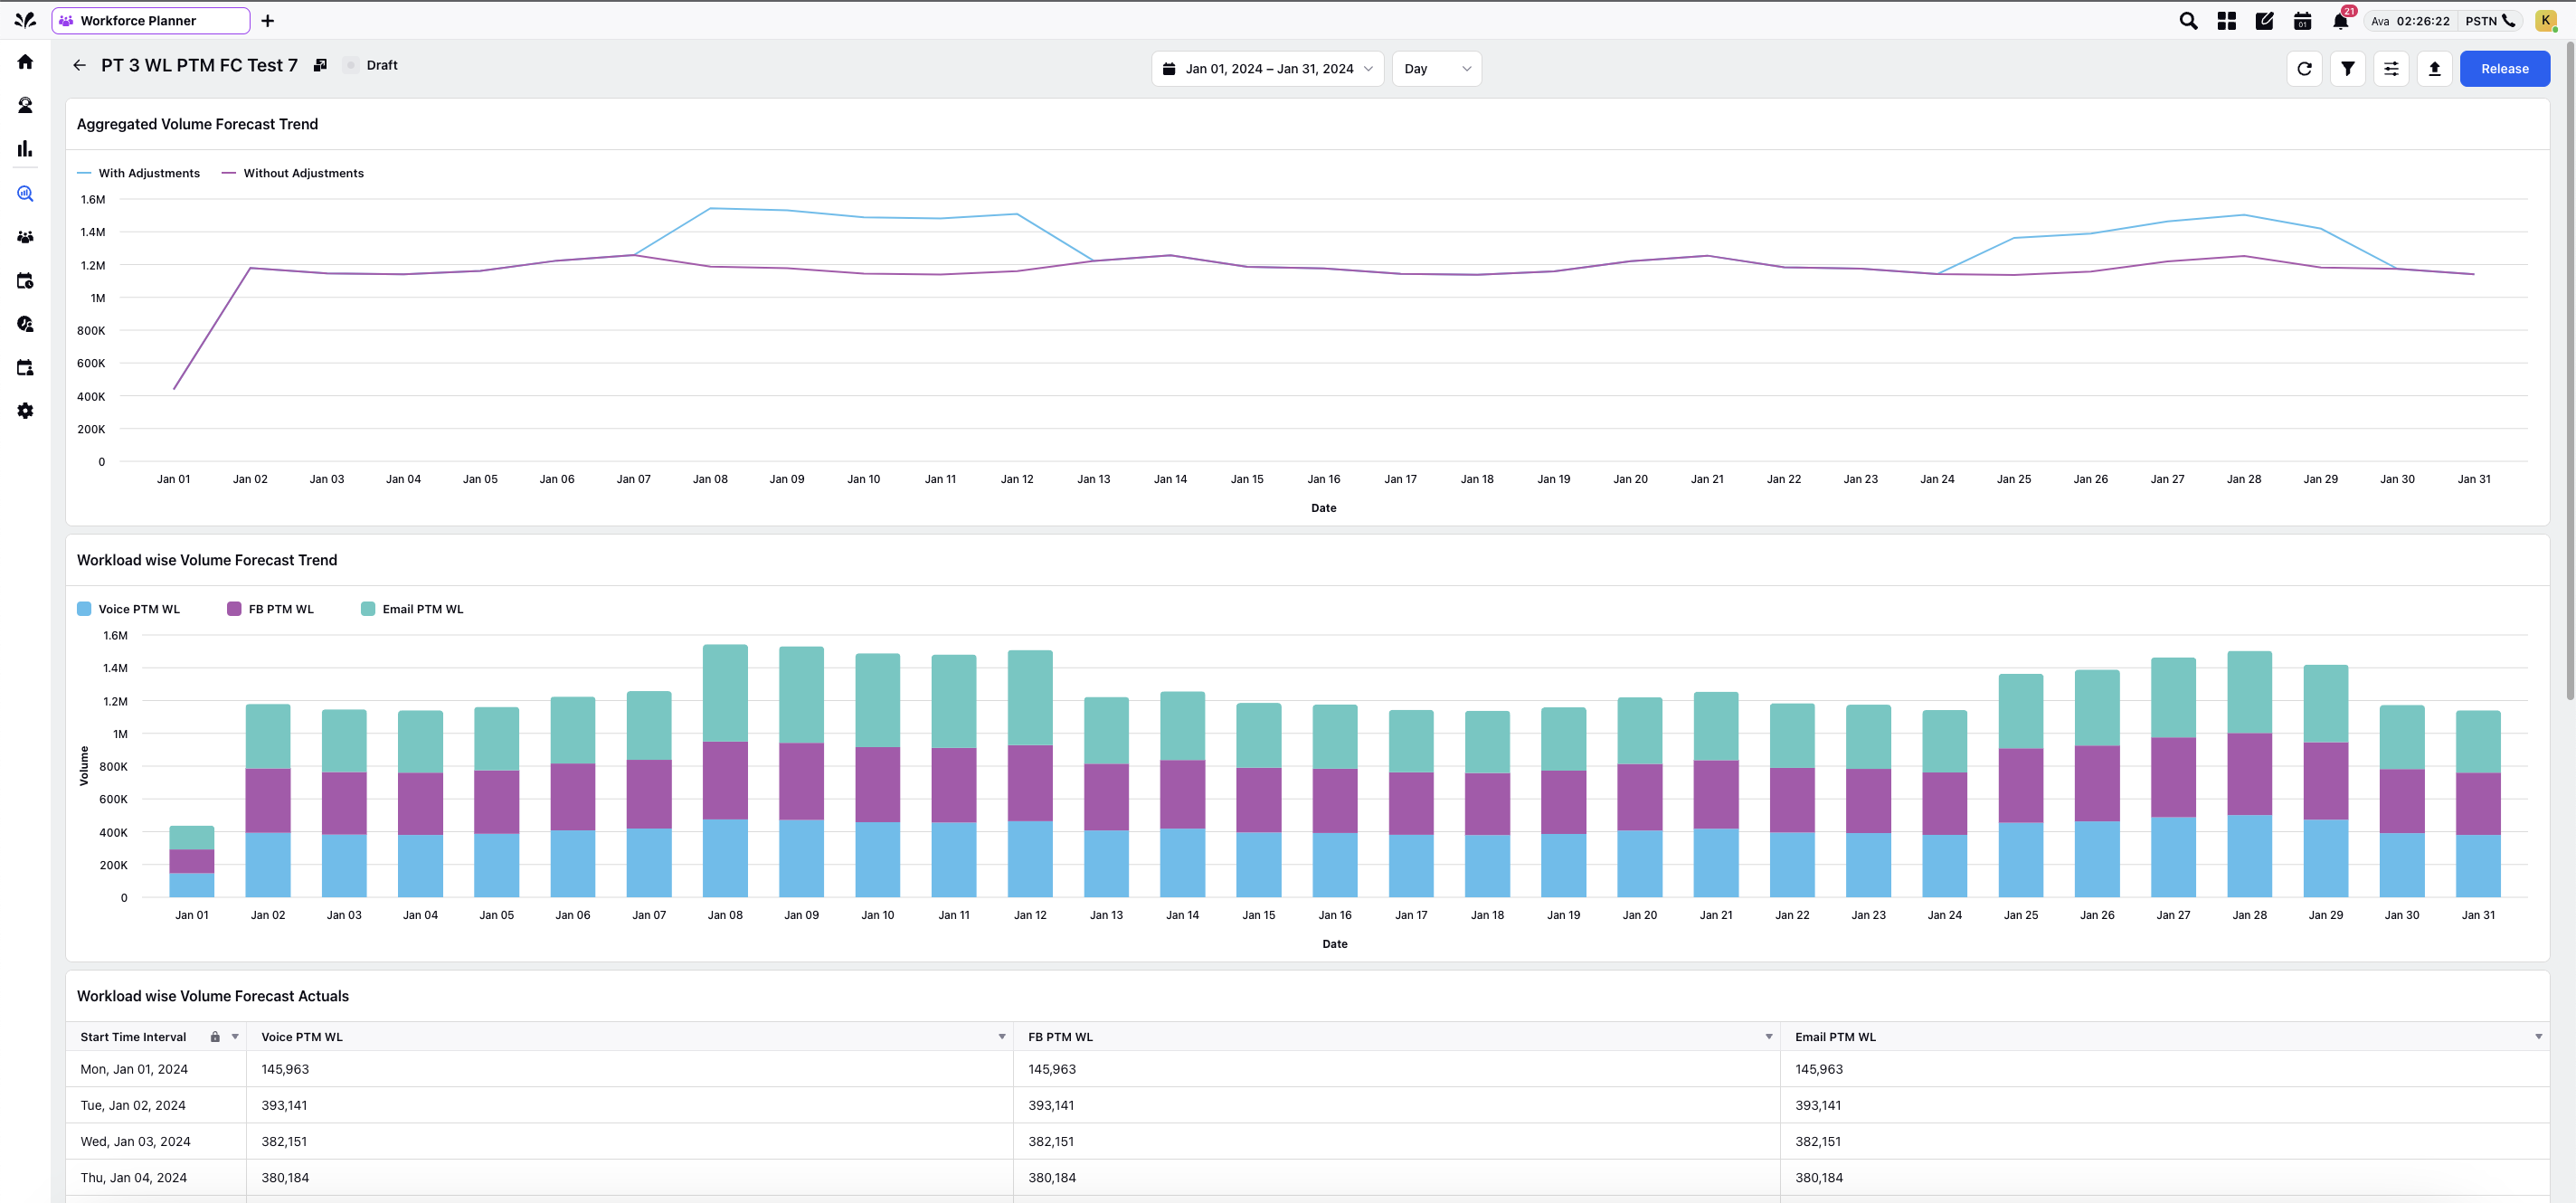
Major Components:
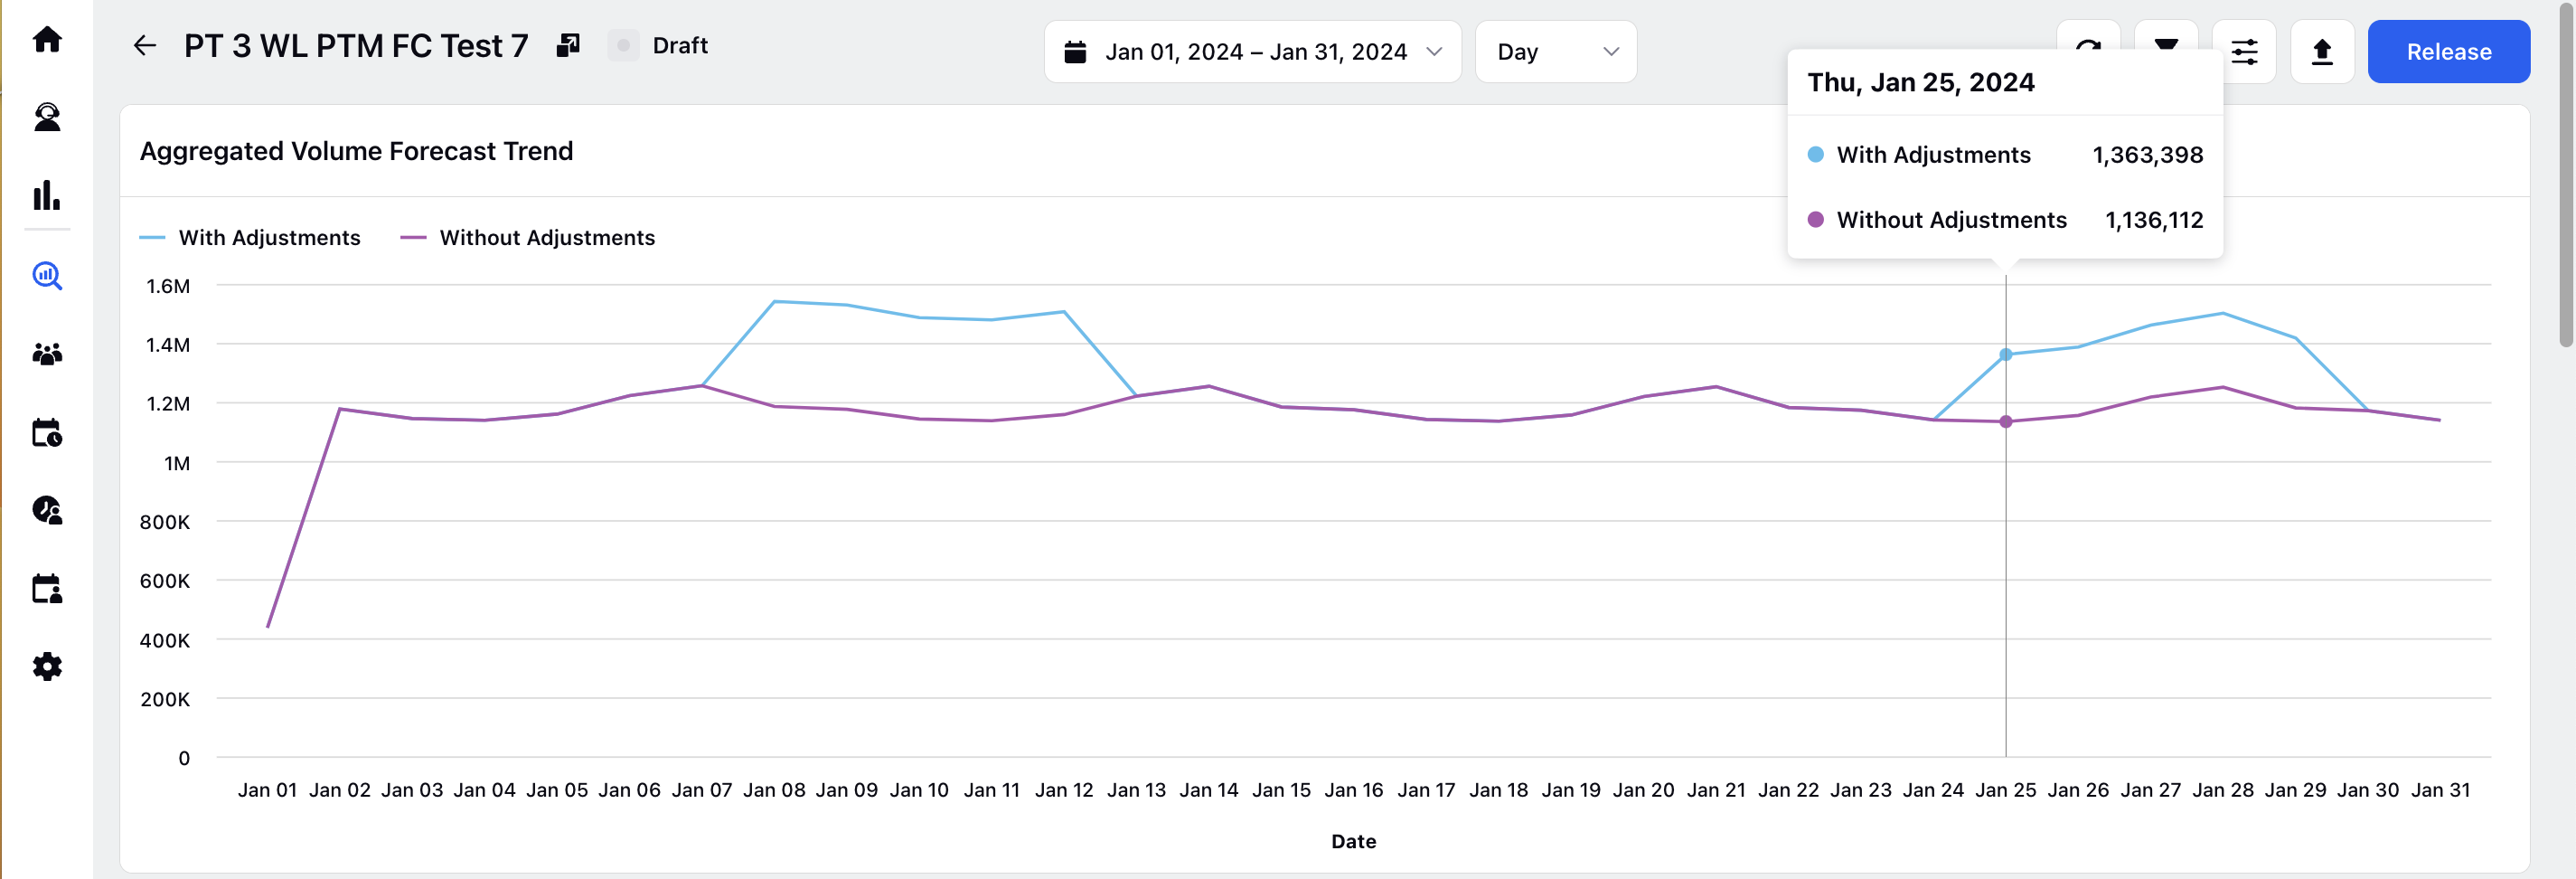
Aggregated Forecast Volume: - The widget comes from forecast reporting which displays the forecasted case volumes at the defined time interval as chosen from the time filter. Supervisors can hover on an interval and view the forecasted volume with and without adjustments.
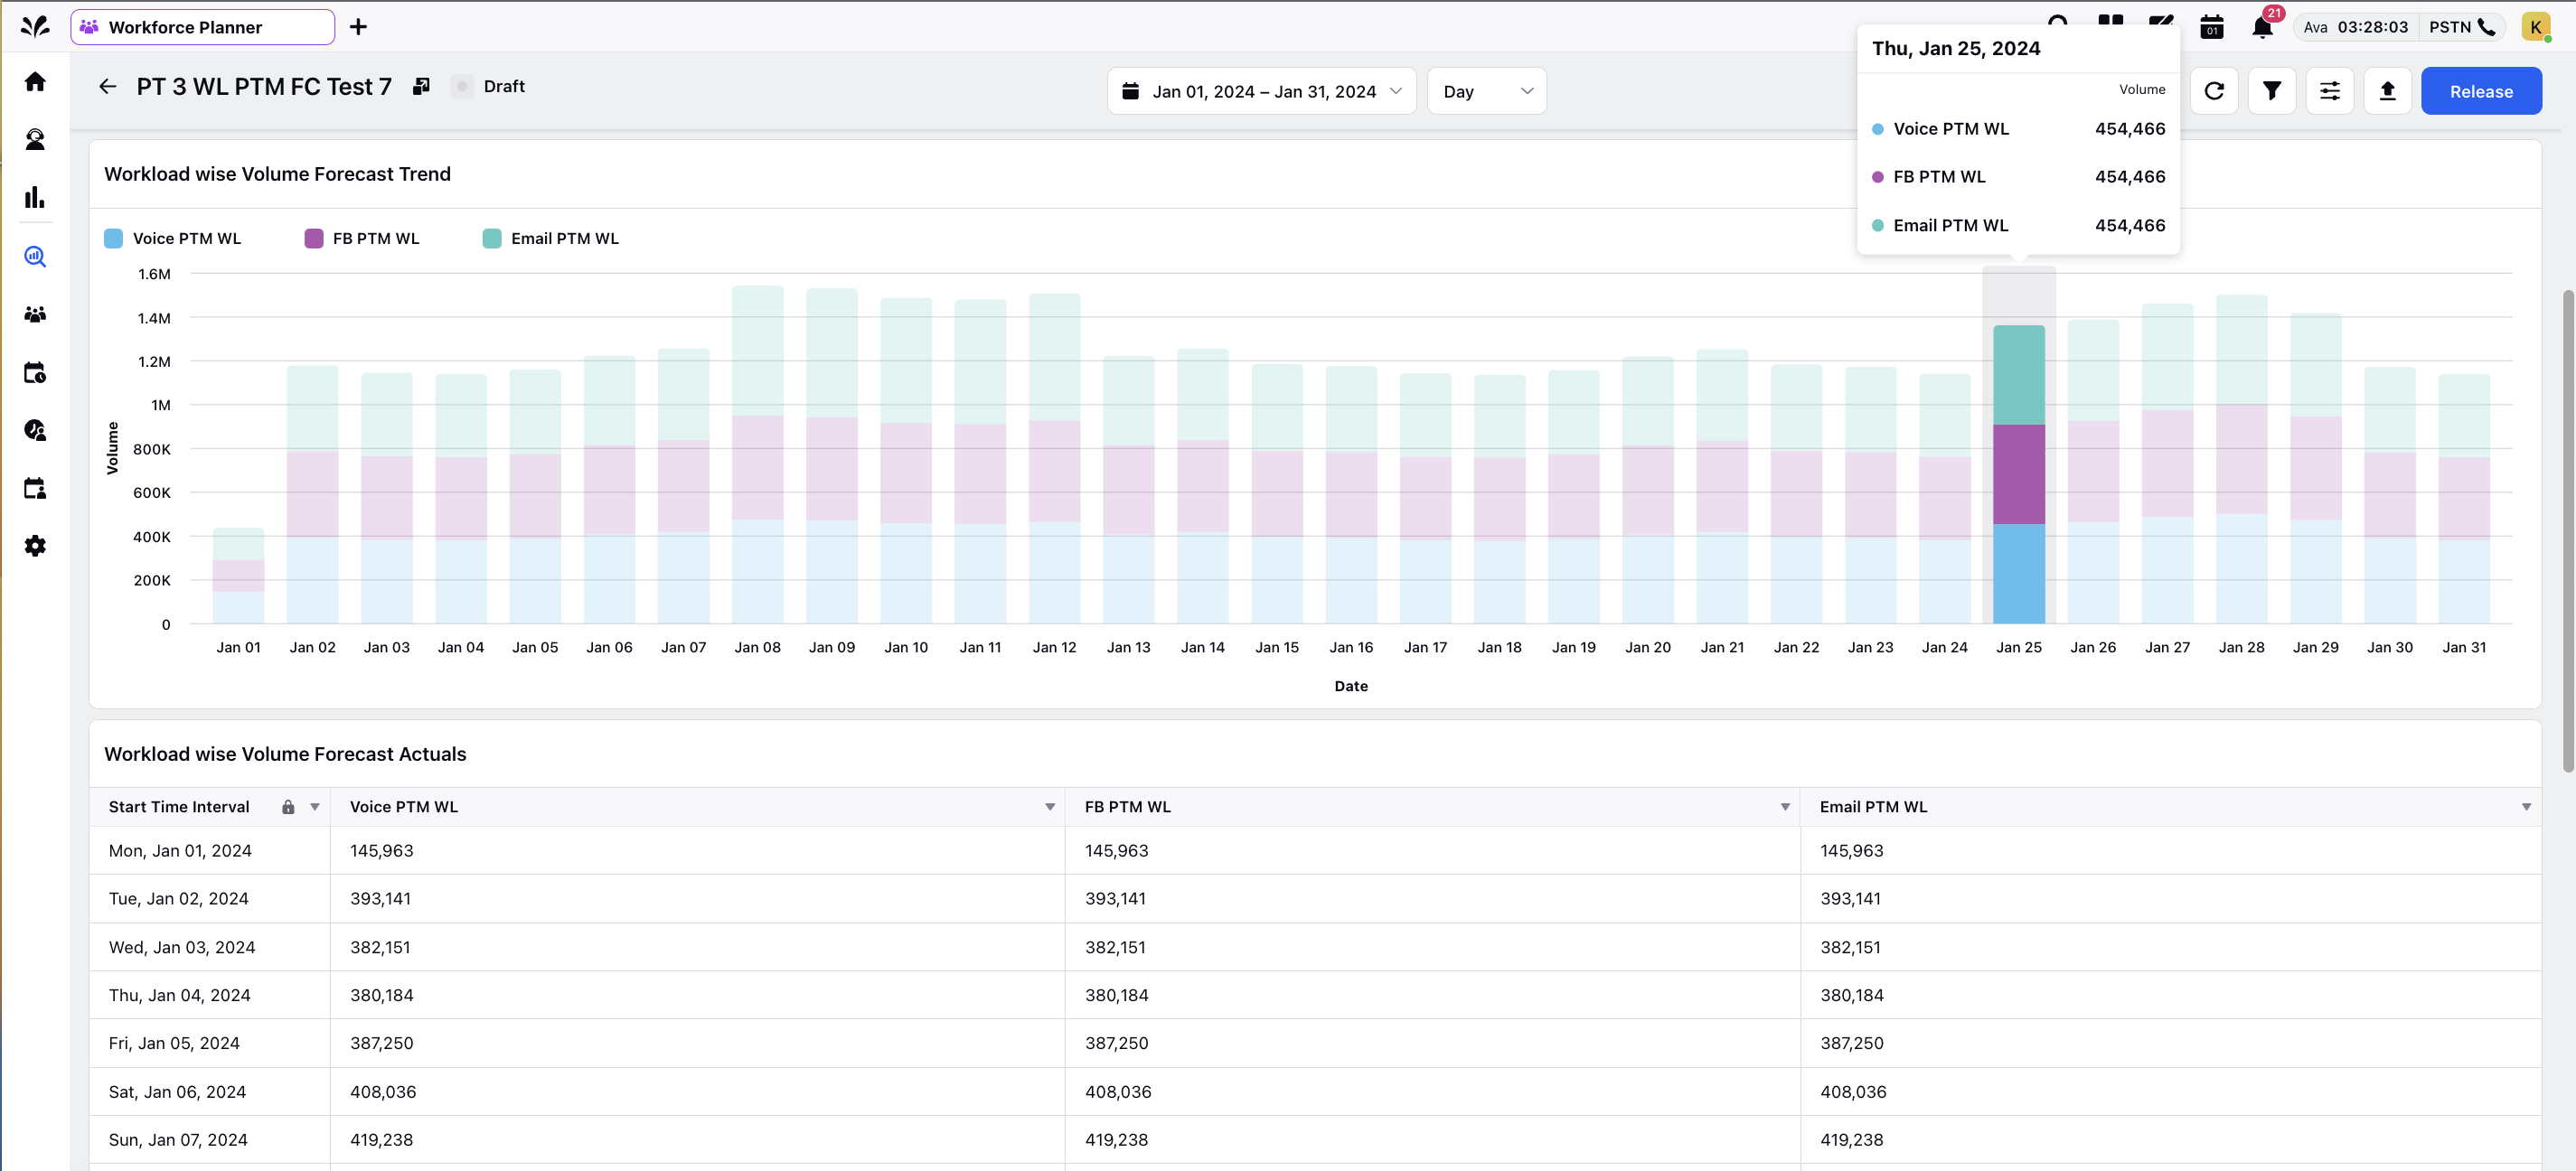
Workload-wise Forecast Volume Distribution: - The widgets come from forecast reporting which displays the forecasted case volumes for each workload, used at the time of creation, at the defined interval as chosen from the time filter. Supervisors can hover on a stacked bar graph or scroll down to view the forecasted volume for each workload in the tabular format.
Date Selector: - Supervisors can click on the Date Selector. This pops up a calendar where they can select a start date and an end date to filter the above-mentioned widgets to view the forecast. They can also select a particular month, or a year from the respective drop-down options for ease of access or use the next and previous arrow keys.
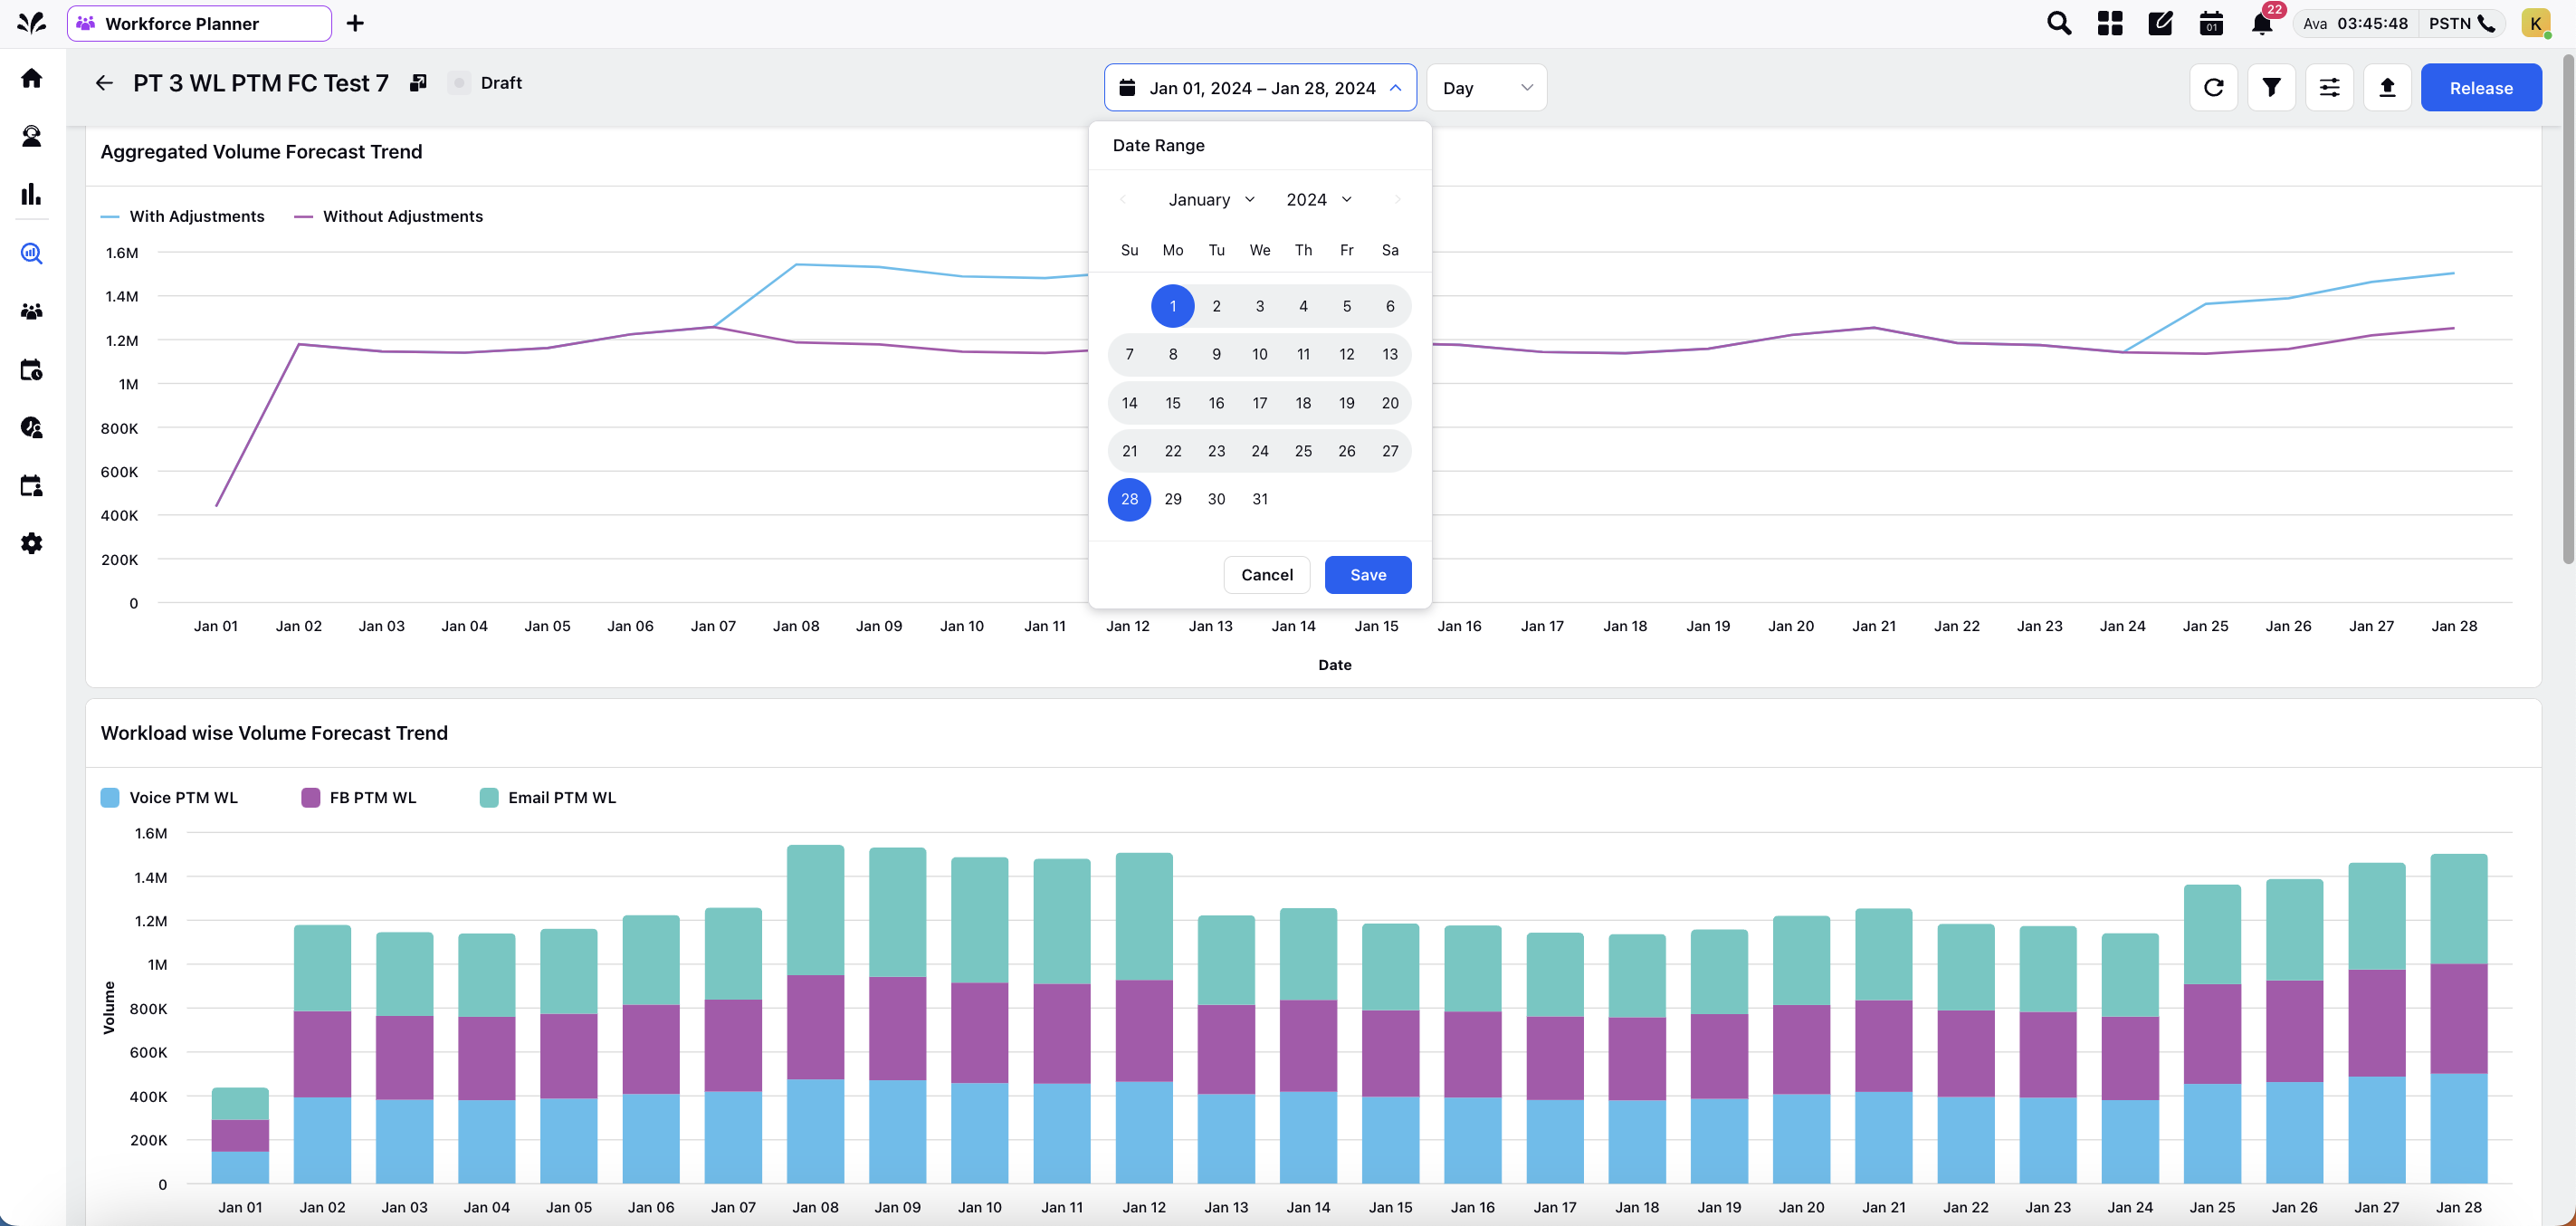
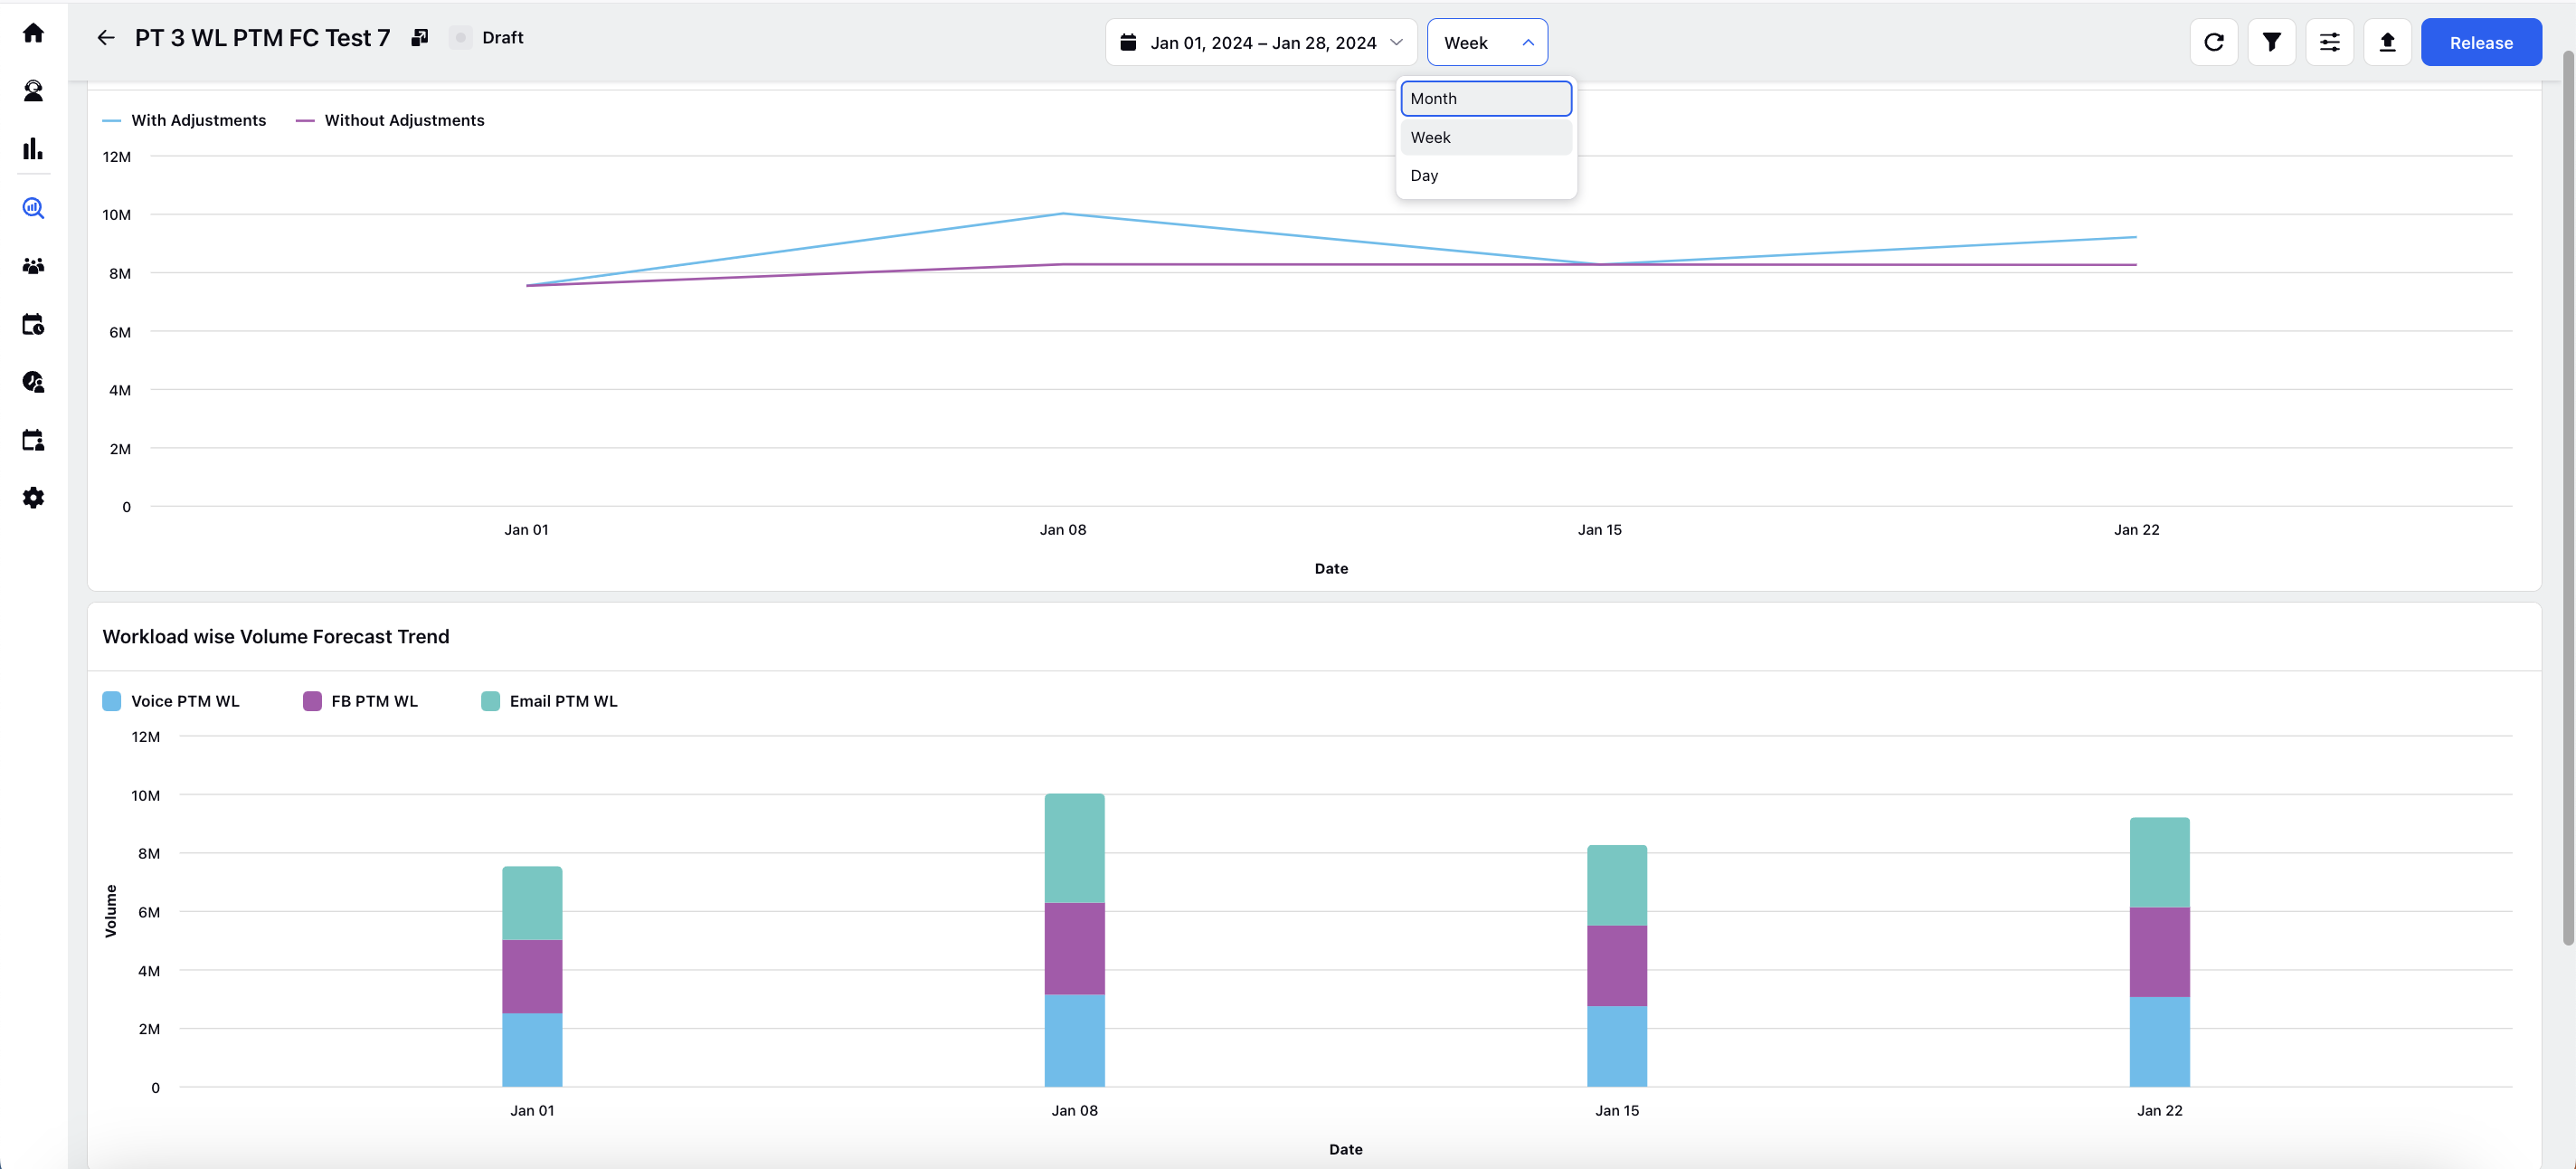
Time Filter: - Supervisors can select "Day", "Week" or "Month" time filters to apply on the above-mentioned widgets basis the duration for which the forecast is created.
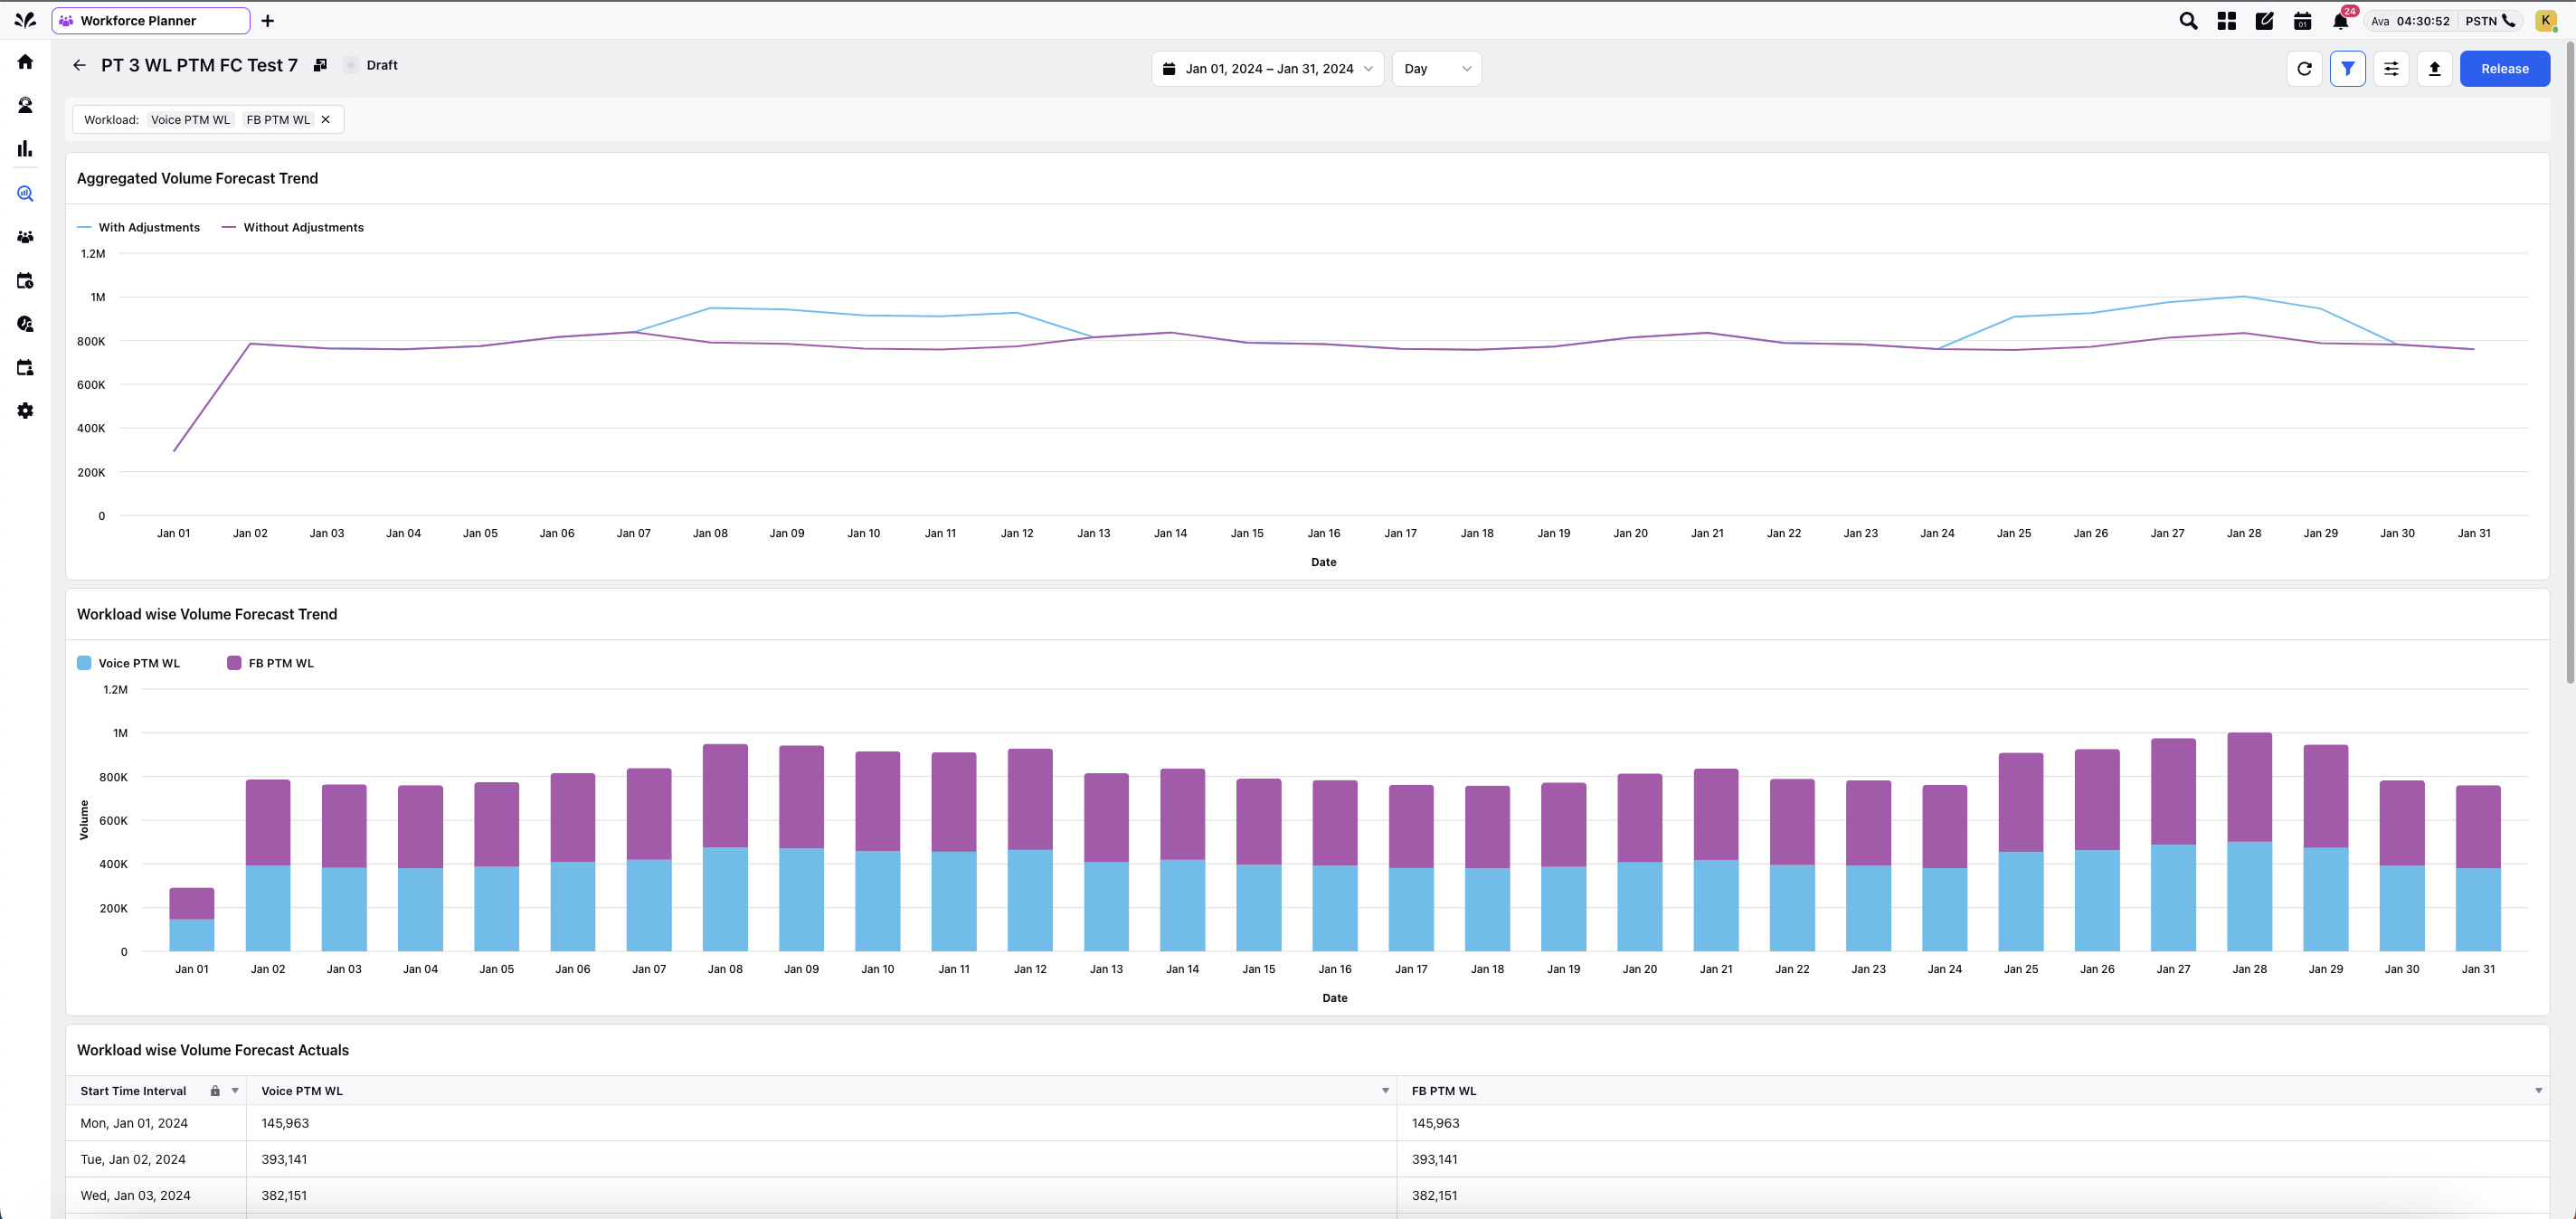
Filters: - Supervisors can further apply Workload Filters from top right beside the adjustment icon to view forecasted case volumes relating to a single or a combination of workloads.
Viewing the Forecast at Granular Level:
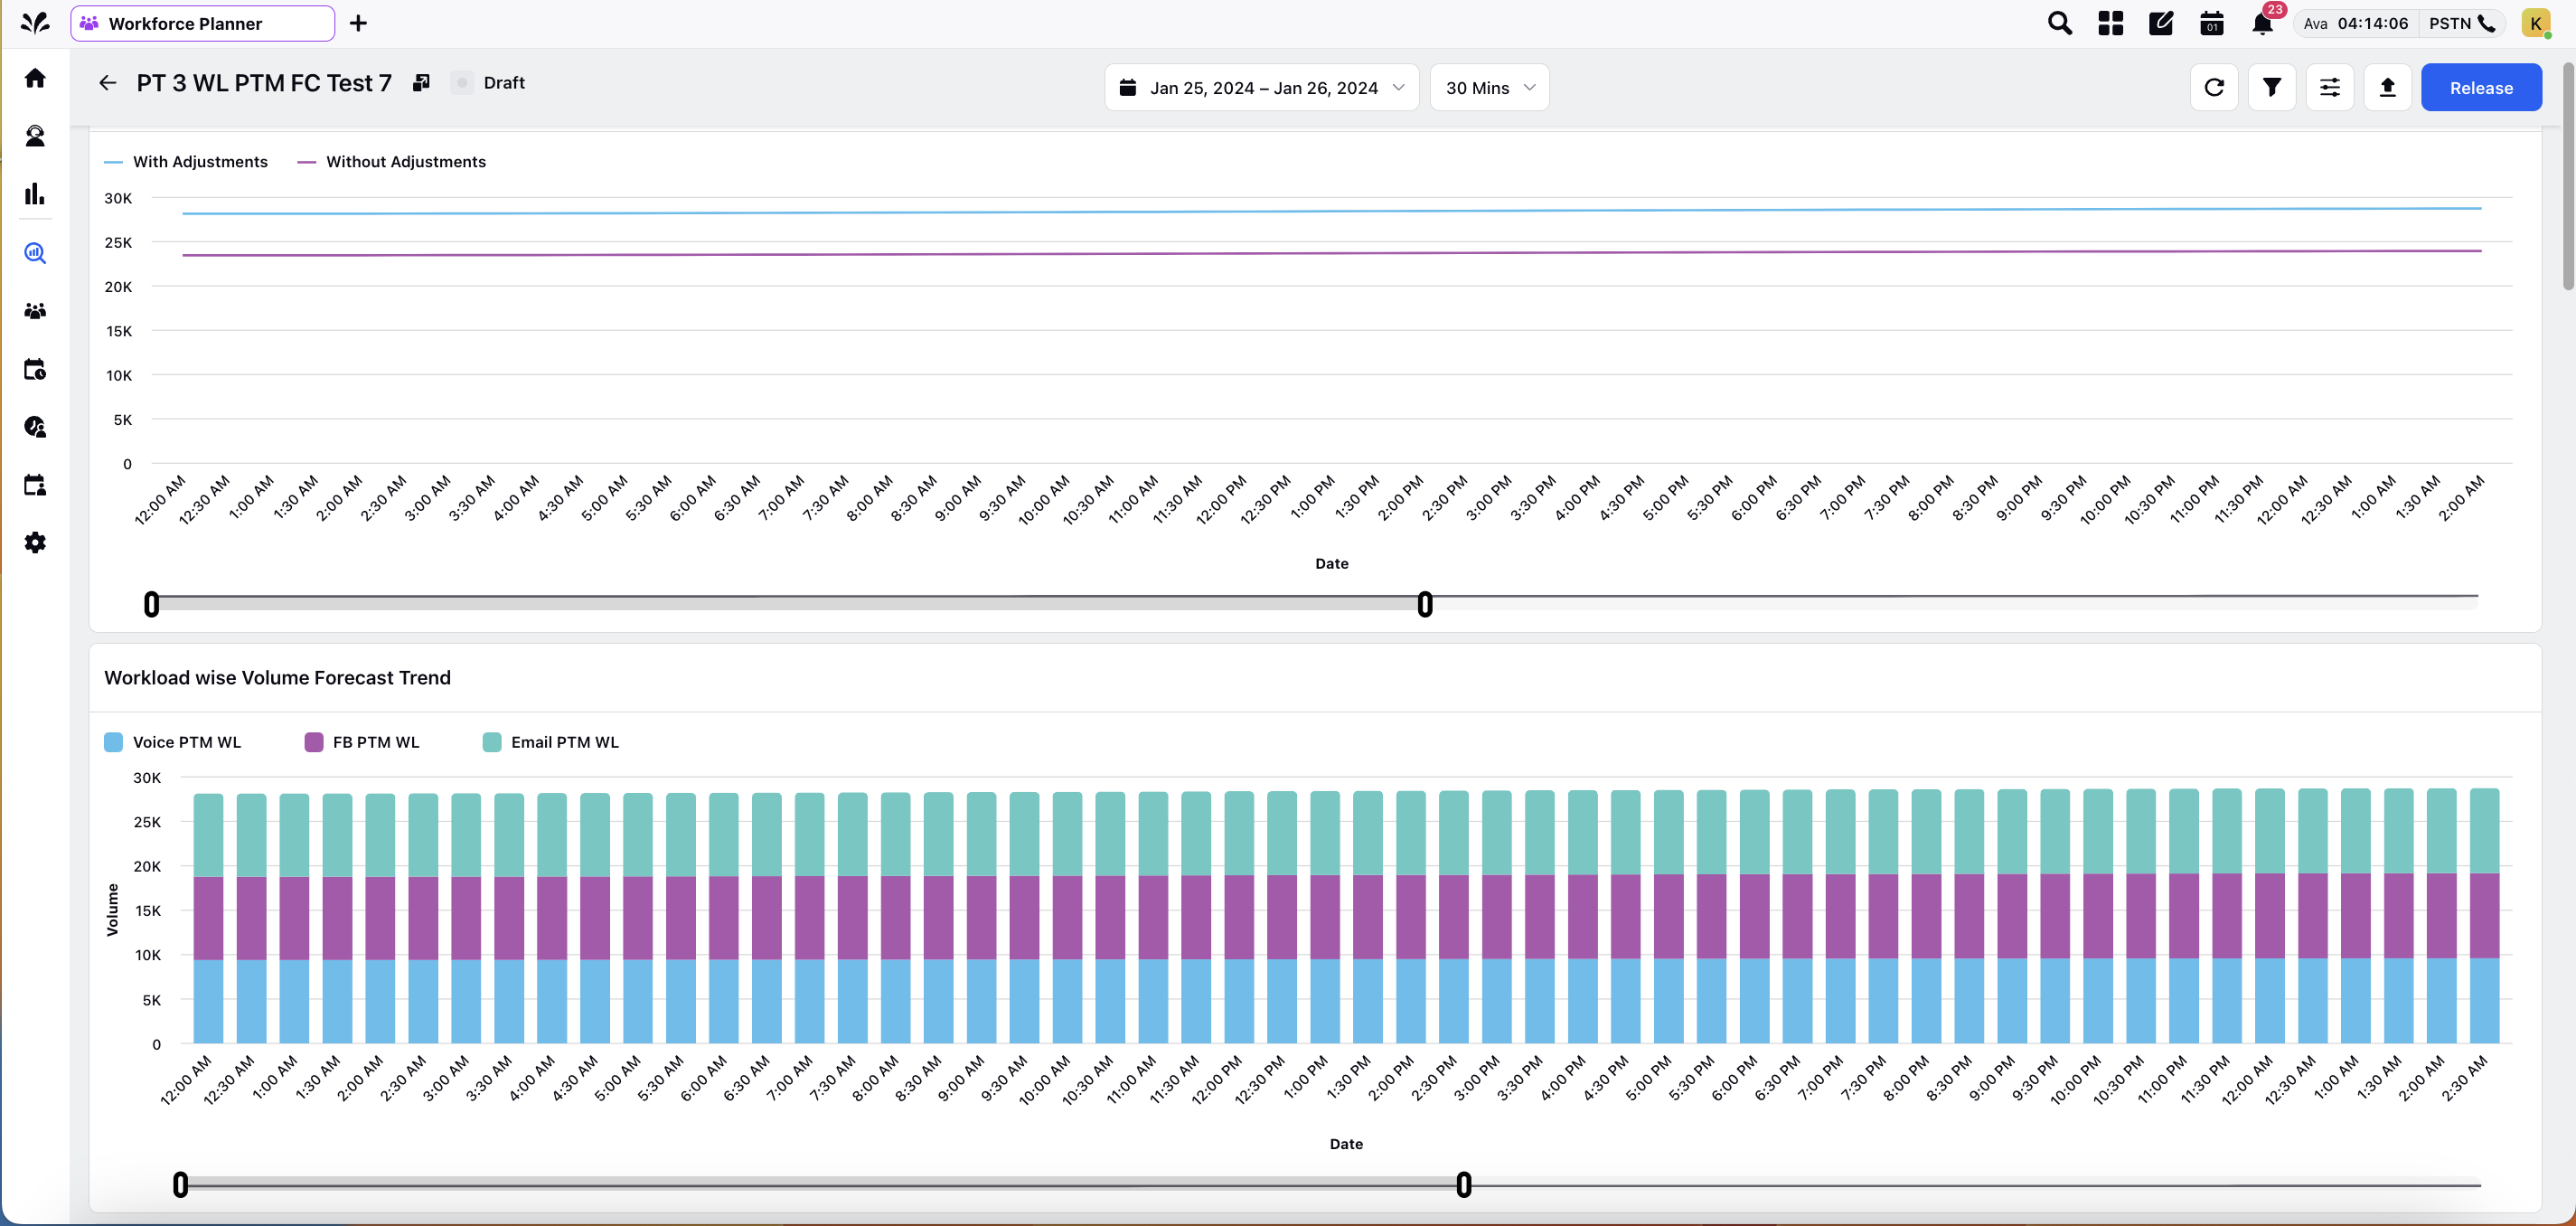
Supervisors can select same day or adjacent days as start and end date in the Date Selector to drill-down on hourly level or 30 minute level for those day(s). They can view the widgets' data at the same granular level as chosen.
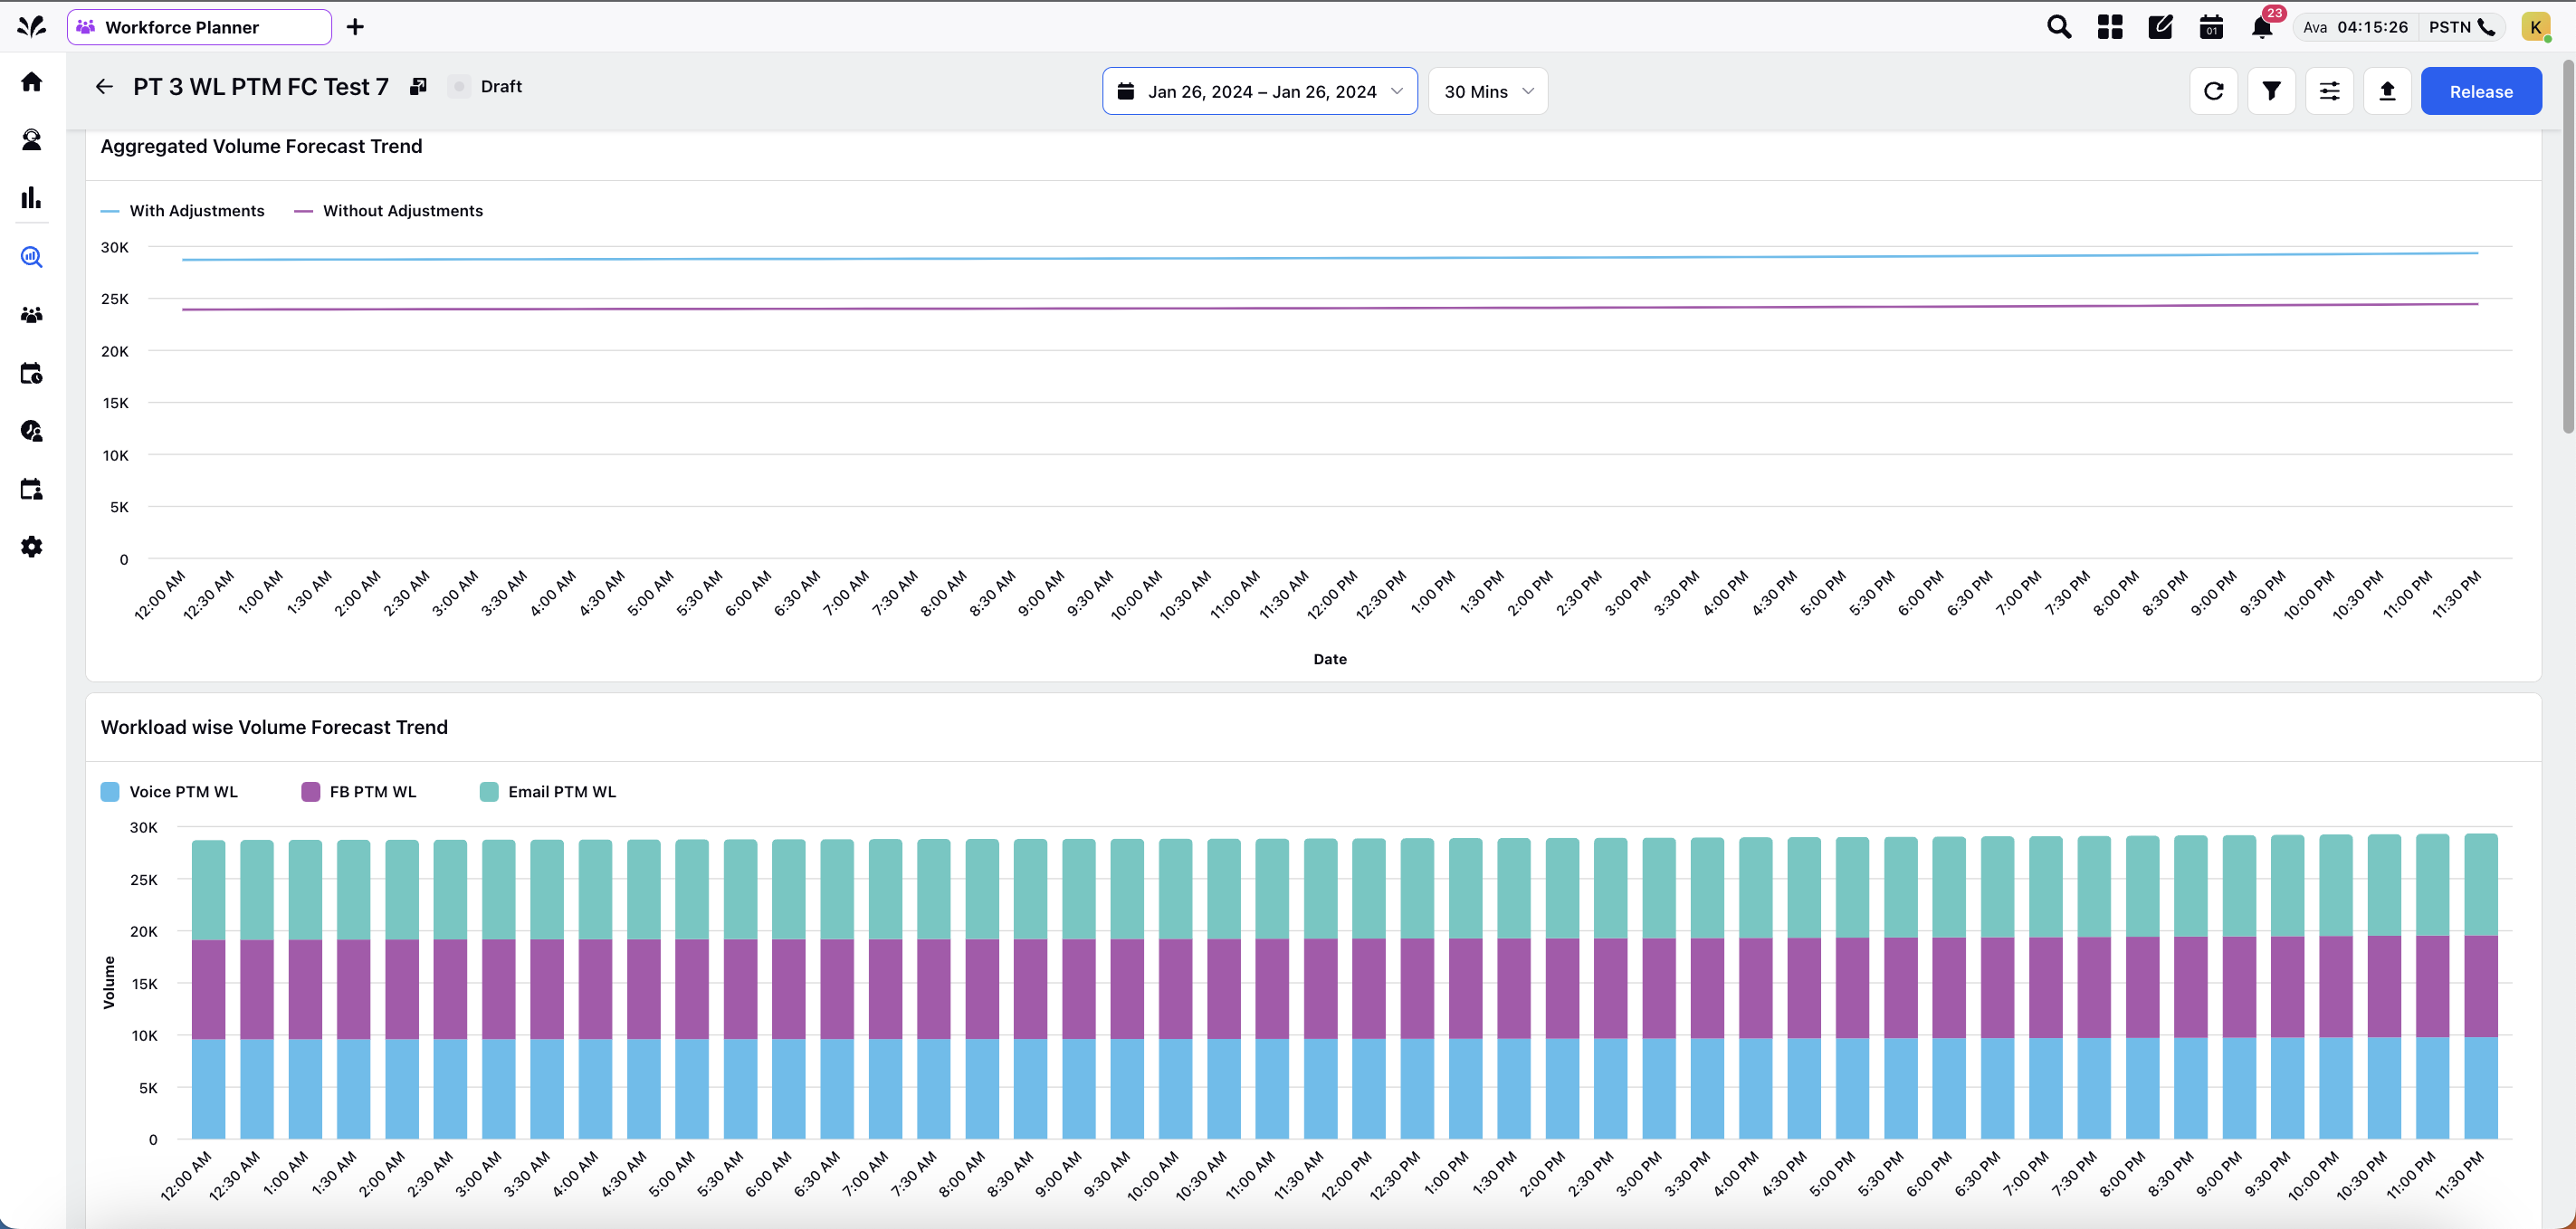
They can also slide the Scrubber horizontally to view all or limited number of data points as desired.
