Configuration Steps for Queue Monitoring
Updated
The Queue Monitoring feature is available in Supervisor Console by default. Supervisors can create new dashboards and can customize queue cards by adding metrics.
Actions on Queue Cards
Actions | Description |
Manage Columns | The supervisor has the control to show all or specific colums by clicking the Manage Columns icon on the top. The supervisor can toggle on or off the specific Queue column.
This feature requires backend configuration. To enable this in your environment, contact Sprinklr Support at tickets@sprinklr.com with the following details:
|
Date Range | Select the date range to view the queue data for. |

The supervisor can choose from following list of metrics and attributes that can be added in the card view.
Metric | Description |
Queue Name | The name of the Queue. |
Total Agents | The total number of agents present in the queue. |
Active Agents | Displays the number of agents active in the work queue at any given moment according to their availability status. |
Number of Agents available | Displays the number of agents available in the work queue at any given moment according to their availability status. |
Customers Waiting | The number of customers waiting. |
Cases in Progress | The cases that are currently being handled by the agents in the work queue. |
Estimated Avg. Handling Time | It is the estimated average time required by the agents in the queue to handle a case completely. |
Est. Work Queue Wait Time | It is the estimated time a message has to wait before getting assigned to an agent. |
Load Factor | Calculates the load of incoming cases awaiting assignment to a work queue while other cases are in progress. |
Number of Calls Answered | The number of calls answered by the agent in the queue. |
Number of Calls Abandoned | The total number of calls abandoned in a queue when a caller hangs up while waiting on that queue or at that route point or if the customer line is dropped for any reason. It also includes the total number of voice interactions abandoned while an agent call is ringing when the customer line is dropped for any reason. |
Number of calls landing in the queue | Call traffic that came into the queue. |
SLA % | Percentage of calls answered within the SLA. |
Call Abandon % | Percentage of calls abandoned that came into the queue. |
Oldest Customer Waiting Time | The oldest unassigned customer of the queue. |
Average Wait Time | The average wait time for a case to get assigned to an agent in the queue. Below these metrics, the supervisor can view the aggregate summary of the user’s availability status and the user current state that are a part of the queue. |
For metrics definition, see Understanding Queue in Unified Routing | Sprinklr Help Center
Manage Columns
The Manage Columns option allows supervisors to enable or disable specific metrics displayed as columns on the dashboard. Default metrics (columns) cannot be disabled through the UI.
![]() Note: The default metrics can be configured. This feature requires backend configuration. To enable this in your environment, contact Sprinklr Support at tickets@sprinklr.com with the following details:
Note: The default metrics can be configured. This feature requires backend configuration. To enable this in your environment, contact Sprinklr Support at tickets@sprinklr.com with the following details:
Persona app
Record Manager used
Metrics to be configured

Hide / Unhide Summary Widgets
Click the Toggle Summary icon on the top right to hide the Agent Activity widgets for better visibility.

Call Mode Column
The supervisor can see whether the agent is taking calls via PSTN Mode or WebRTC Mode. This can be enabled only for those clients that have Ozonetel as a Telephony Provider.
This helps the supervisor track whether the agent is making the call via phone or via the web. To learn more about getting this column enabled in your environment, please work with your Success Manager.

Supervisor Console Metric Adjustments
Hover over the Dropdown icon alongside the column name to get a list of metric adjustments using which you can adjust the value of the columns accordingly.

Metric Adjustments | Description |
Sort ascending | This option sorts the column data from the smallest to the largest value. The values will depend on the column data. For example, for the Agent column, this option will sort the data in ascending alphabetical order. For Agent Time in Current Status, it will arrange the data from the least time spent by an agent to the highest time spent in a particular status. |
Sort descending | This option sorts the column data from the largest to the smallest value. The values will depend on the column data. For example, for the Agent column, this option will sort the data in descending alphabetical order. For Agent Time in Current Status, it will arrange the data from the highest time spent by an agent to the least time spent in a particular status. |
Aggregate by Sum | By selecting this, you get the collective amount of time that agent has spent in a particular status. |
Aggregate by Average | This will give the central/average value of the time spent by the agent in the status. |
Aggregate by Minimum | This will give the value of the minimum amount of time spent by the agent in the particular status. |
Aggregate by Max | This will give the value of the maximum amount of time spent by the agent in the particular status. |
Aggregate by % | This will sort by taking the value of one user with all other users to calculate the time of status. For example: There are a total of 5 users and each user spent 1 hour in their respective current status. So by taking the value of one user against the remaining 4 users you would get the aggregate value in percentage ⅕ = 20% |
Aggregate by % change | This will give you the aggregate value in % by taking up the status value of the current time range with the previous time range. |
Aggregate by change | This is the same as above but it will give you the aggregate value in number and not in percentage. |
Pivot Column | It means the primary column and all details in other columns will be dependent on the primary column. |
Freeze Column | You can freeze the column to pin it in the same place and see it when you scroll. |
Further admin can decide the governance of features that can be enabled for the supervisor. Apart from this supervisor can create quick filters and visual alerts with the help of color tagging settings. The detailed configuration steps are added here.
Drilldowns on Queue Summary Metrics
You can create Lenses, which are dashboard-based overlays, and map them to the queue summary metrics. These lenses allow you to drill down into queue summary metric data in the third pane for a more in-depth analysis.
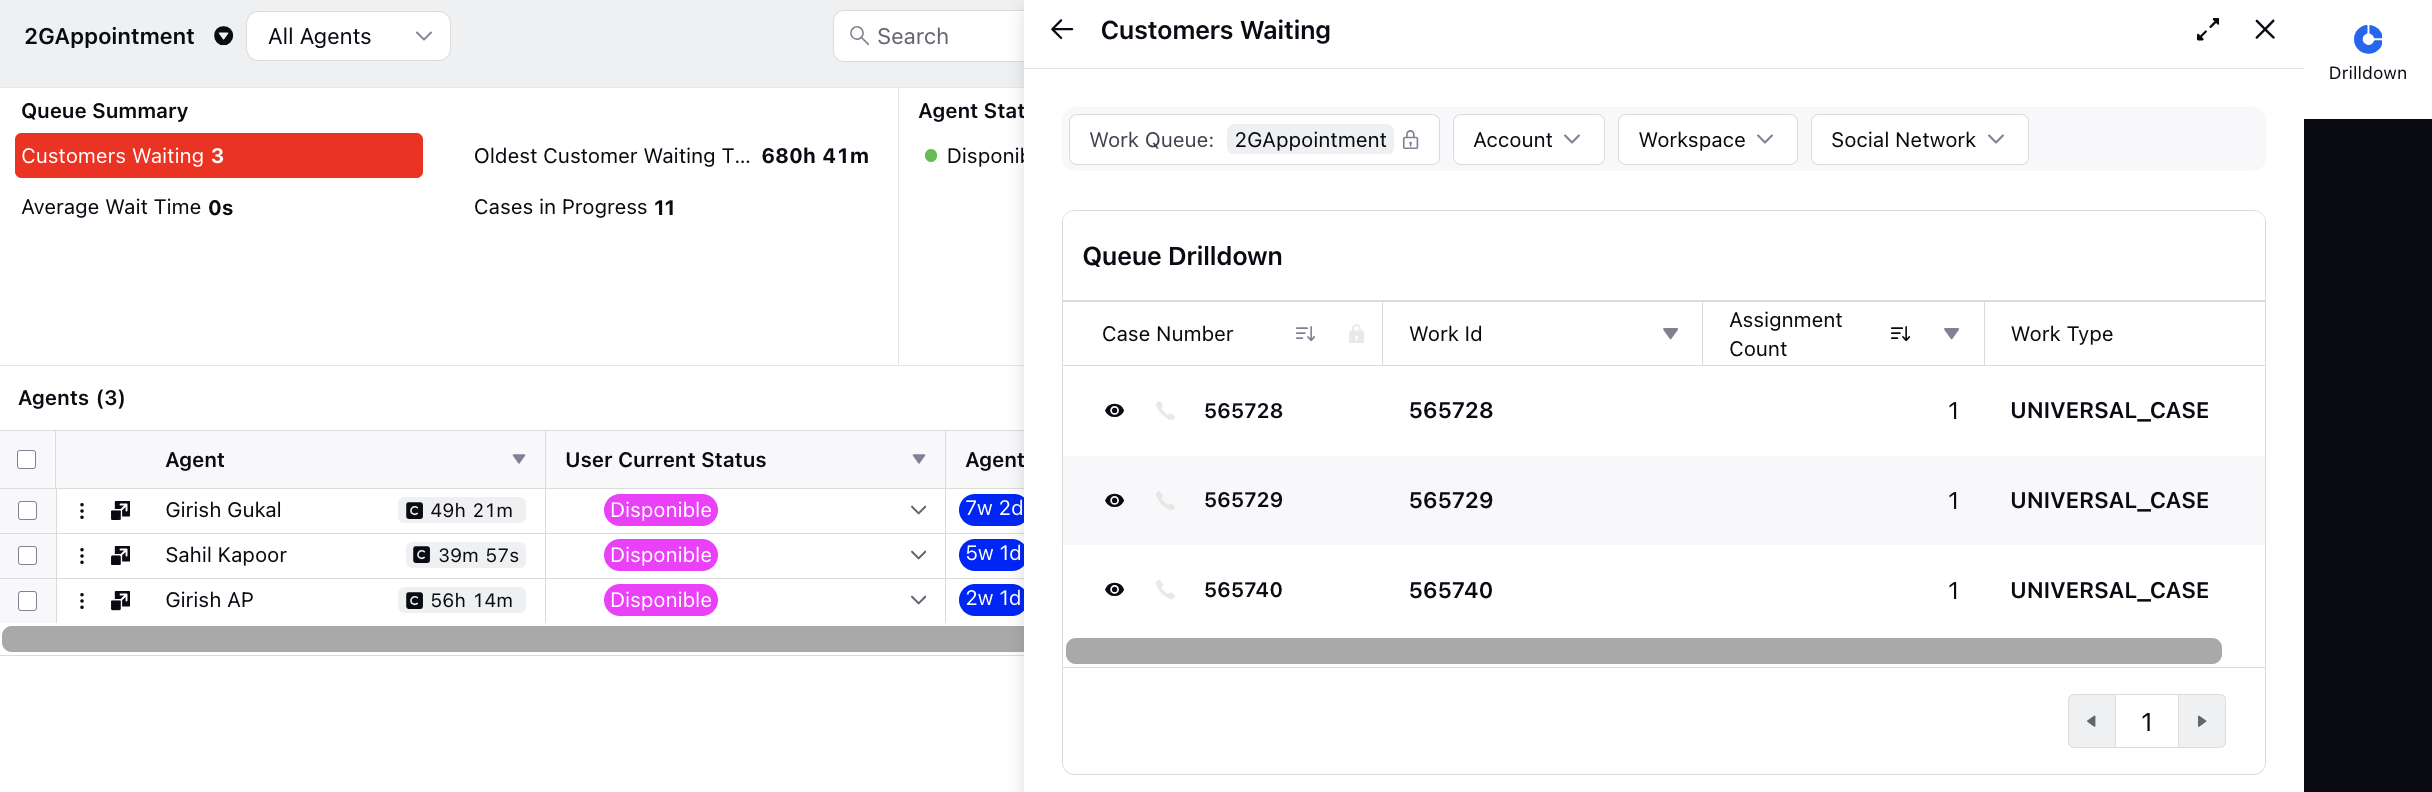
Once you have created lenses, you can map them to Queue Summary Metrics in the Persona App Manager. This allows you to associate specific lenses with the metrics displayed in the Queue Summary, providing tailored insights and analytics for your queues.
.png "image (16).png")
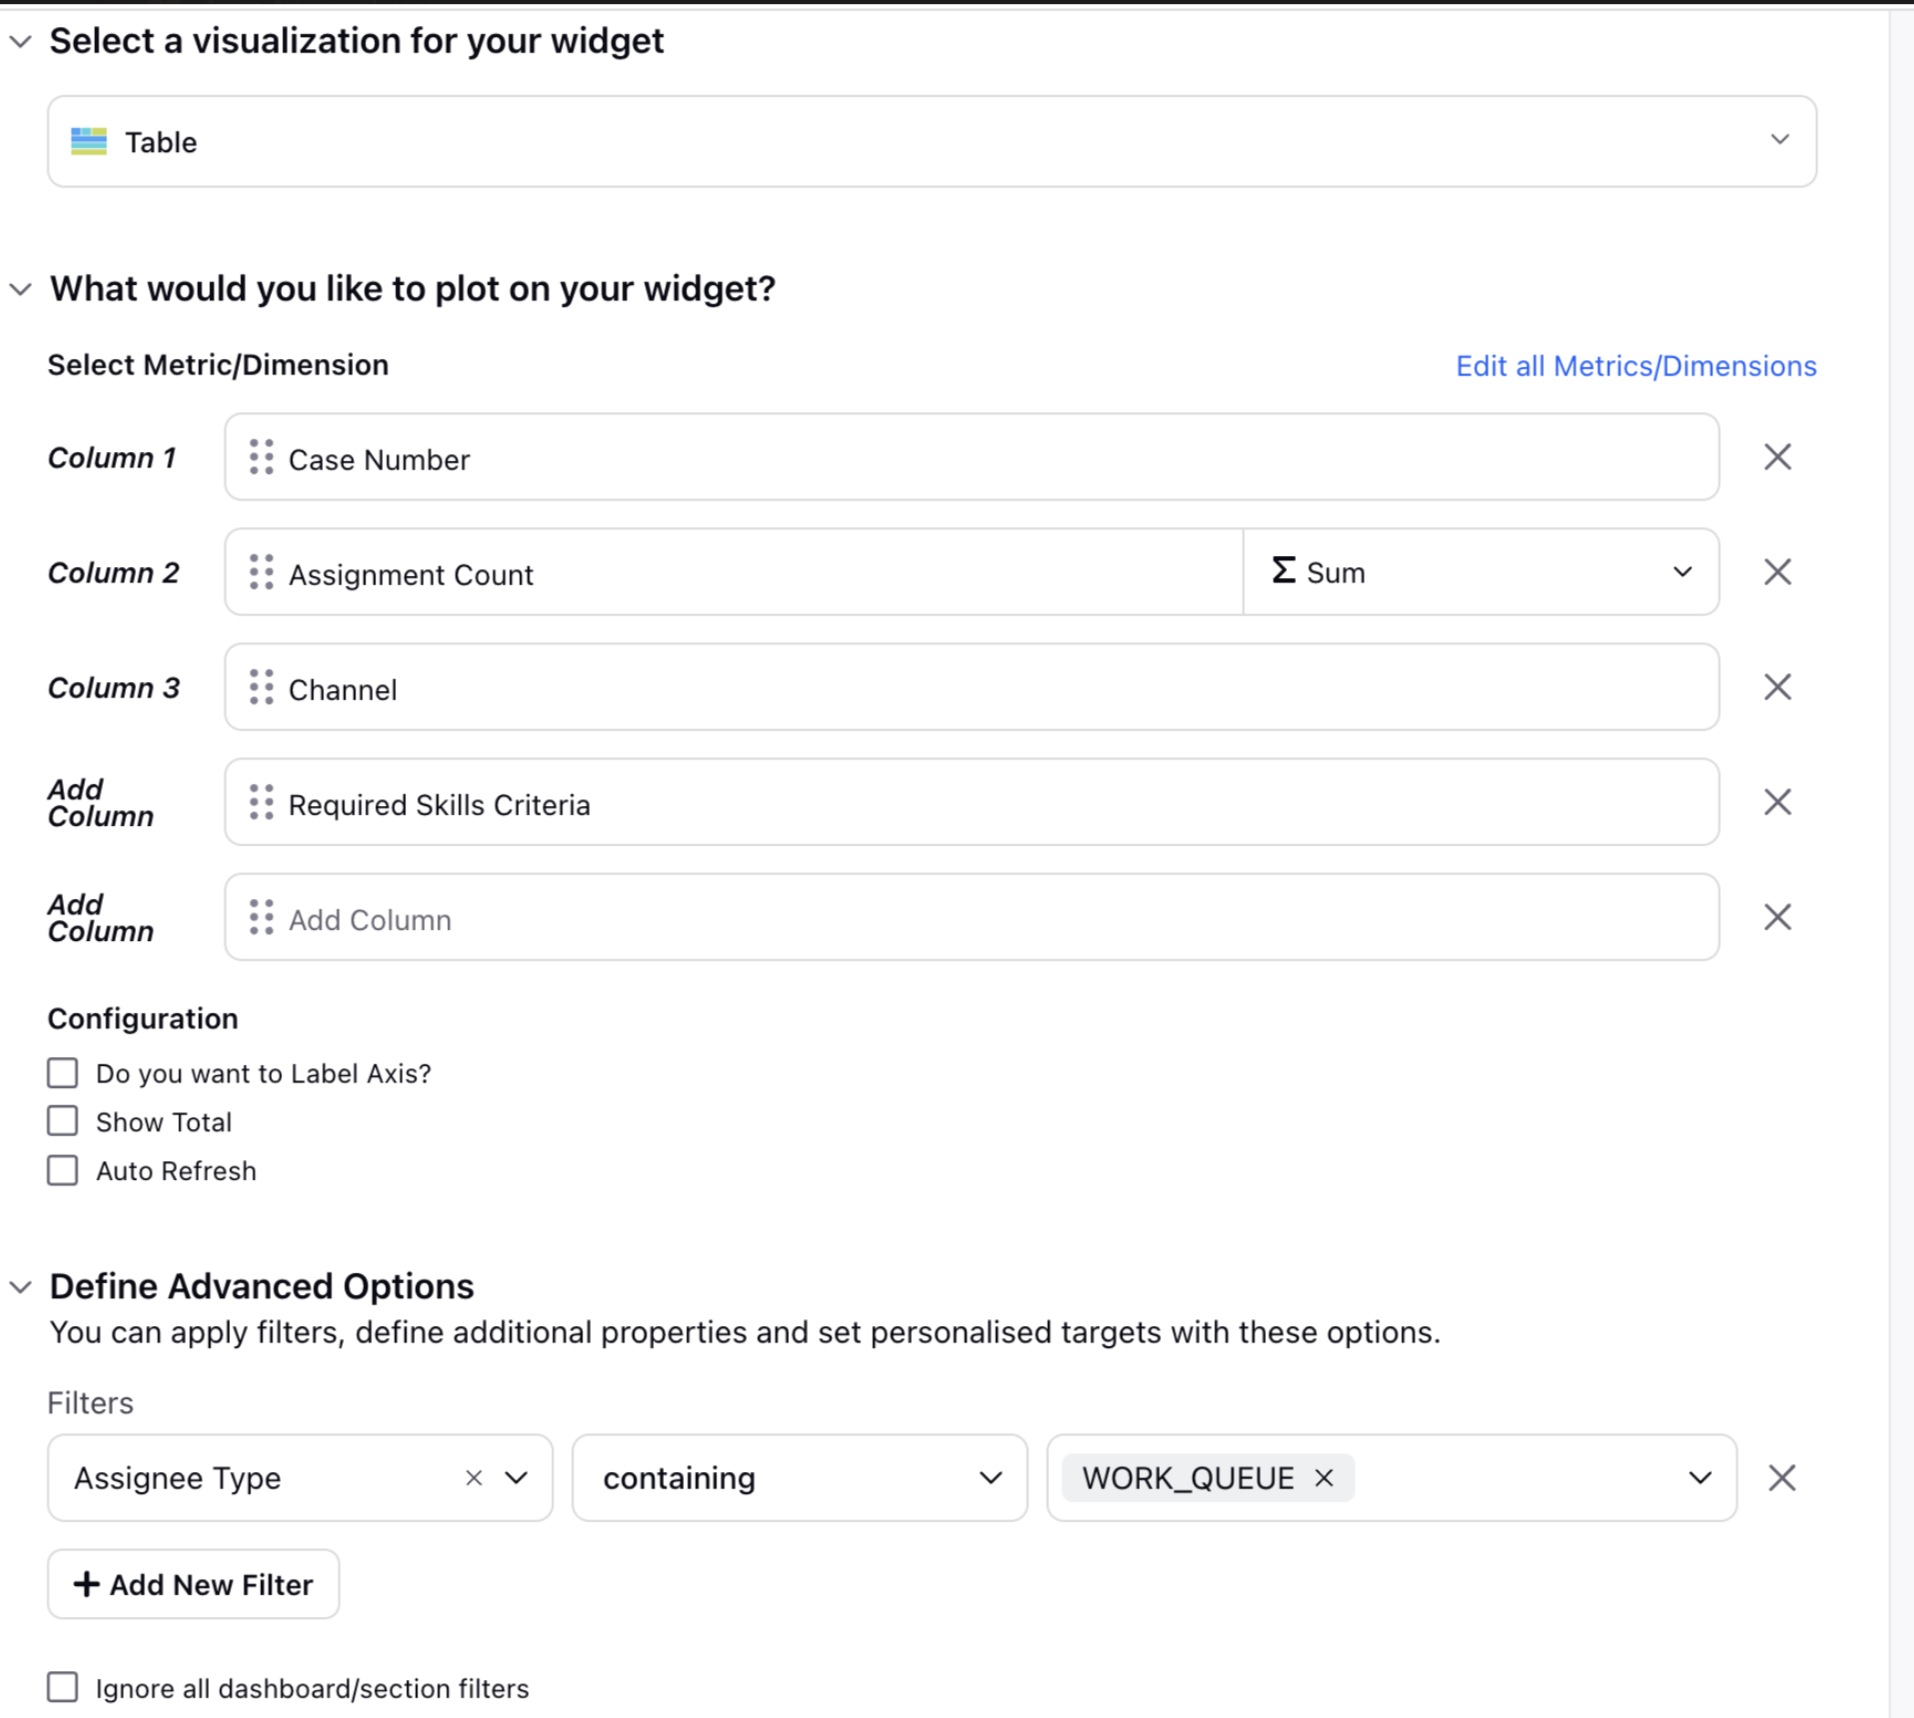
For drilldown on Customers Waiting metric, please plot below widget (with Data Source as Social Analytics) with Filter (as mentioned in image below) and keep the Widget Time filter as Lifetime.
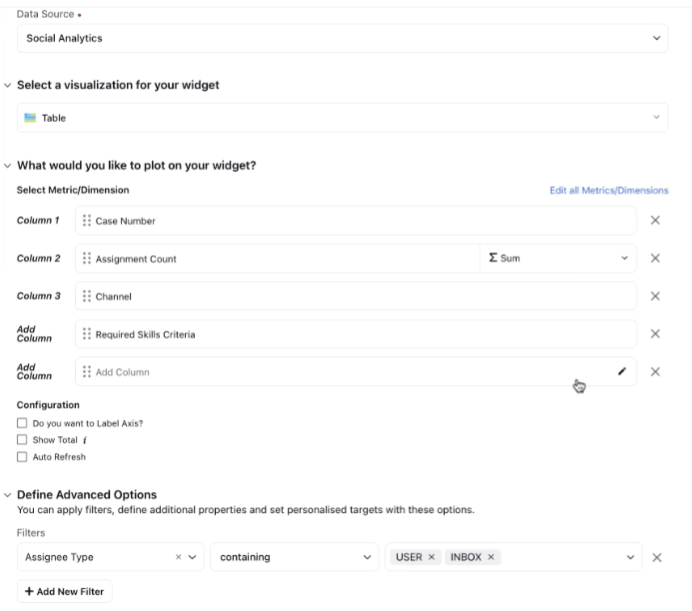
For drilldown on Cases In Progress metric, please plot below widget with Filter (as mentioned in image below) and keep the Widget Time filter as Lifetime.
Configure Queue Dimensions and Metrics
Admins can customize the dimensions and metrics displayed on the Queue Monitoring screen by configuring them in the Persona App Manager. These selected values will appear as columns on the Queue Monitoring screen.
To configure the dimensions for the Queue Monitoring screen, follow these steps:
1. Open an existing persona app for editing. Or, create a new persona app.
2. In the Menu Item Group, click Queue Monitoring.
This will open the Queue Monitoring configurator panel.

Certain dimensions and metrics are pre-selected (selected by default) and cannot be removed.

3. From the Select Dimensions and Select Metrics dropdowns, choose any additional items you want to display on the Queue Monitoring screen.
![]() Note: To ensure that only the pre-selected and additional chosen columns are displayed on the Queue Monitoring screen, you must select at least one dimension and one metric from the respective dropdowns.
Note: To ensure that only the pre-selected and additional chosen columns are displayed on the Queue Monitoring screen, you must select at least one dimension and one metric from the respective dropdowns.

4. Click Update. Then, click Publish to apply the changes and make them available to the users.
Configure Metrics
The Queue Summary section on the Queue Monitoring screen displays an aggregated view of key performance metrics. You can customize which metrics appear in this section by adding or removing them through the Persona App Manager.
To configure the metrics for Queue Summary section, follow these steps:
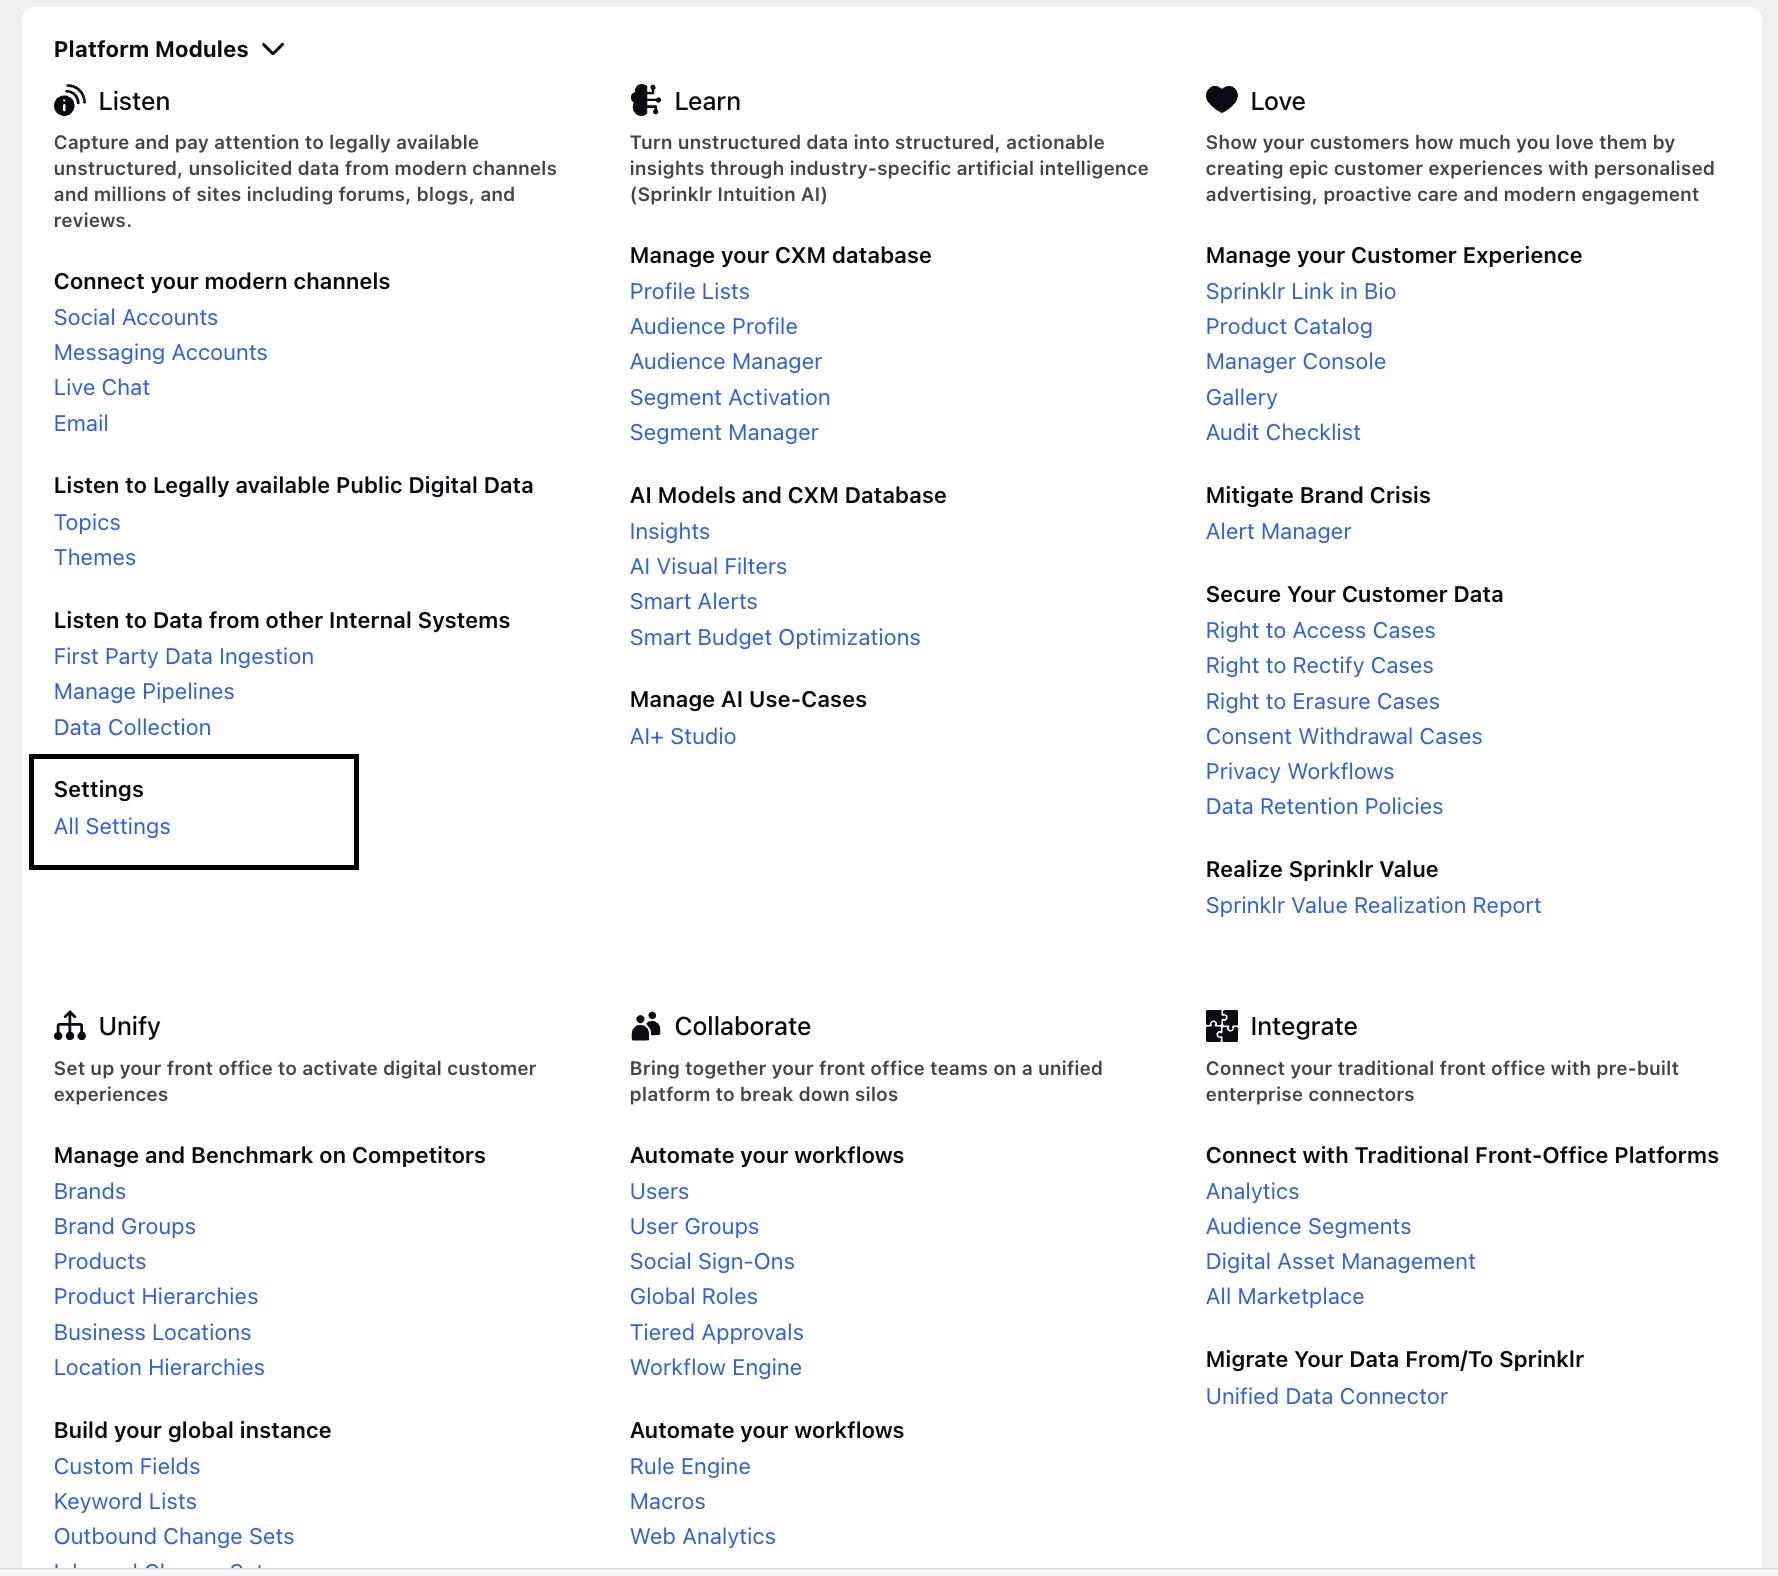
1. Click the New Page (+) icon to open the Launchpad.
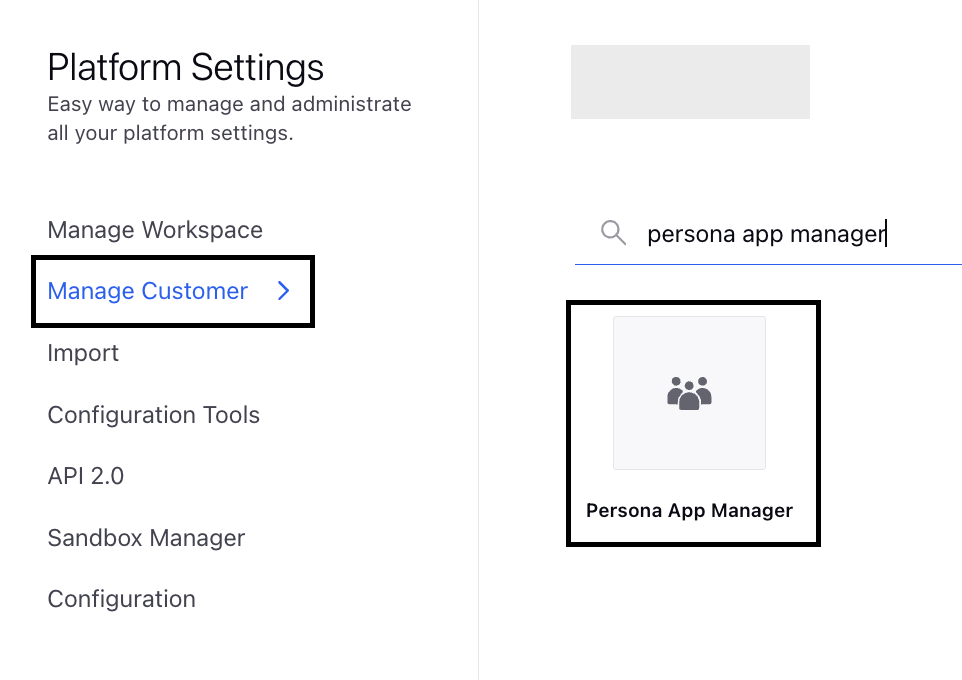
2. On the Launchpad, under Platform Modules, click All Settings.
3. In All Settings, go to Manage Customer and search for Persona App Manager.
4. In Persona App Manager, find the Supervisor Console persona app you want to edit.
5. Click the three-dot icon next to the app name and select Edit from the menu.

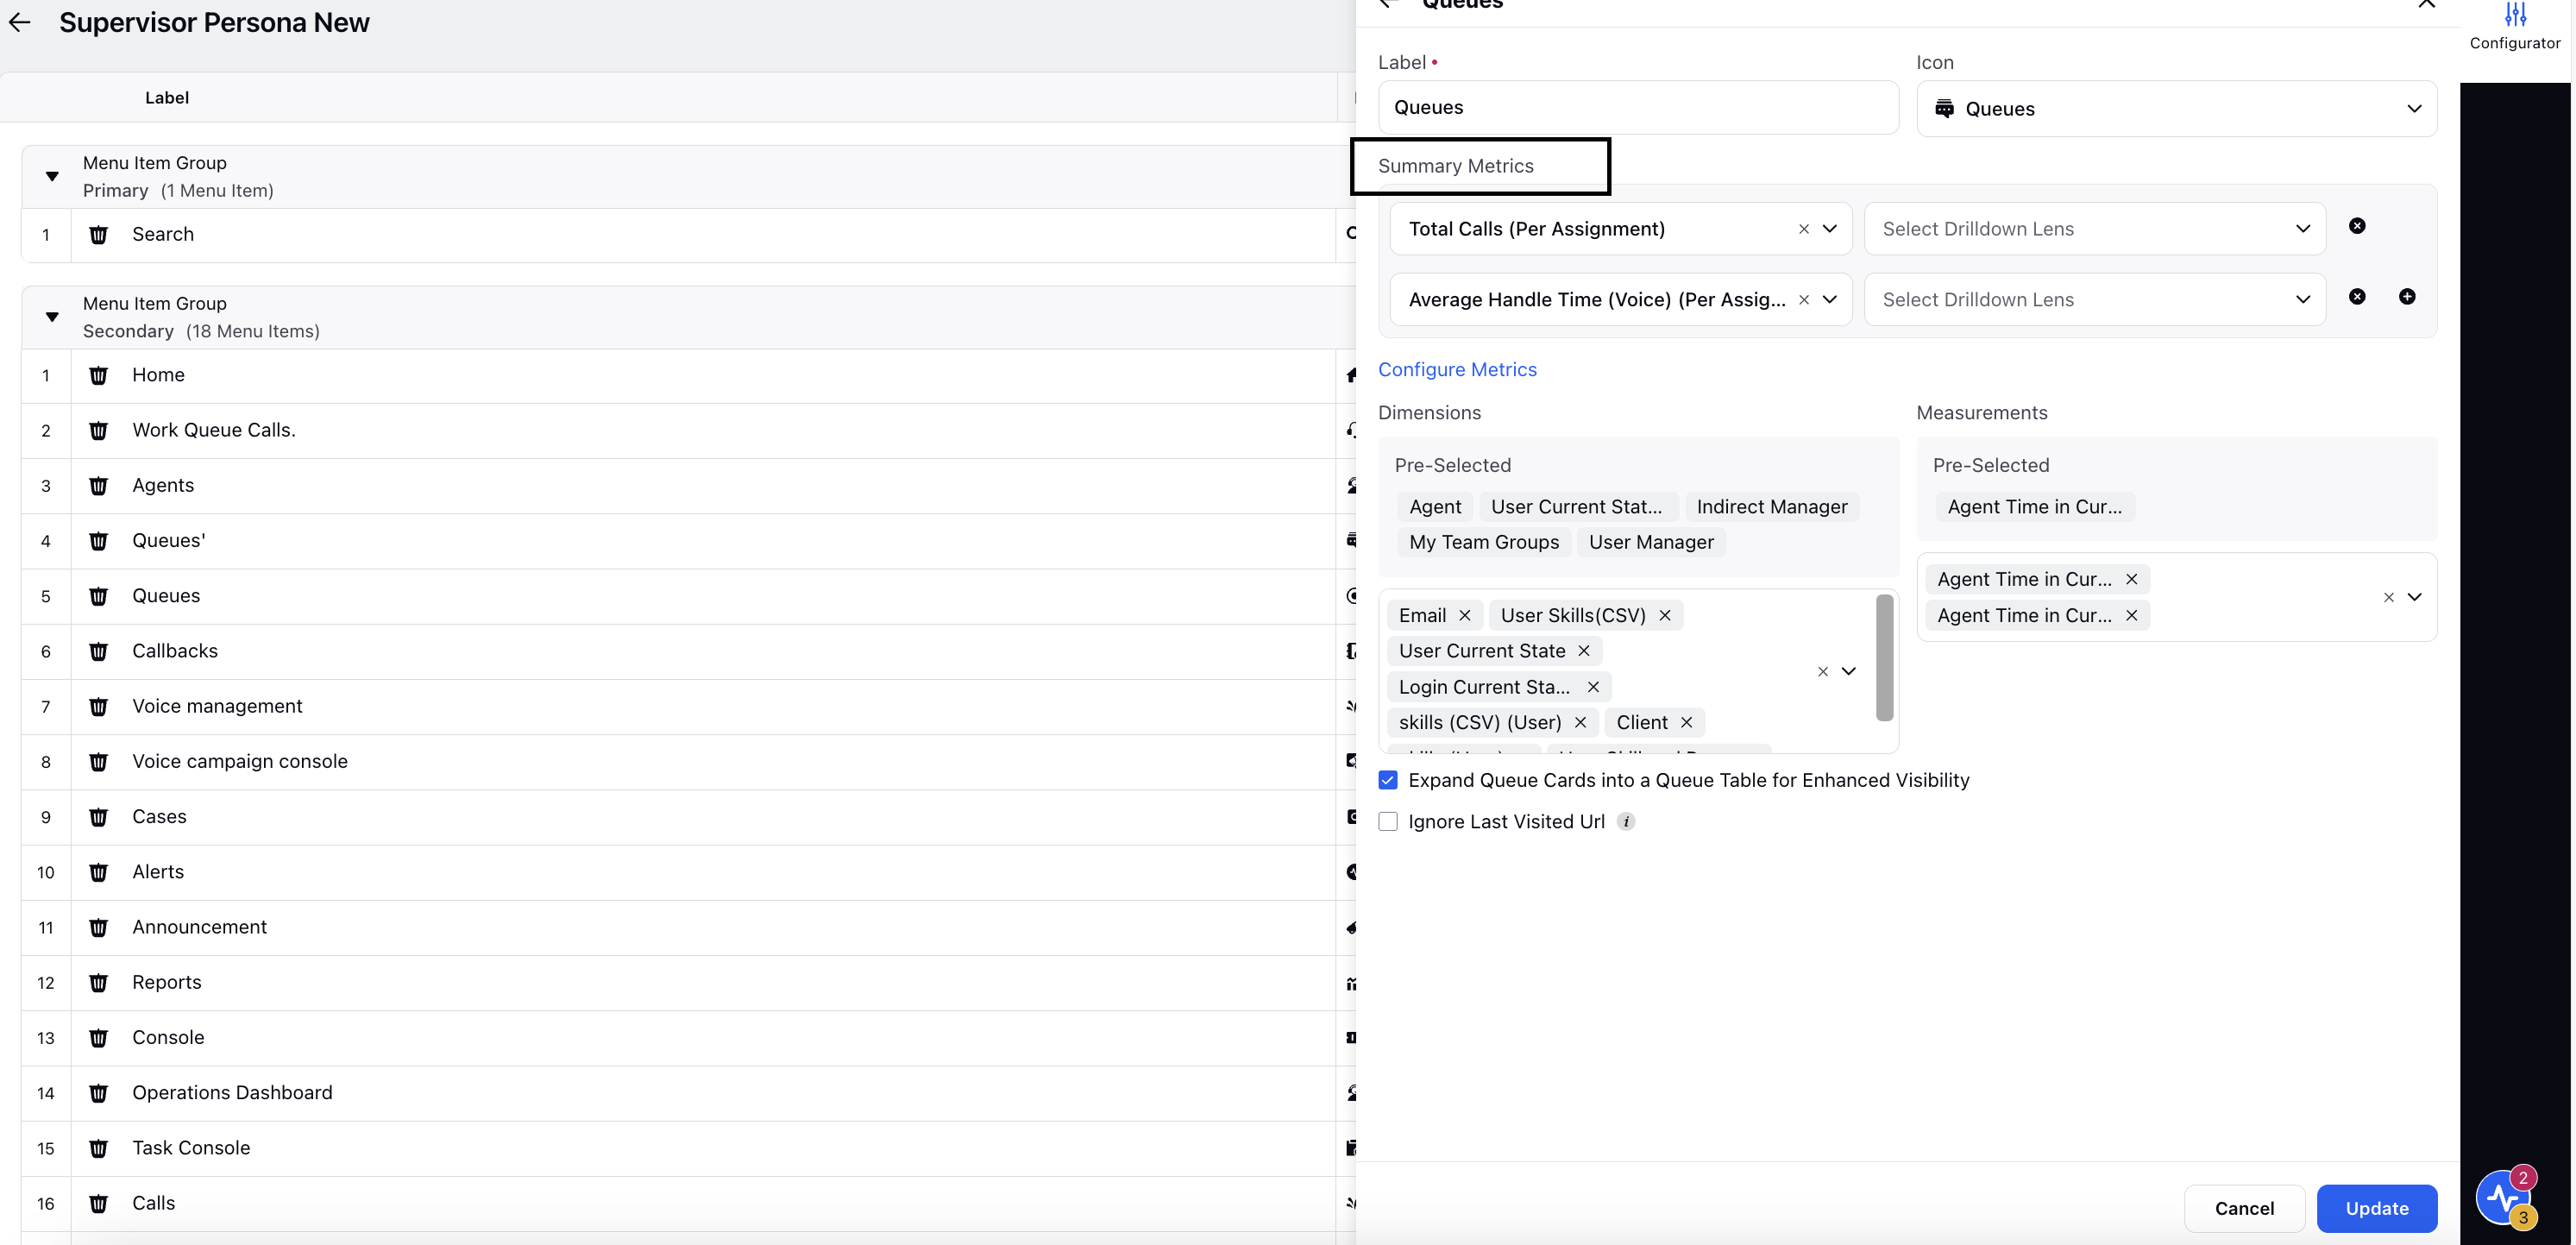
6. On the editing screen, click the Queues menu item to open the third pane.
7. In the Summary Metrics section, select the metric that you want to add to the Queue Summary section. To add more metrics, click the + icon and select additional metrics.
8. To select metrics from a report, click Configure Metrics to open the Queue Metrics screen.
.png)
9. On the Queues Metrics screen, select the metrics from the Assignment Report and Current Assignment Report. Use the + icon to add more if needed.
.png)
10. Once all metrics are selected, click Save. You are taken to the Queues editing screen.
11. On the Queues editing screen, click Update, then Publish to apply changes.