How to See Google Analytics Insights in Ads Reporting & Ads Manager
Updated
You can use a specific set of metrics to create Ads Reporting widgets that combine Google Analytics data with your web and social ad performance data.
You can also see how web activity is driven by different ads, accounts, or channels.
GA metrics can also be used within Custom Metrics. For example, Cost Per GA Page Views = (Spent / GA Page Views). Use Currency as the metric type.
How To Use GA Metrics in Ads Reporting ?
Click the New Tab icon
. Under the Sprinklr Marketing (Ads) tab, click Ads Reporting within Analyze.
On the Ads Reporting window, click Add Widget in the top right corner. For more information see Add Widget to the Reporting Dashboard.
On the Widget Editor window, click Bulk add Metrics/Dimensions within What would you like to plot on your widget? section.
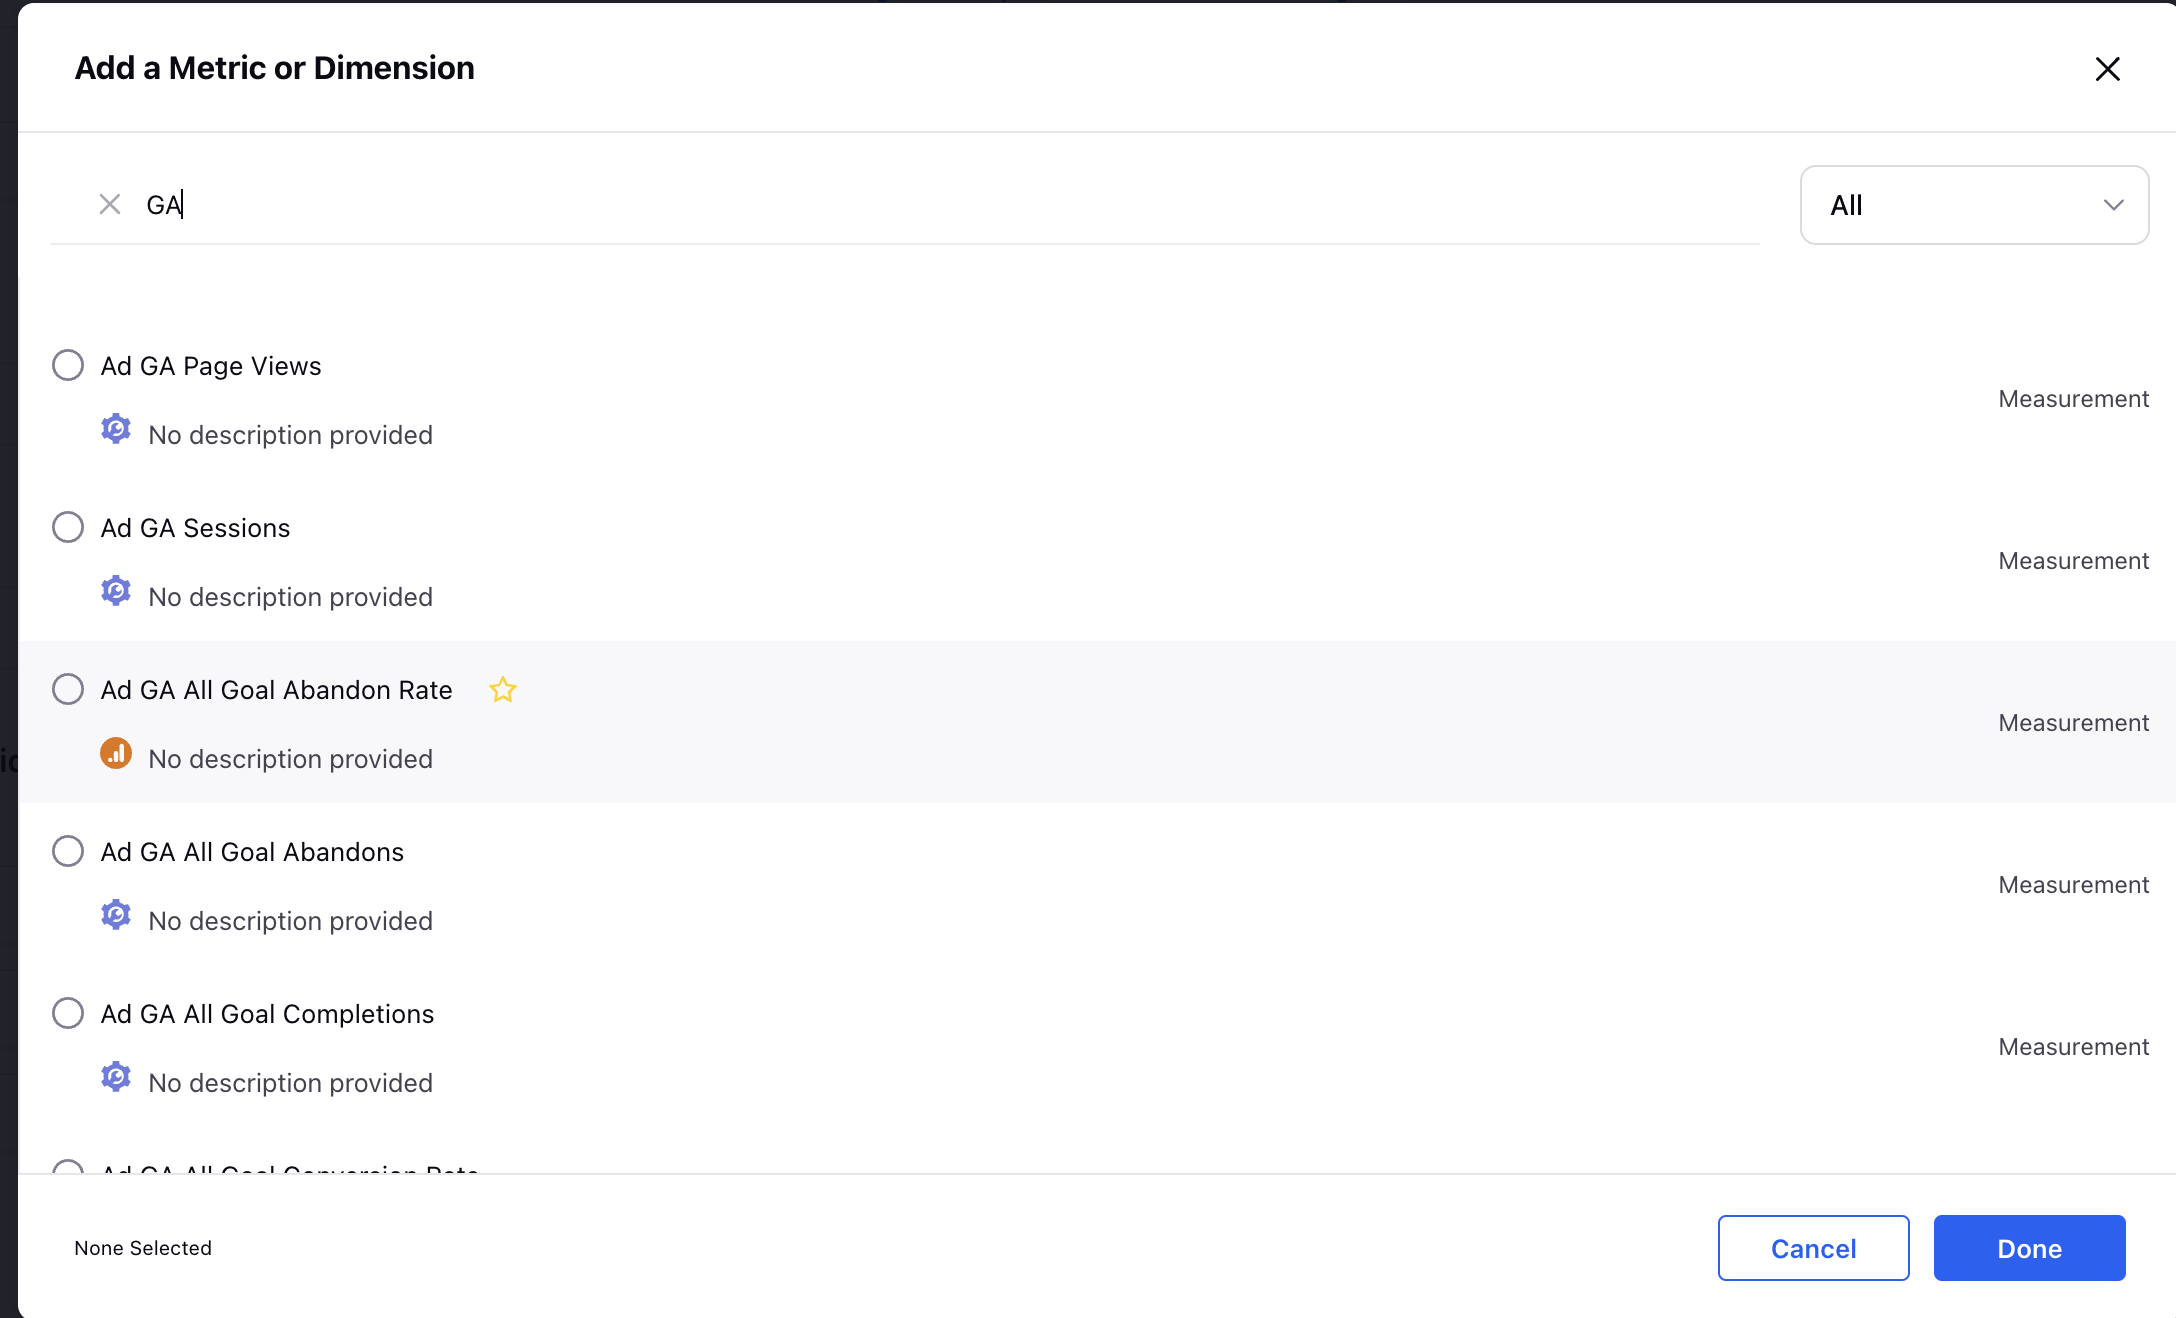
On the Select all Metrics and Dimensions window, select the desired GA dimension(s) and metric(s) to plot against any other dimension/metric. Once selected, click Done in the bottom right corner.
5.Click Add to Dashboard in the bottom right corner to add your widget to the dashboard. You will be navigated to the widget within. the respective dashboard.
Examples of Custom Reporting Widgets:
Web & Social Performance Overview: This non-standard dashboard is configured using combined sessions and page view counts. The sessions and page view data are further broken down by social accounts to display the web and social performance. Compare each social network’s ability to drive engagement on your website.
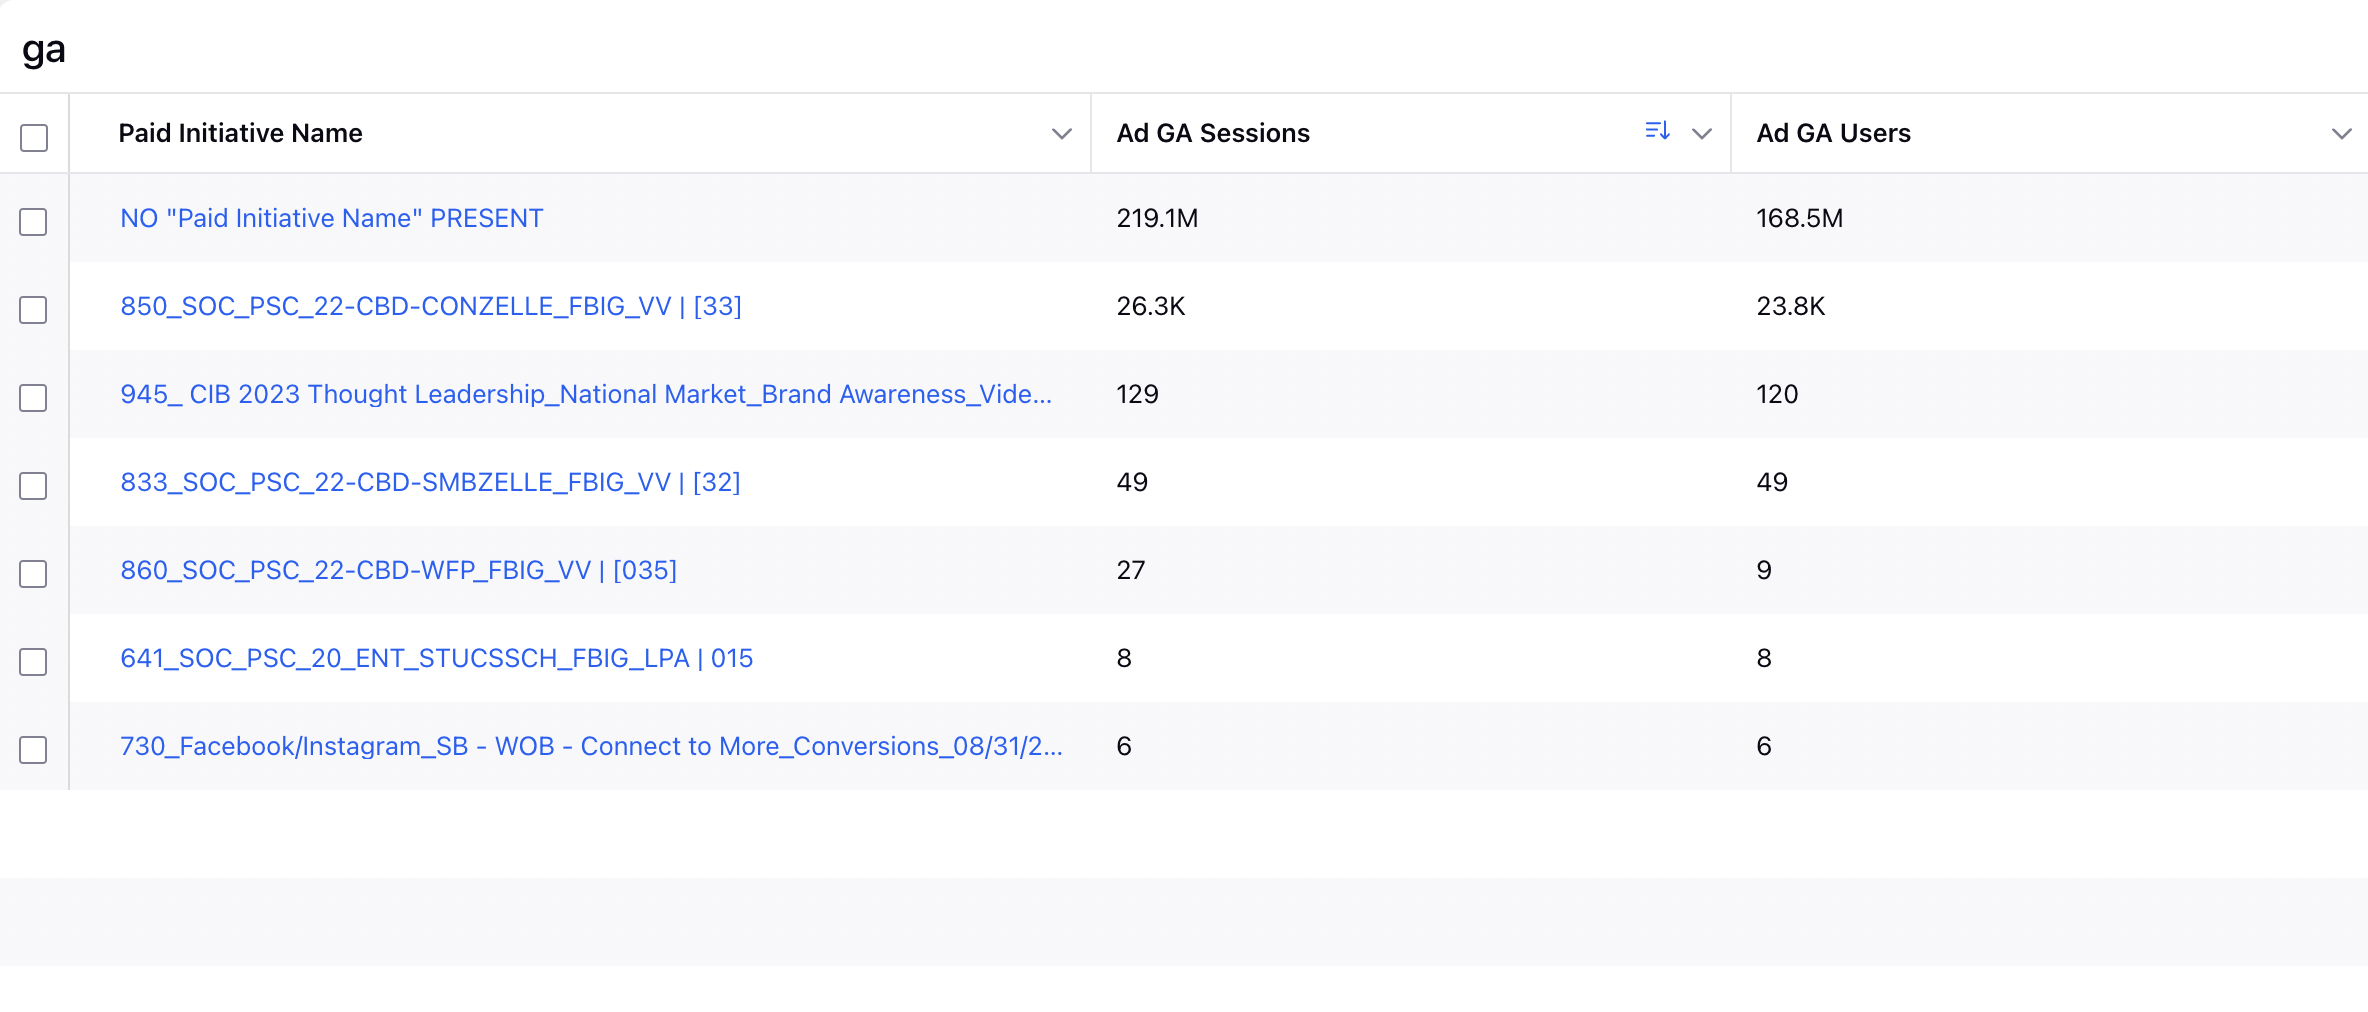
Attribute Web Activity and Goals to Ad Posts: This widget uses Google Analytics metrics to show the Sessions, Page Views, and Goal Completions of individual ads. Measure which one of your Accounts is converting social engagements into web conversions.
Correlate Social Efforts to Website Traffic: This widget shows the number of Sessions compared to the volume of published messages, allowing you to plot trends of published messages on website Sessions to help visually correlate their relationship.
Additionally, to streamline campaign optimizations, you can add Google Analytics metrics within Customized Columns in Ads Manager.
How to Use GA Metrics in Ads Manager :-
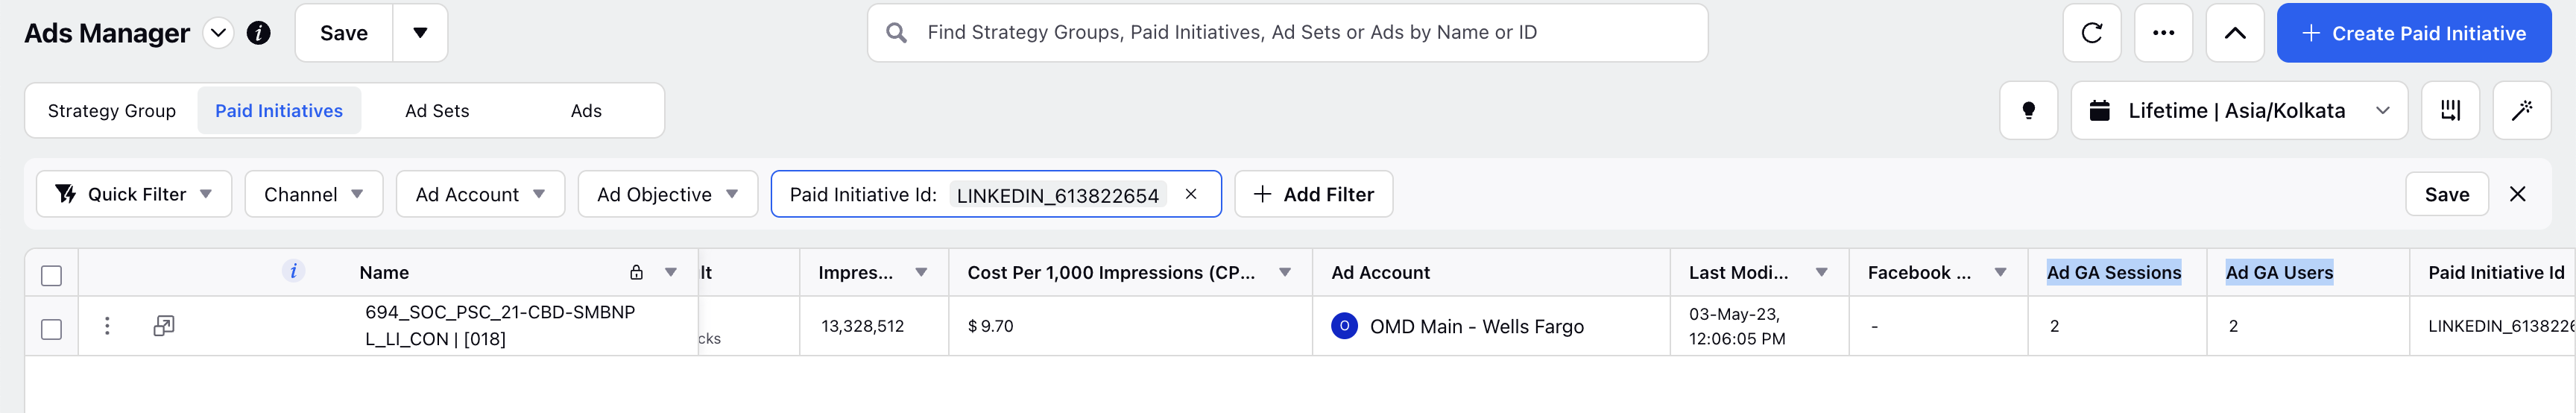
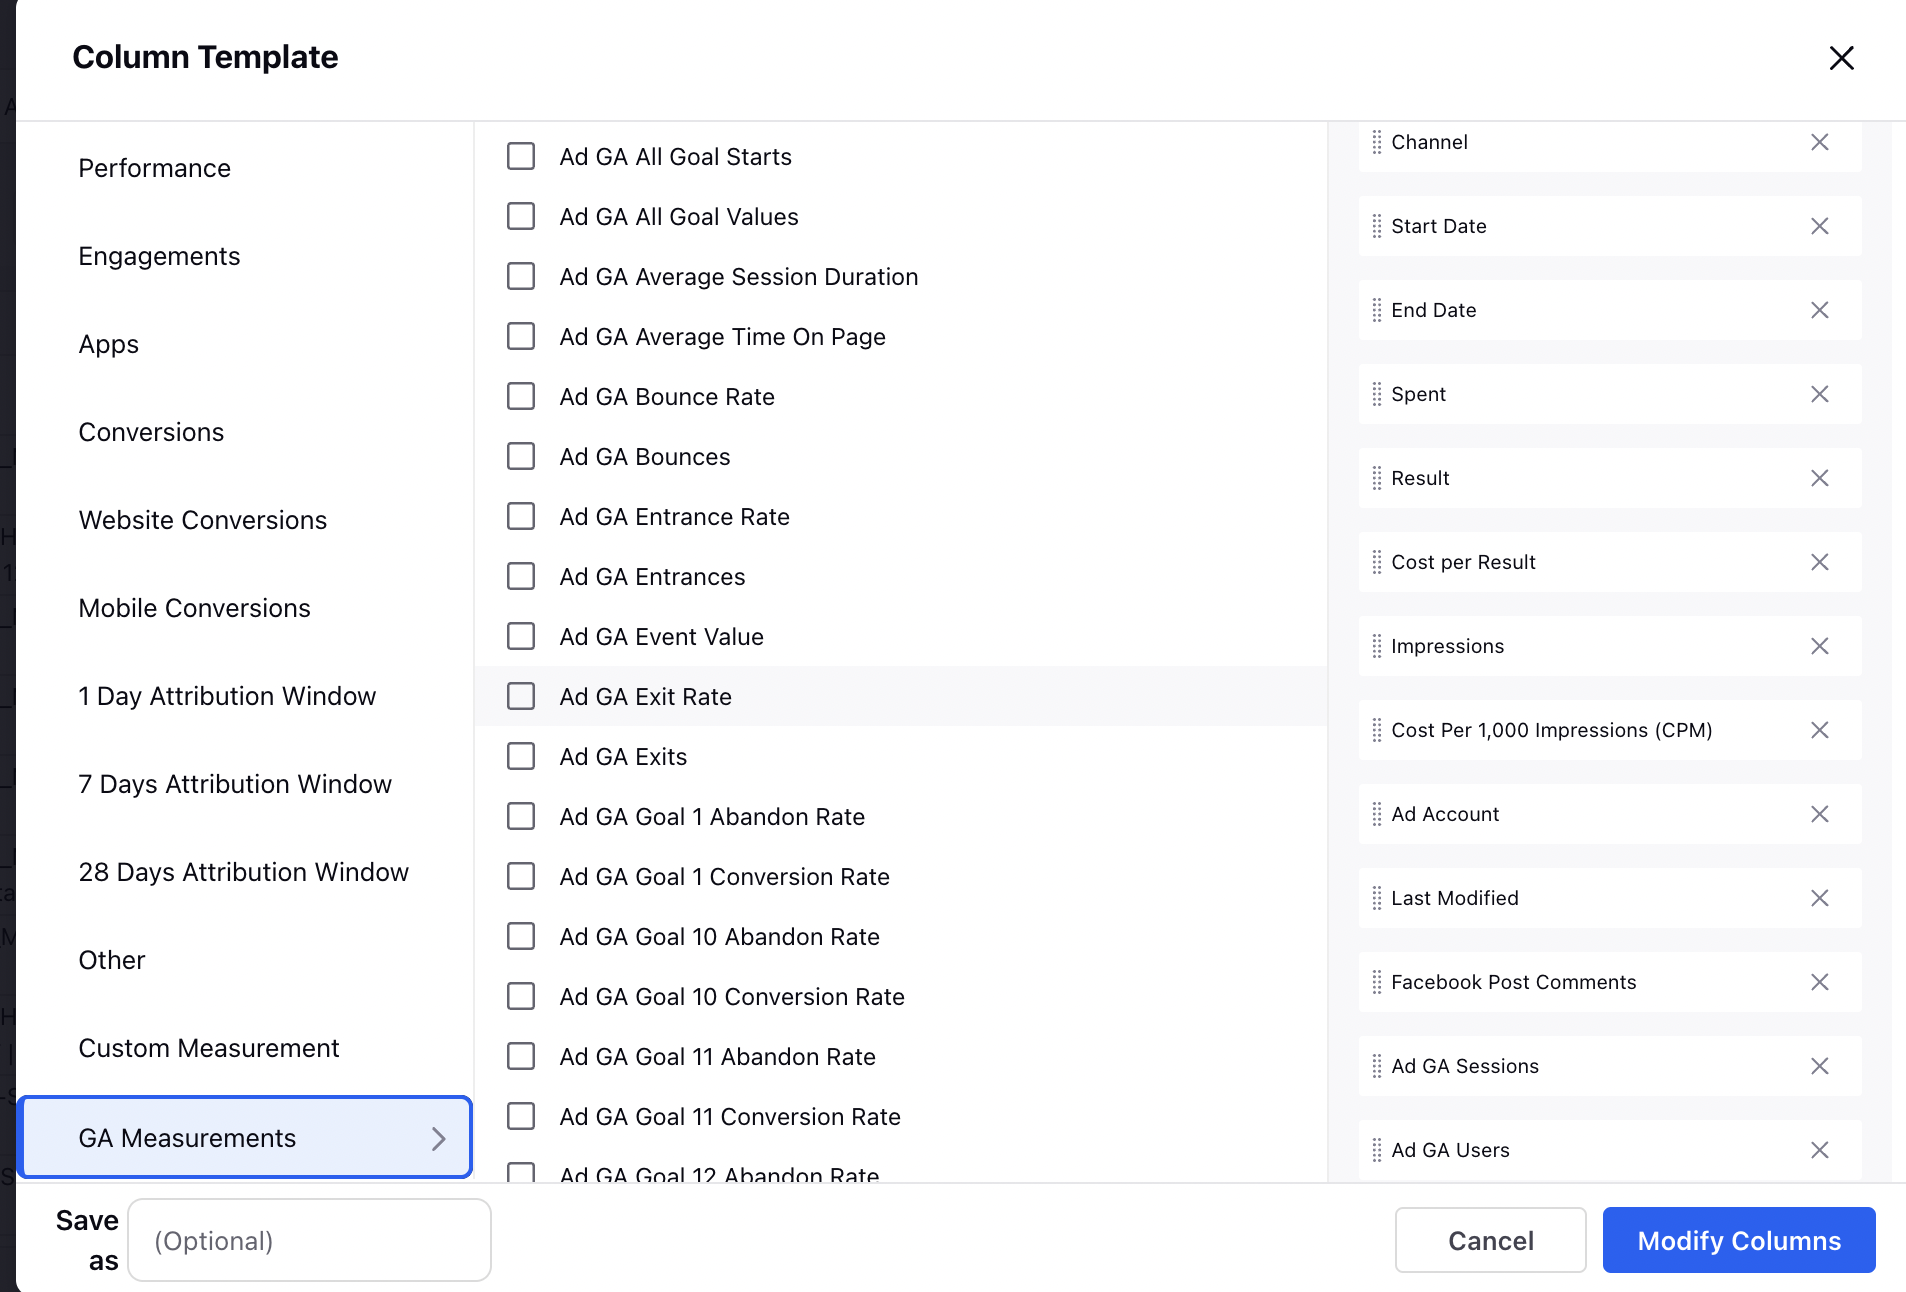
1. All the metrics have the prefix as "GA" in their names, you can add the columns for GA metrics using Column Configuration in ads manager.
2. You can view the Insights for GA metrics along with other metrics like Spent, Impressions etc at Paid Initiative/Adset/Ad Variant level in ads manager.