LINE Ads Reporting Dashboards
Updated
Users can view LINE data by making a custom dashboard or selecting an existing standard dashboard built for easy understanding.
View LINE Insights in Ads Reporting using Custom Dashboard
Click the New Tab icon. Under the Sprinklr Marketing (Ads) tab, select Ads Reporting within Analyze.
Create a reporting dashboard by clicking on Create Dashboard and add the required widgets to start analyzing your campaign data. For more details, refer to How to Create an Ads Dashboard and How to Create a Paid Custom Widget.
![]() Note:
Note:
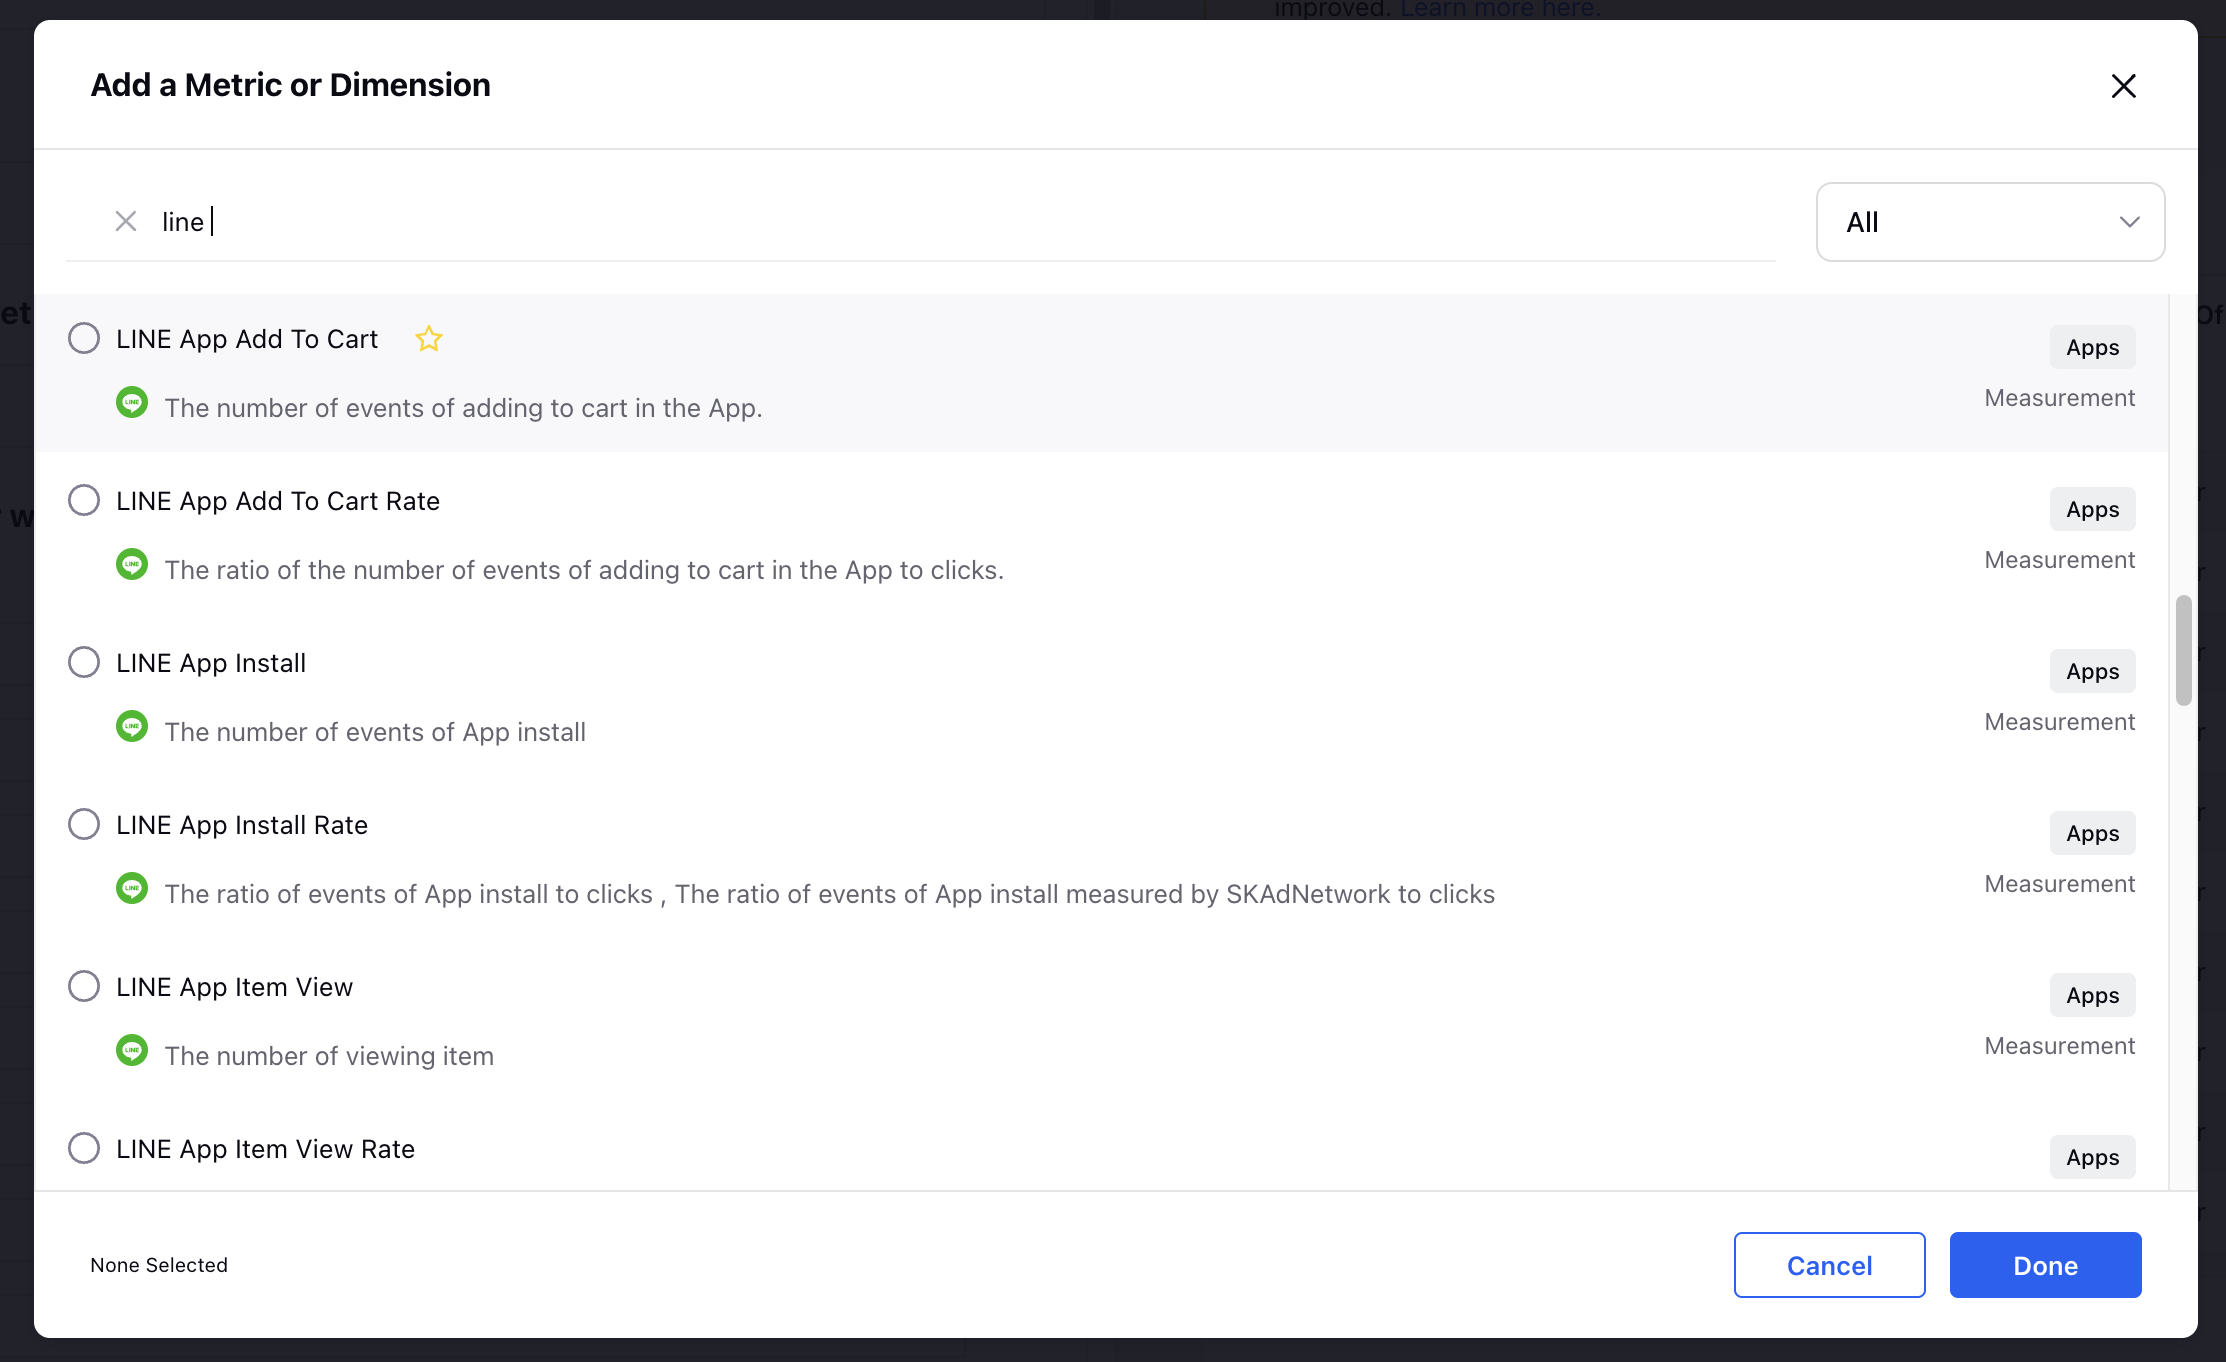
Sprinklr currently supports a specific set of metrics and dimensions using which you can report on your advertising performance.
There are certain constraints with the availability of some metrics and dimensions within a particular period of time.
View LINE Insights in Ads Reporting using Standard Dashboards
Click the New Tab icon. Under the Sprinklr Marketing (Ads) tab, click Ads Reporting within Analyze.
For LINE, we have 4 standard analytics dashboards which you can access by searching for the dashboard on the search bar.
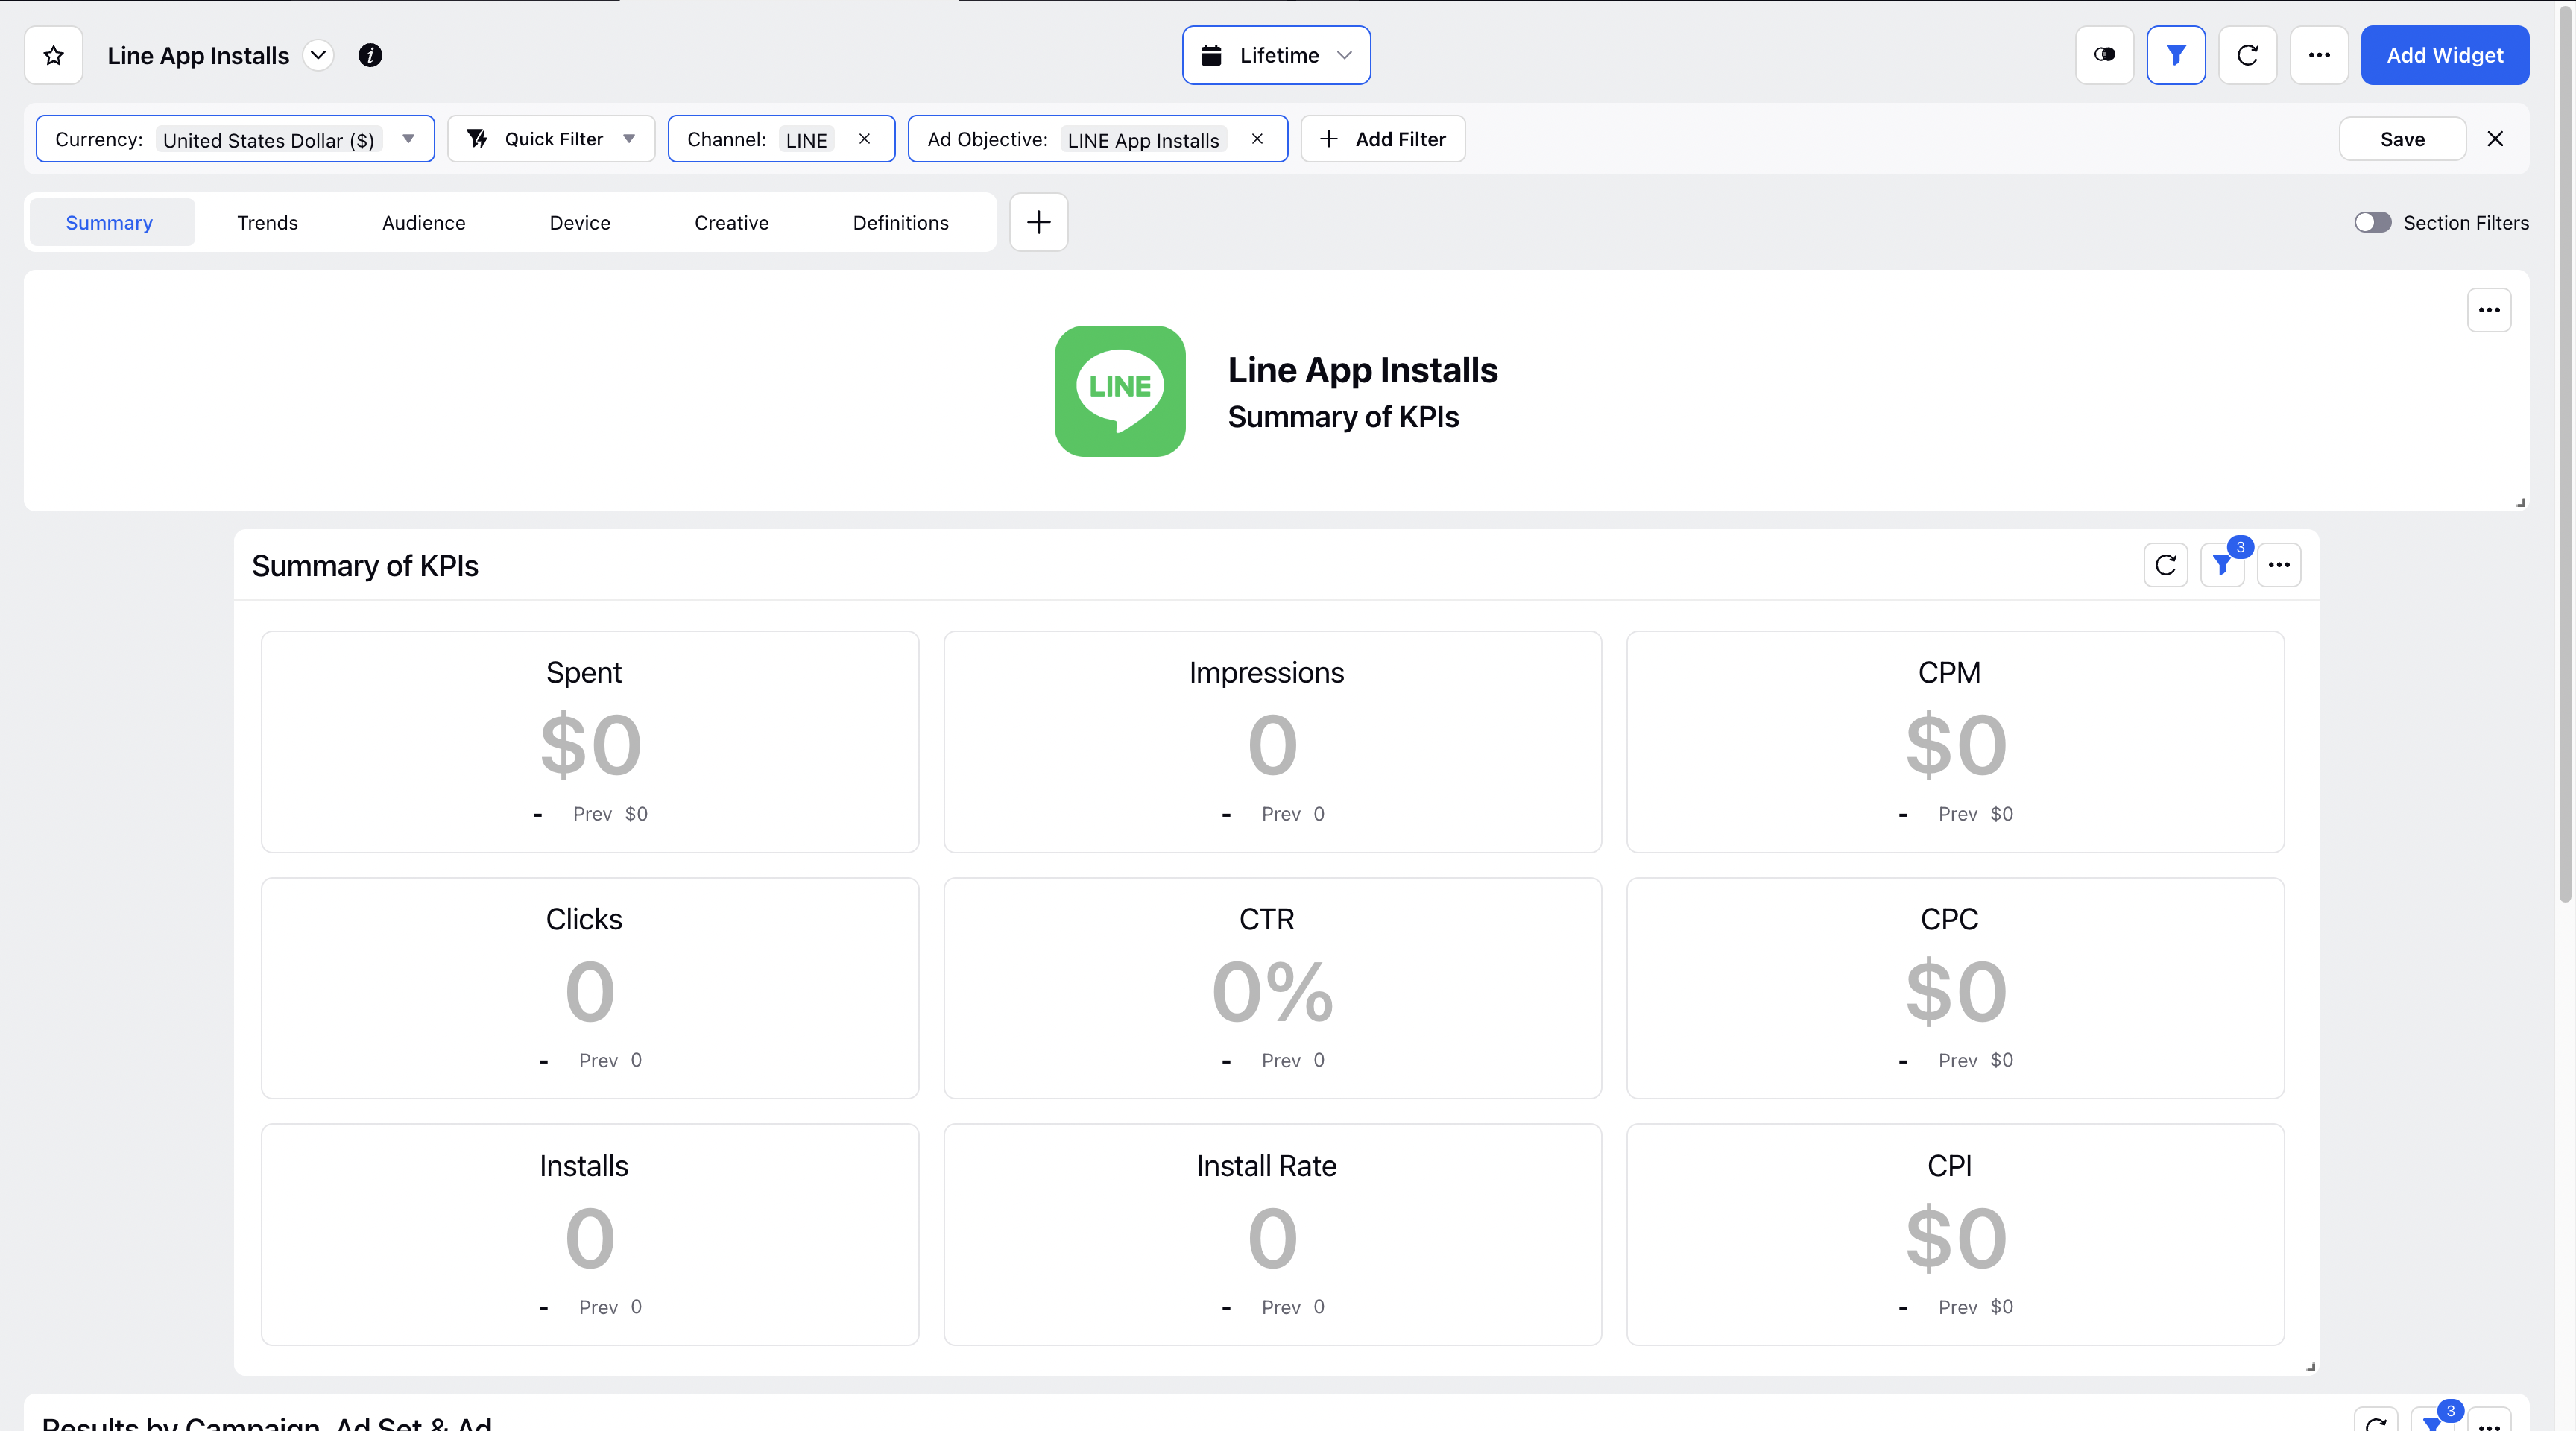
LINE App Installs - To help you understand analytics data for 'App Installs' objective.
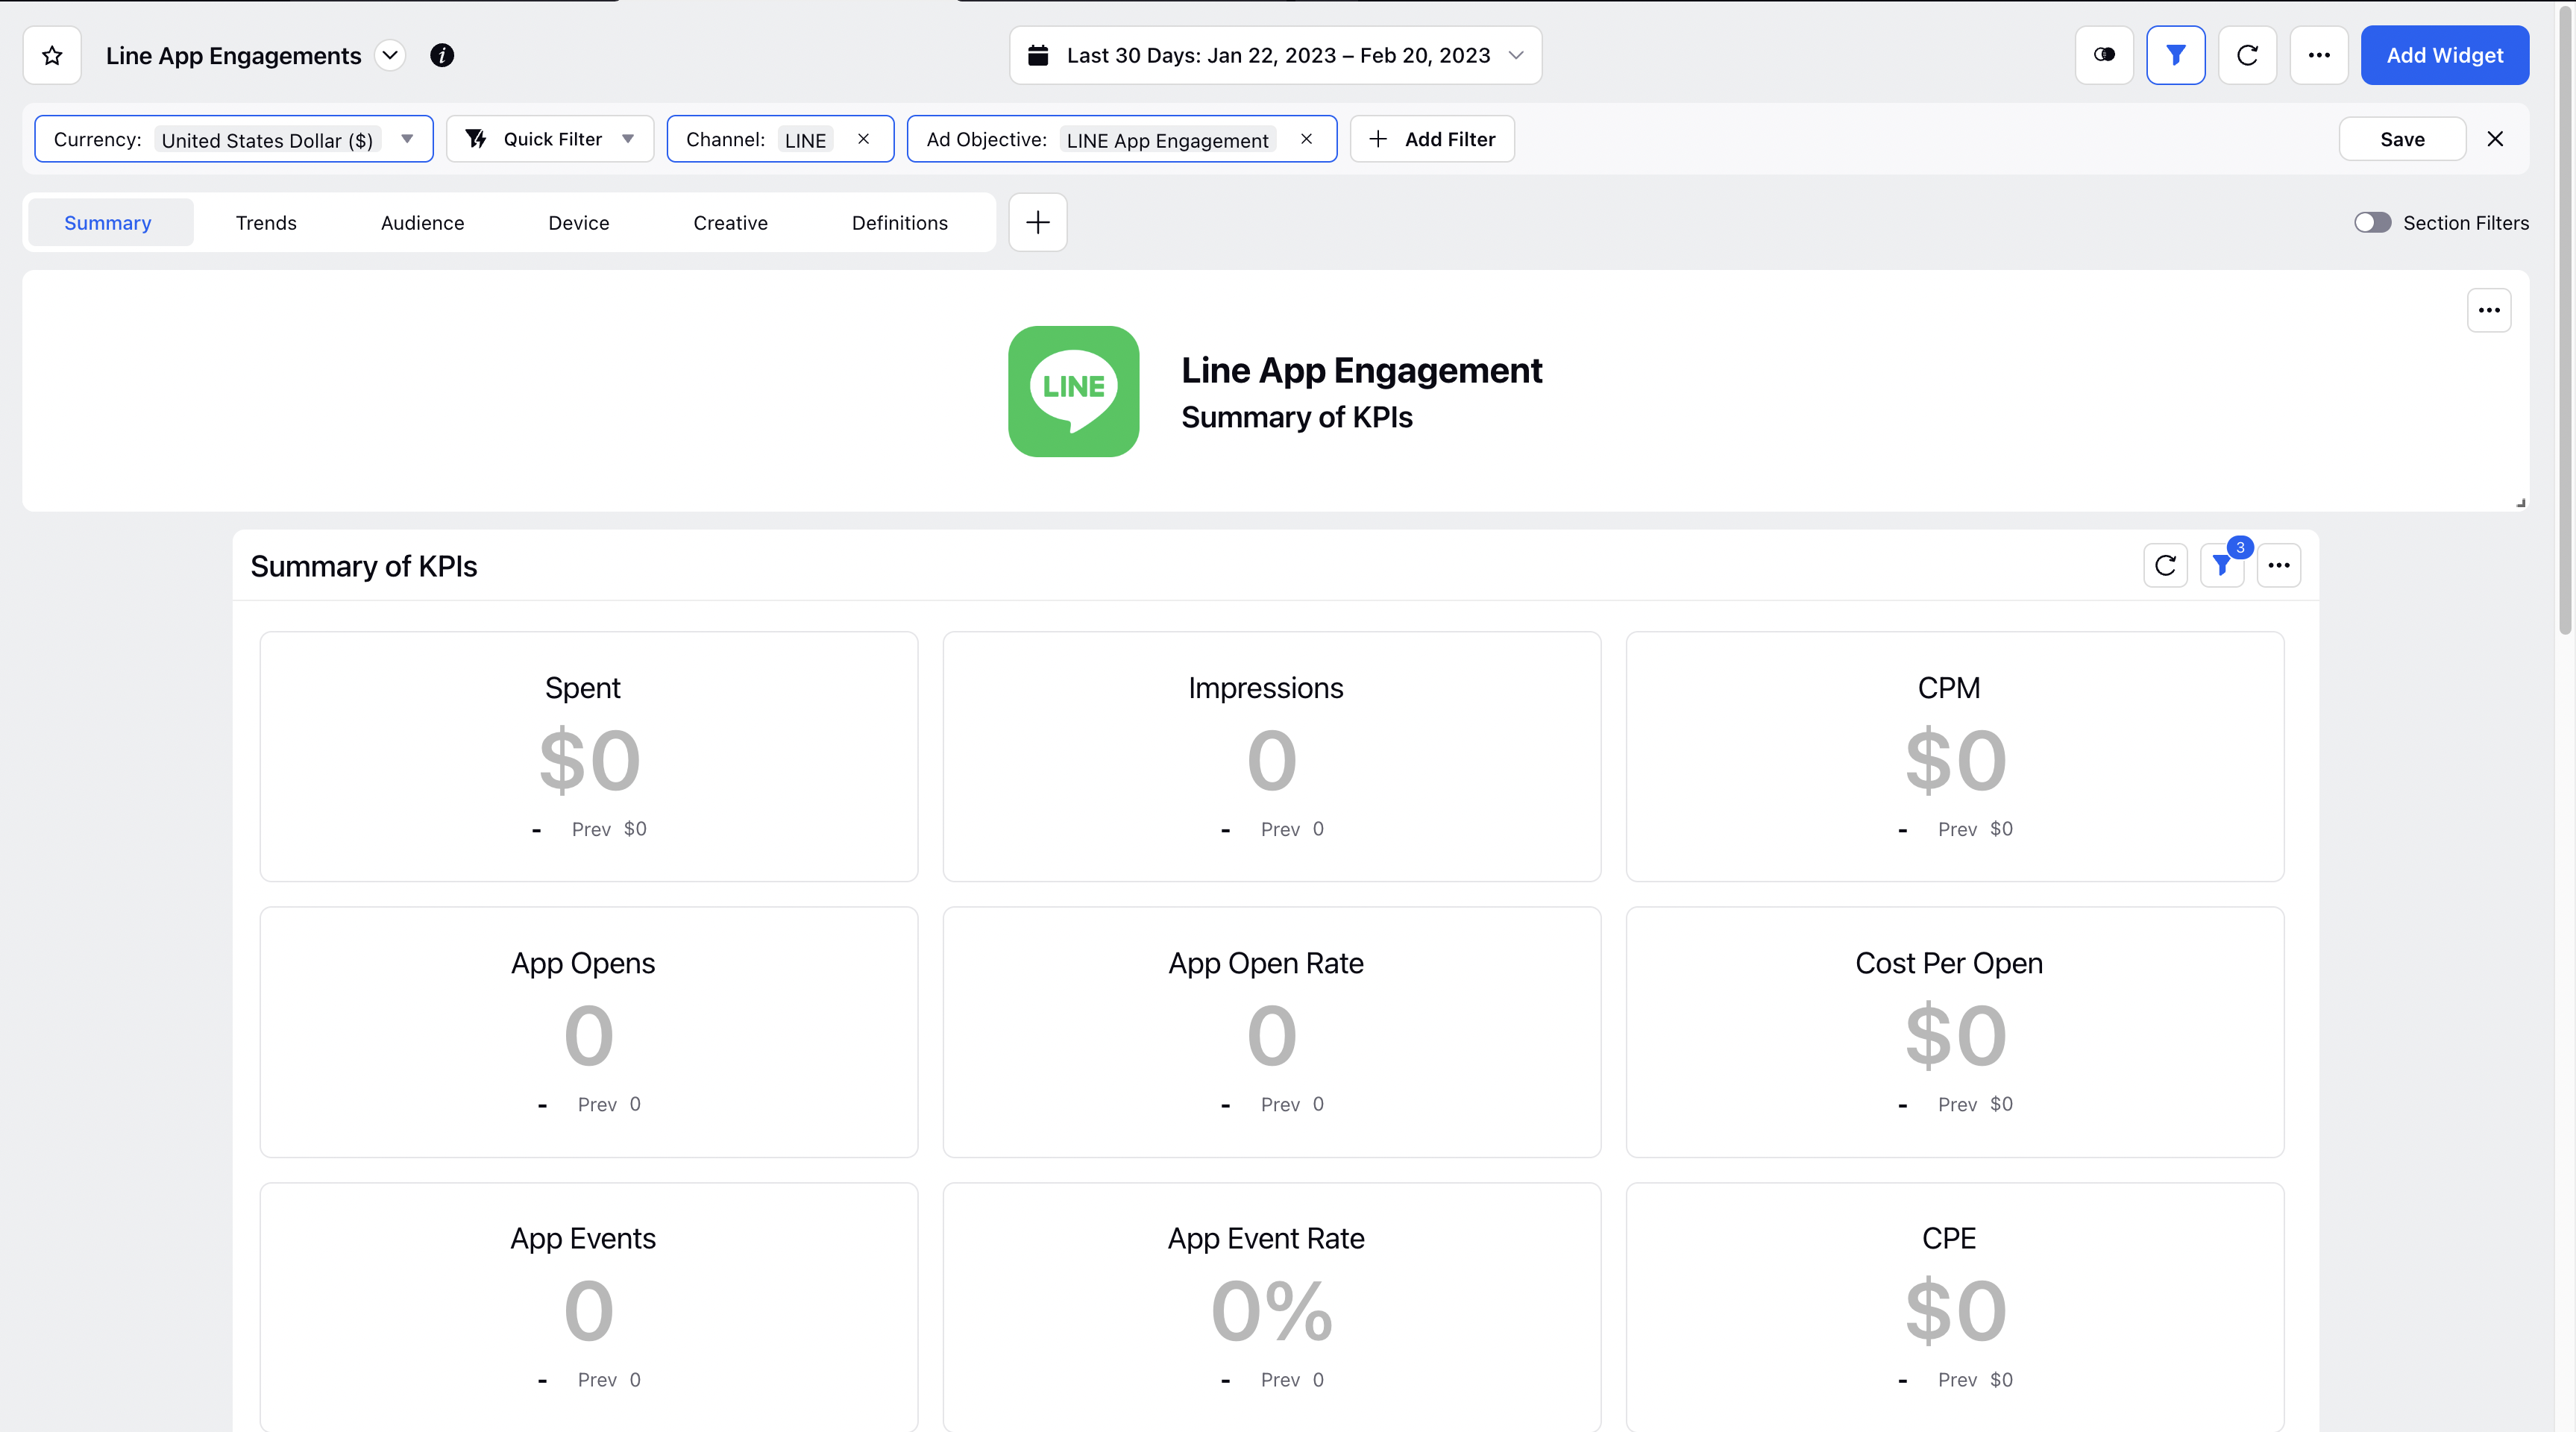
LINE App Engagements - Analytics data for all the 'App Engagements' campaigns.
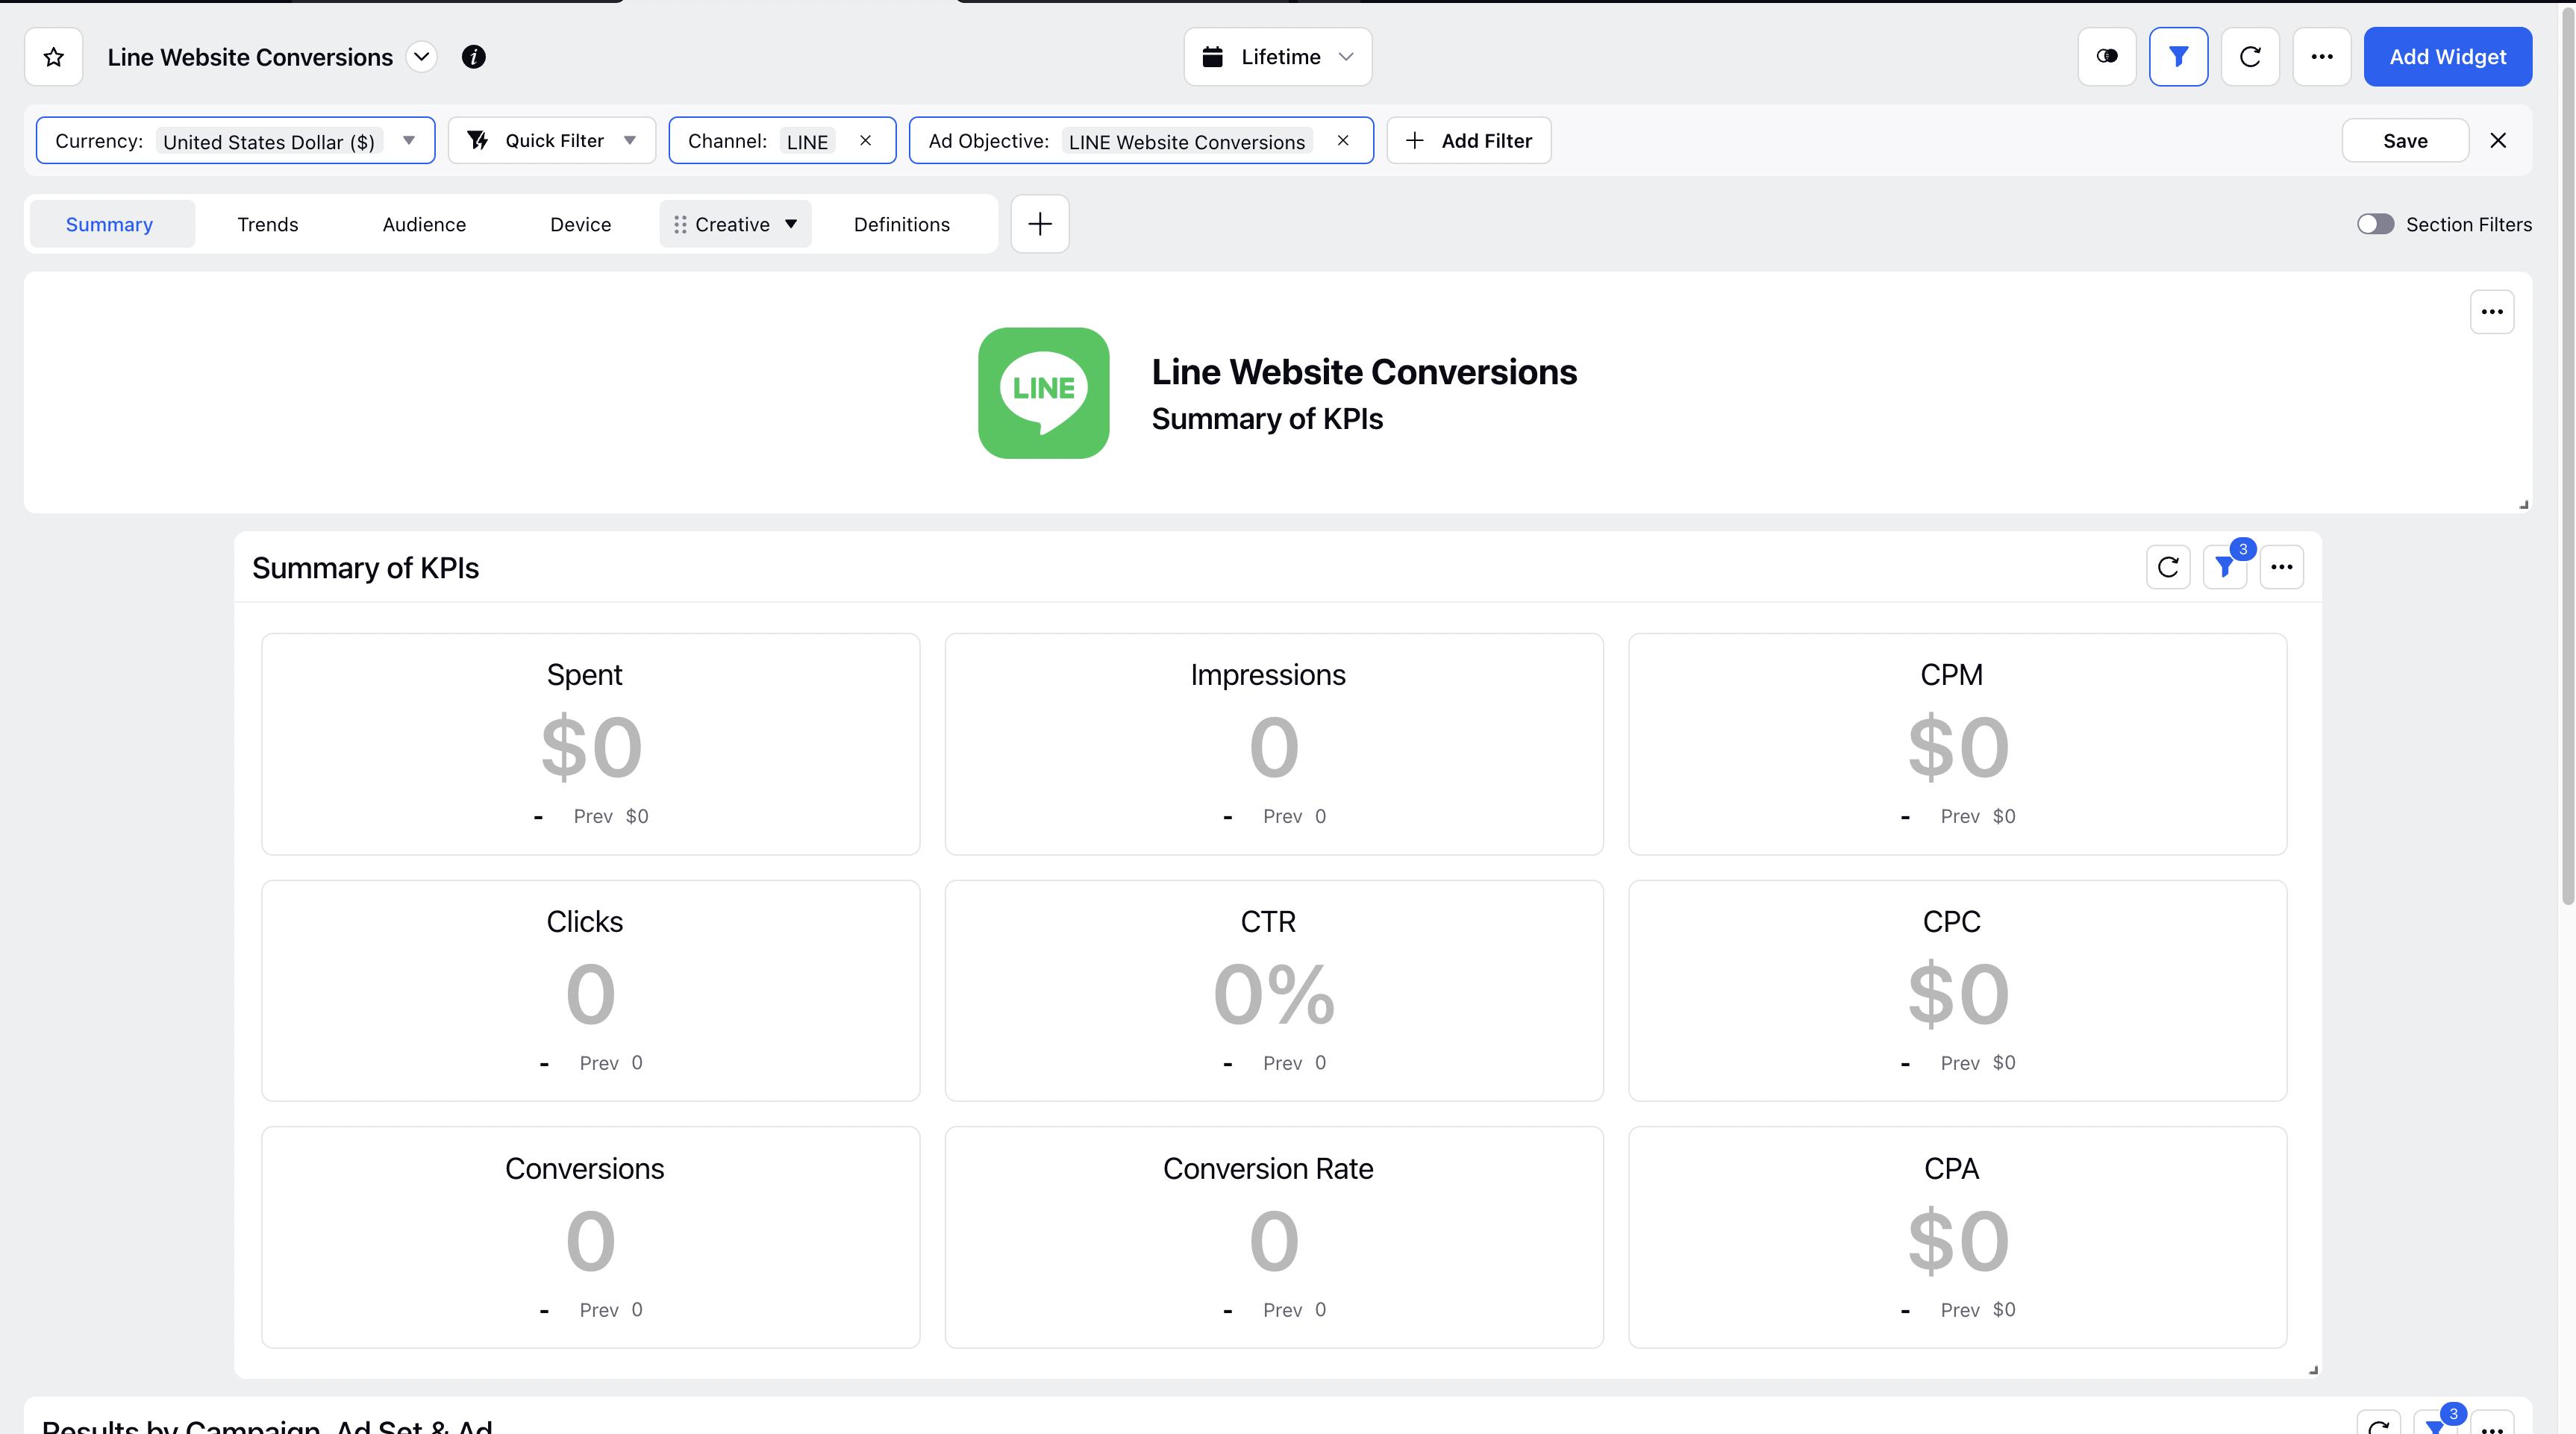
LINE Website Conversions - To give summary of results concerning 'Conversions' objective.
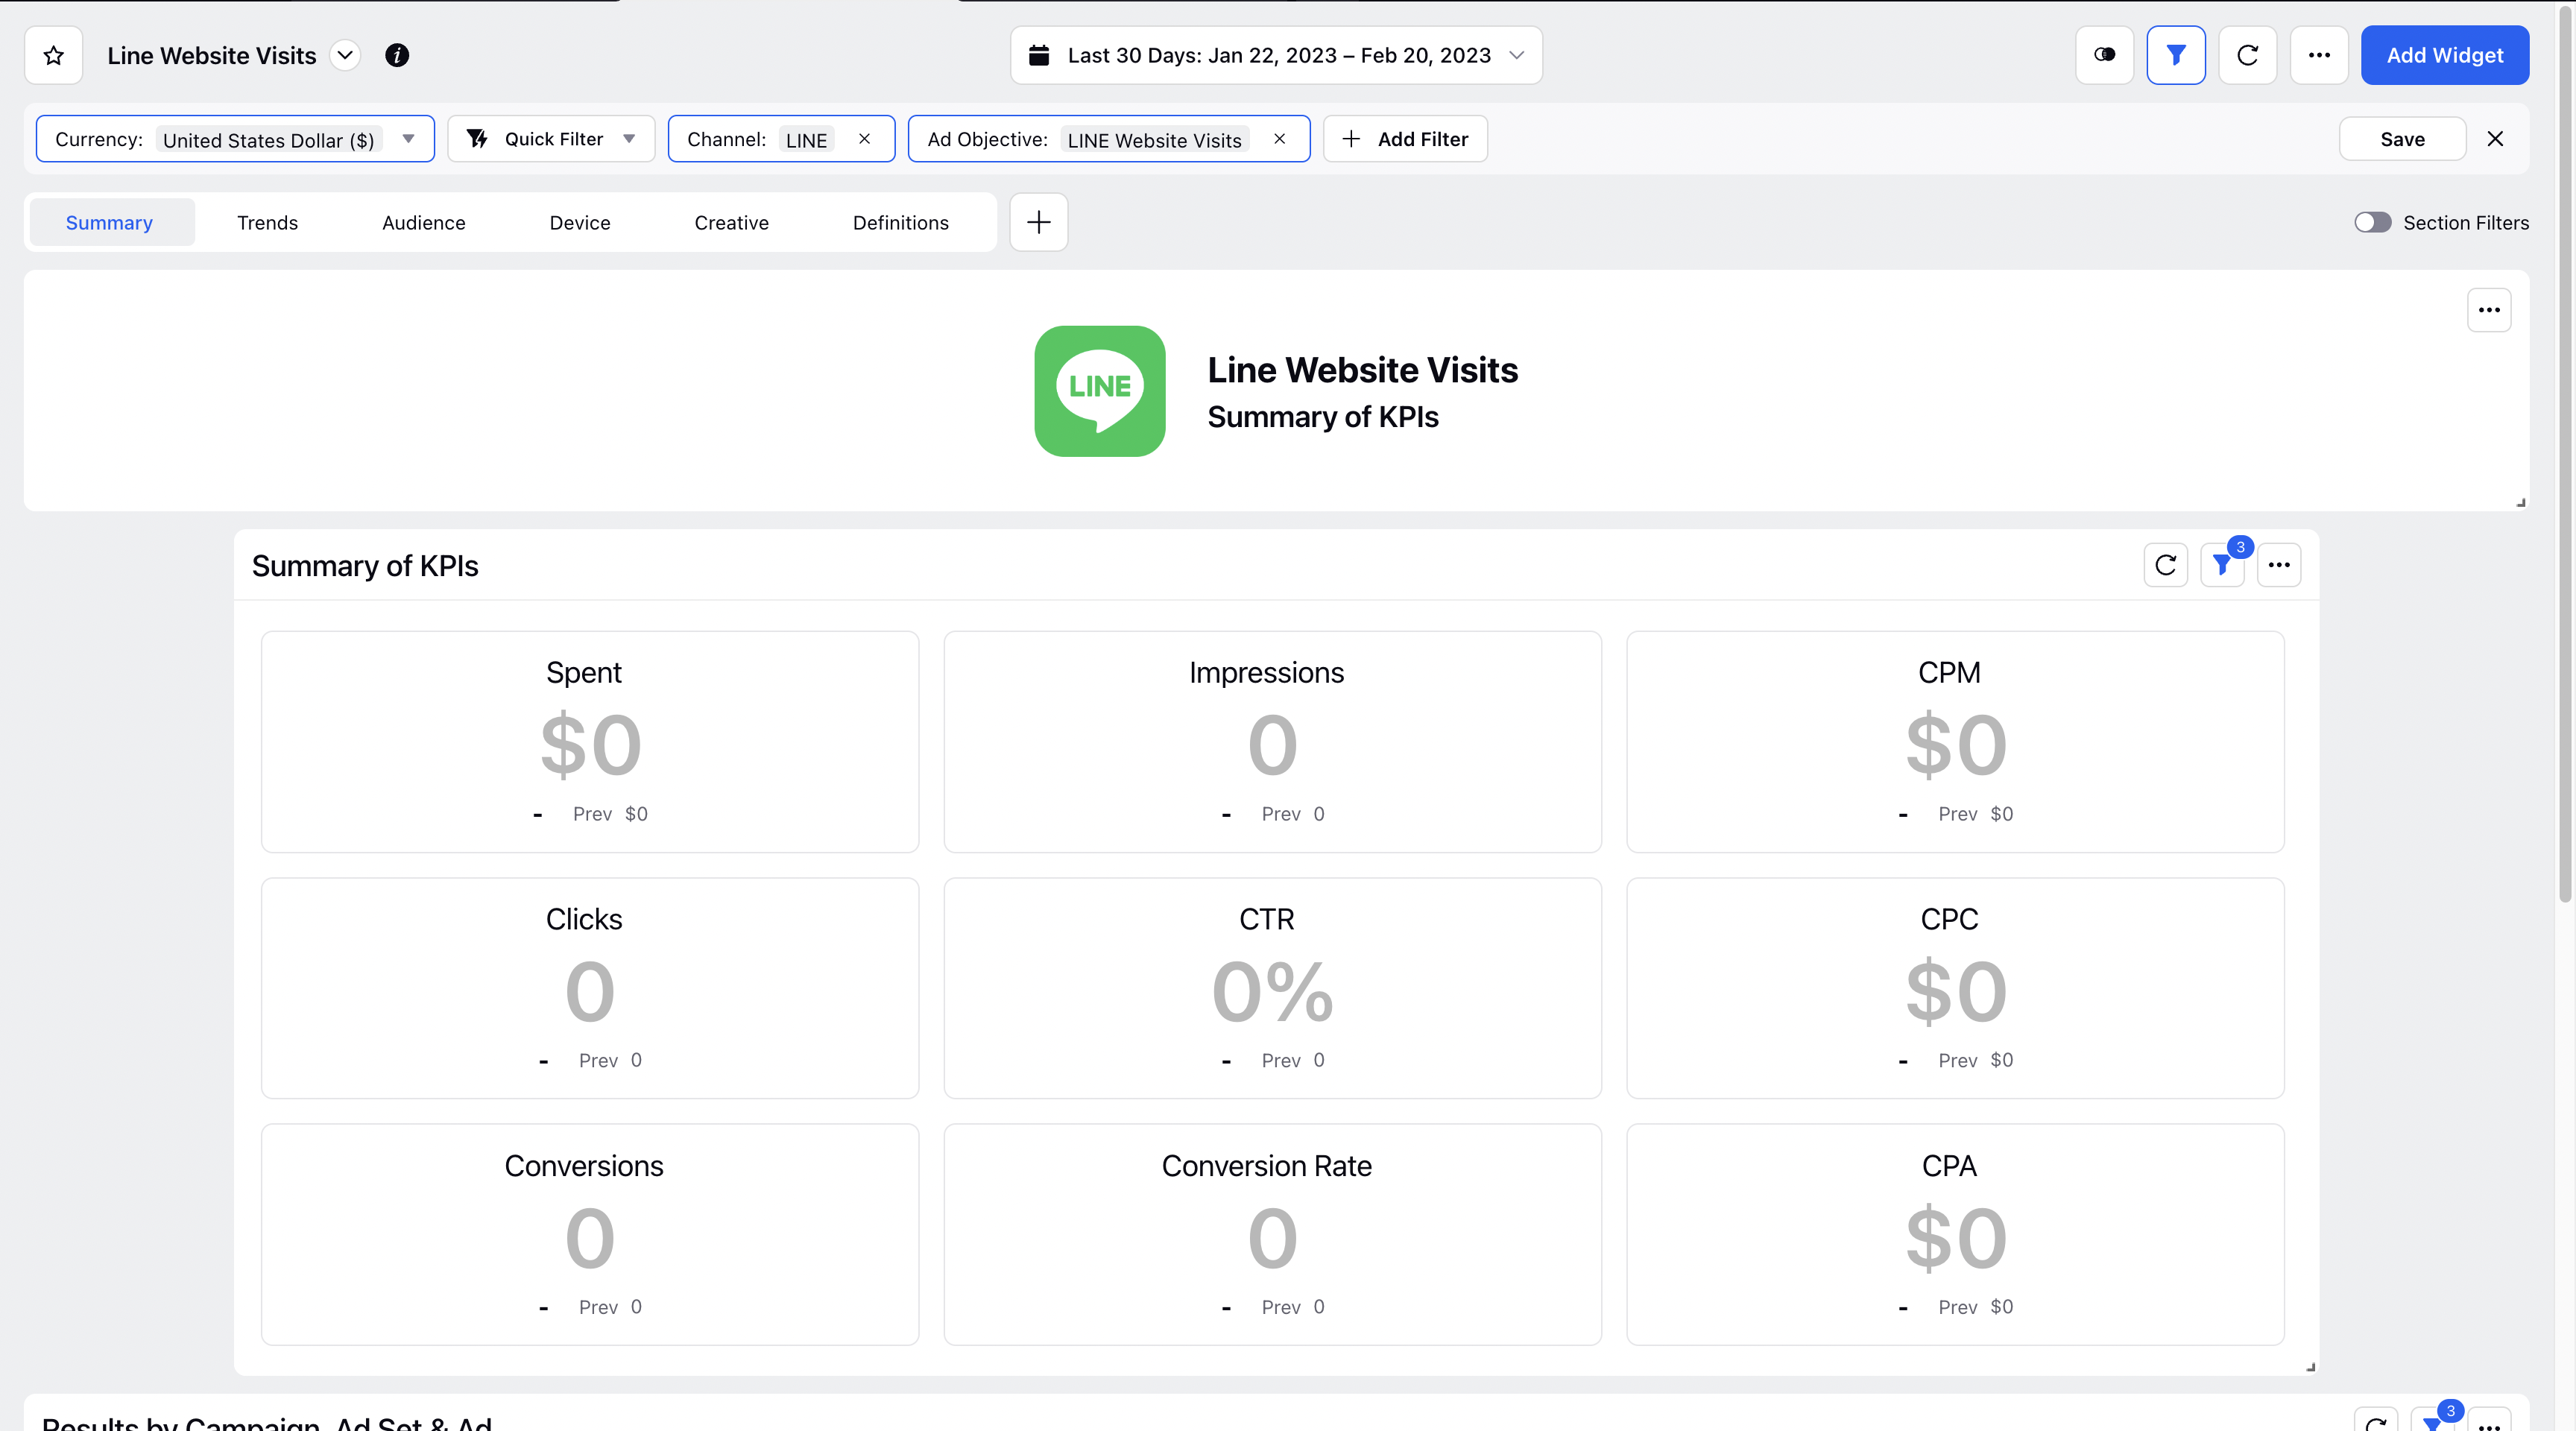
LINE Website Visits - To provide an overview of the findings for the "Traffic" objective.