Pacing Control Strategy Groups & Ads Reporting
Updated
Gain better visibility into your ads, monitor the performance of effective strategy groups and align your ads for better performance.
Sprinklr supports reporting for Pacing Control within Strategy Groups to provide you with better visibility of Ads that have Pacing Control enabled. This will allow you to track and monitor the most effective strategy groups based on performance and align the ads based on the analyzed data.
Reporting on Pacing Control also helps you to take calculated and well-informed decisions i.e. how to spend on ads, when to stop spending on an ad, what are the driving forces behind an ad, etc.
![]() Note: Reporting-only partners can also leverage Pacing Insights via Strategy Groups.
Note: Reporting-only partners can also leverage Pacing Insights via Strategy Groups.
To Navigate to Pacing Control Reporting dashboard
Click the New Tab icon . Under the Sprinklr Marketing (Ads) tab, click Ads Manager within Analyze.
On the Ads Manager window, click Strategy Group in the top left corner of the section bar.
On the Strategy Groups window, click the View Insights icon alongside the desired Pacing Control Strategy Group. You will be redirected to the Strategy Groups Pacing Control reporting window.
![]() Note:
Note:
It takes 10-15 minutes to generate a Strategy Group Reporting Dashboard after the creation of the Strategy Group
Reporting only partners can also leverage Pacing insights via Strategy Groups
To learn more about Creating a Strategy Group, click here
![]() Enablement Note:
Enablement Note:
To learn more about using Strategy Groups in Ads Manager if you have only reporting permission, please work with your Success Manager.
On the Pacing Control reporting dashboard, you can view all the insights. 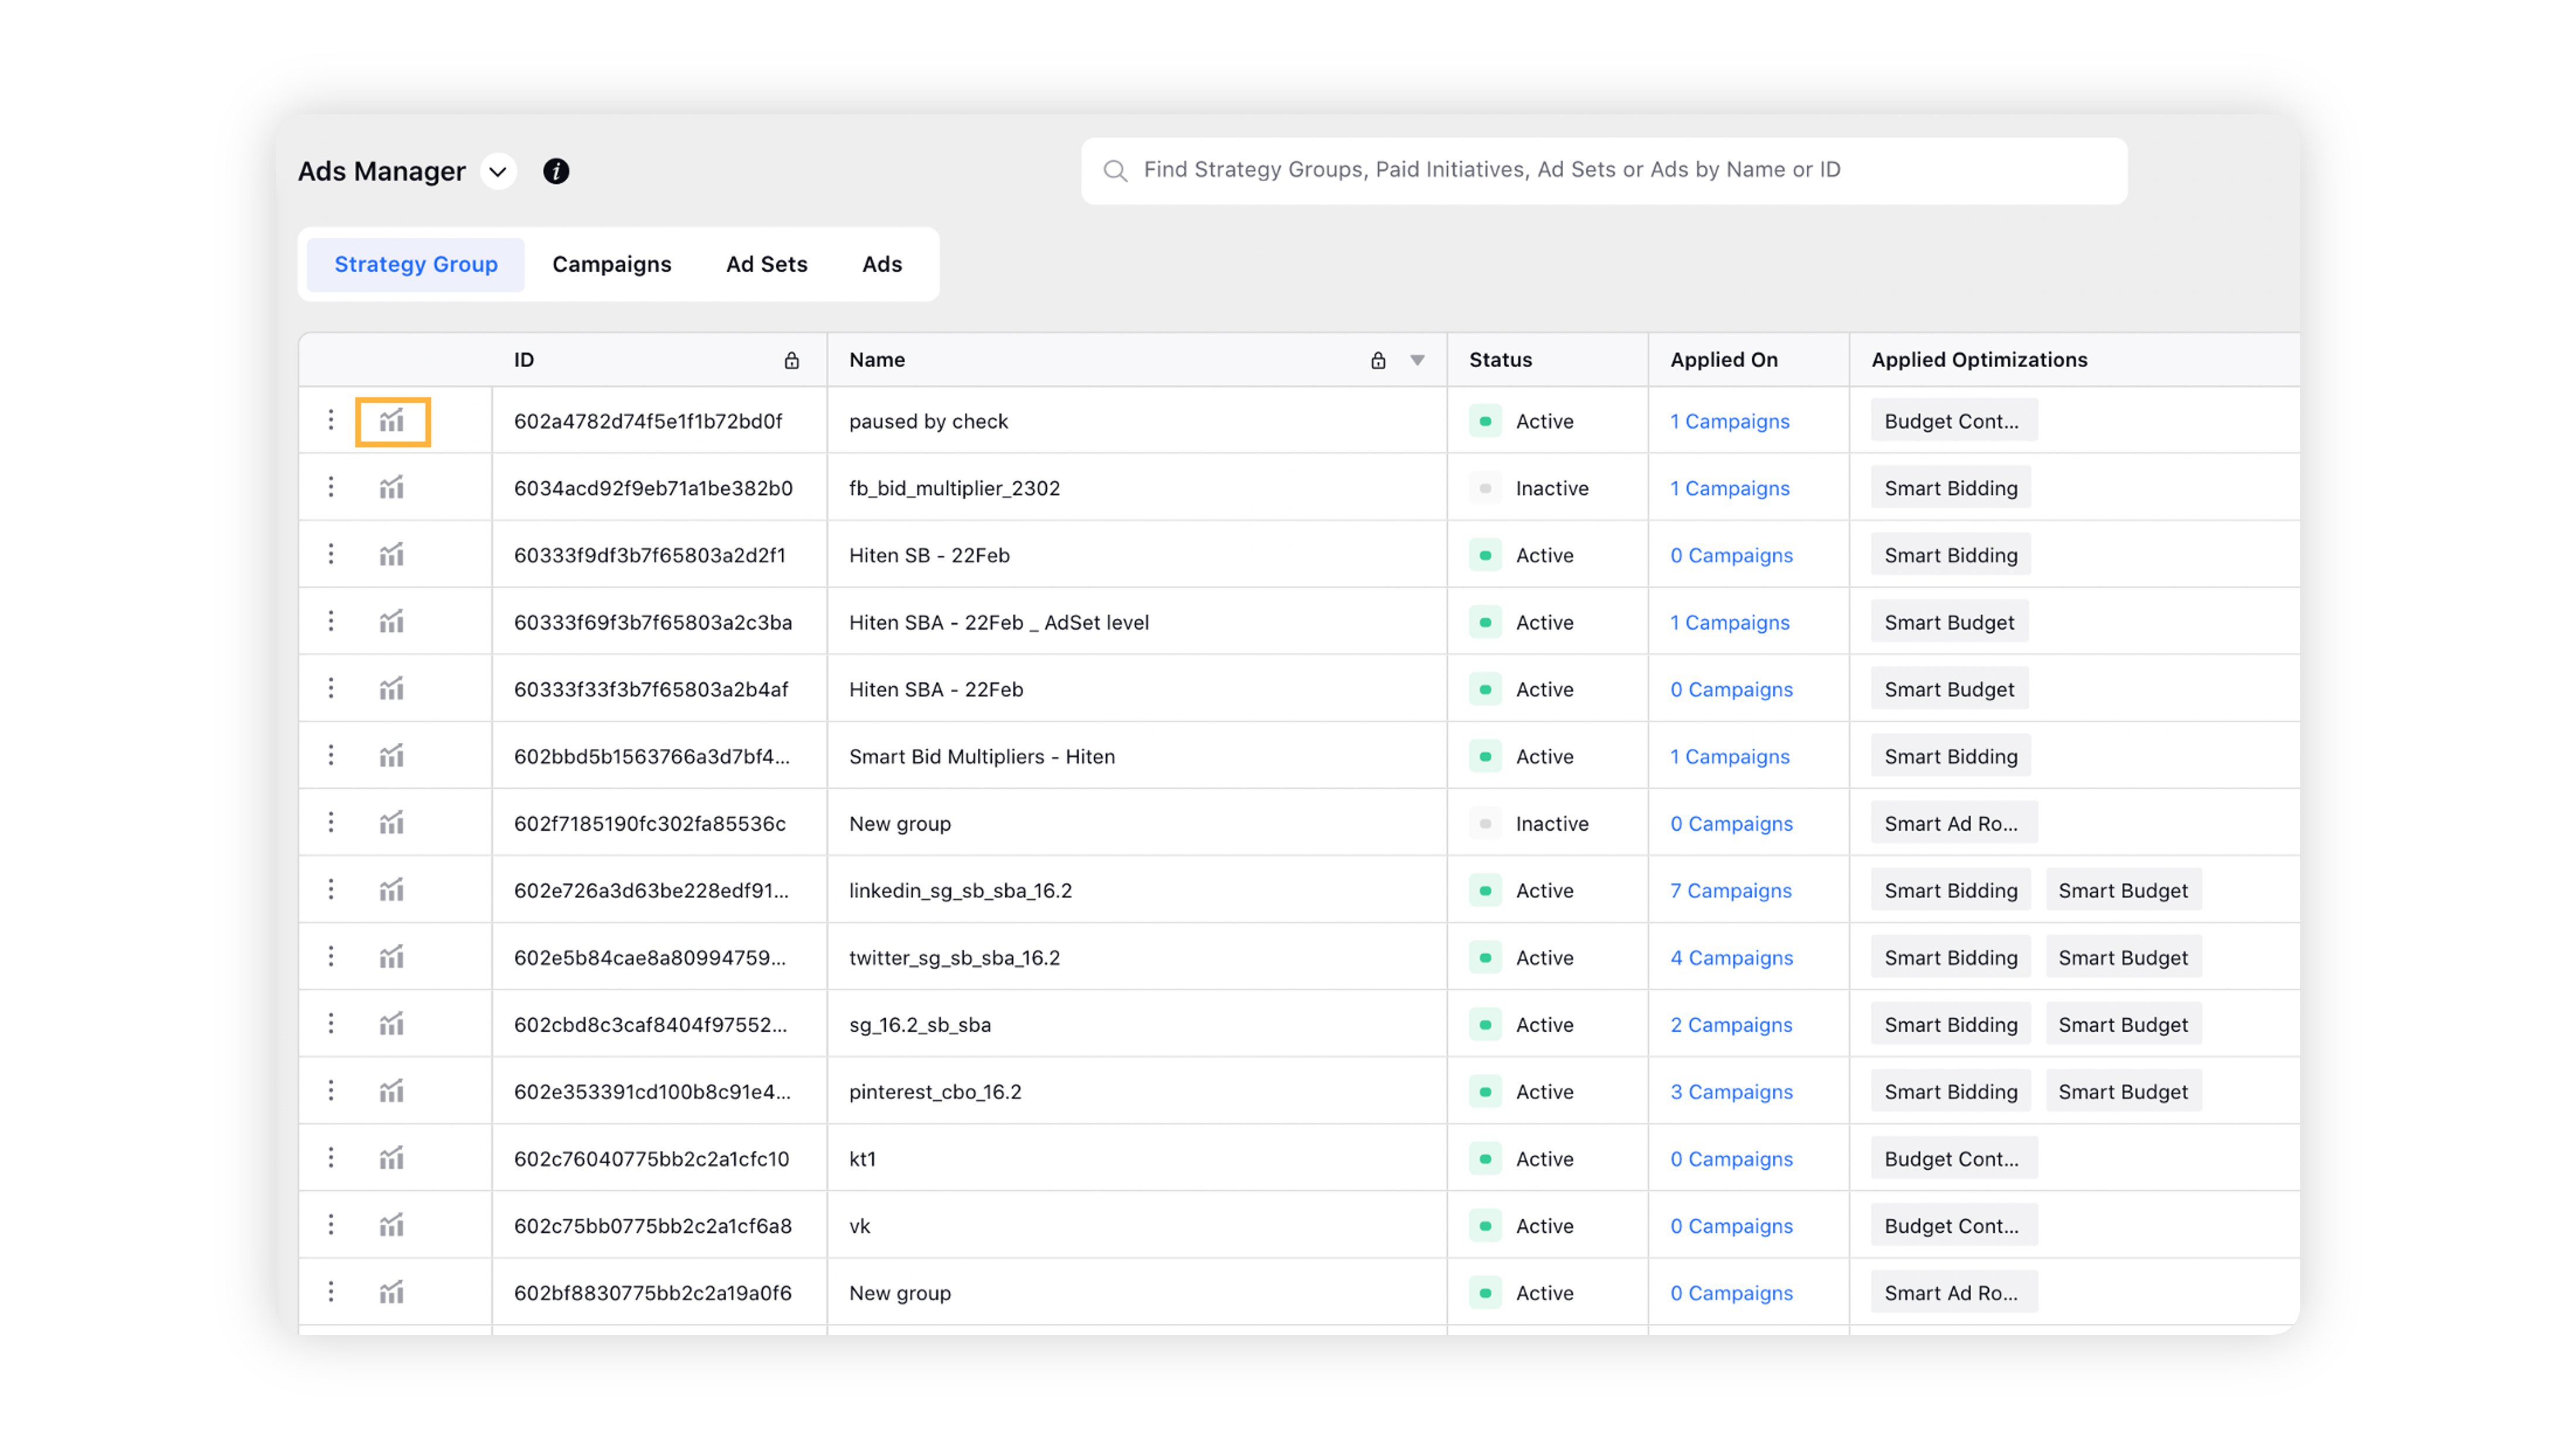
On the Pacing Control reporting dashboard, you can view all the insights. For more information, see Overview of Pacing Control Reporting. 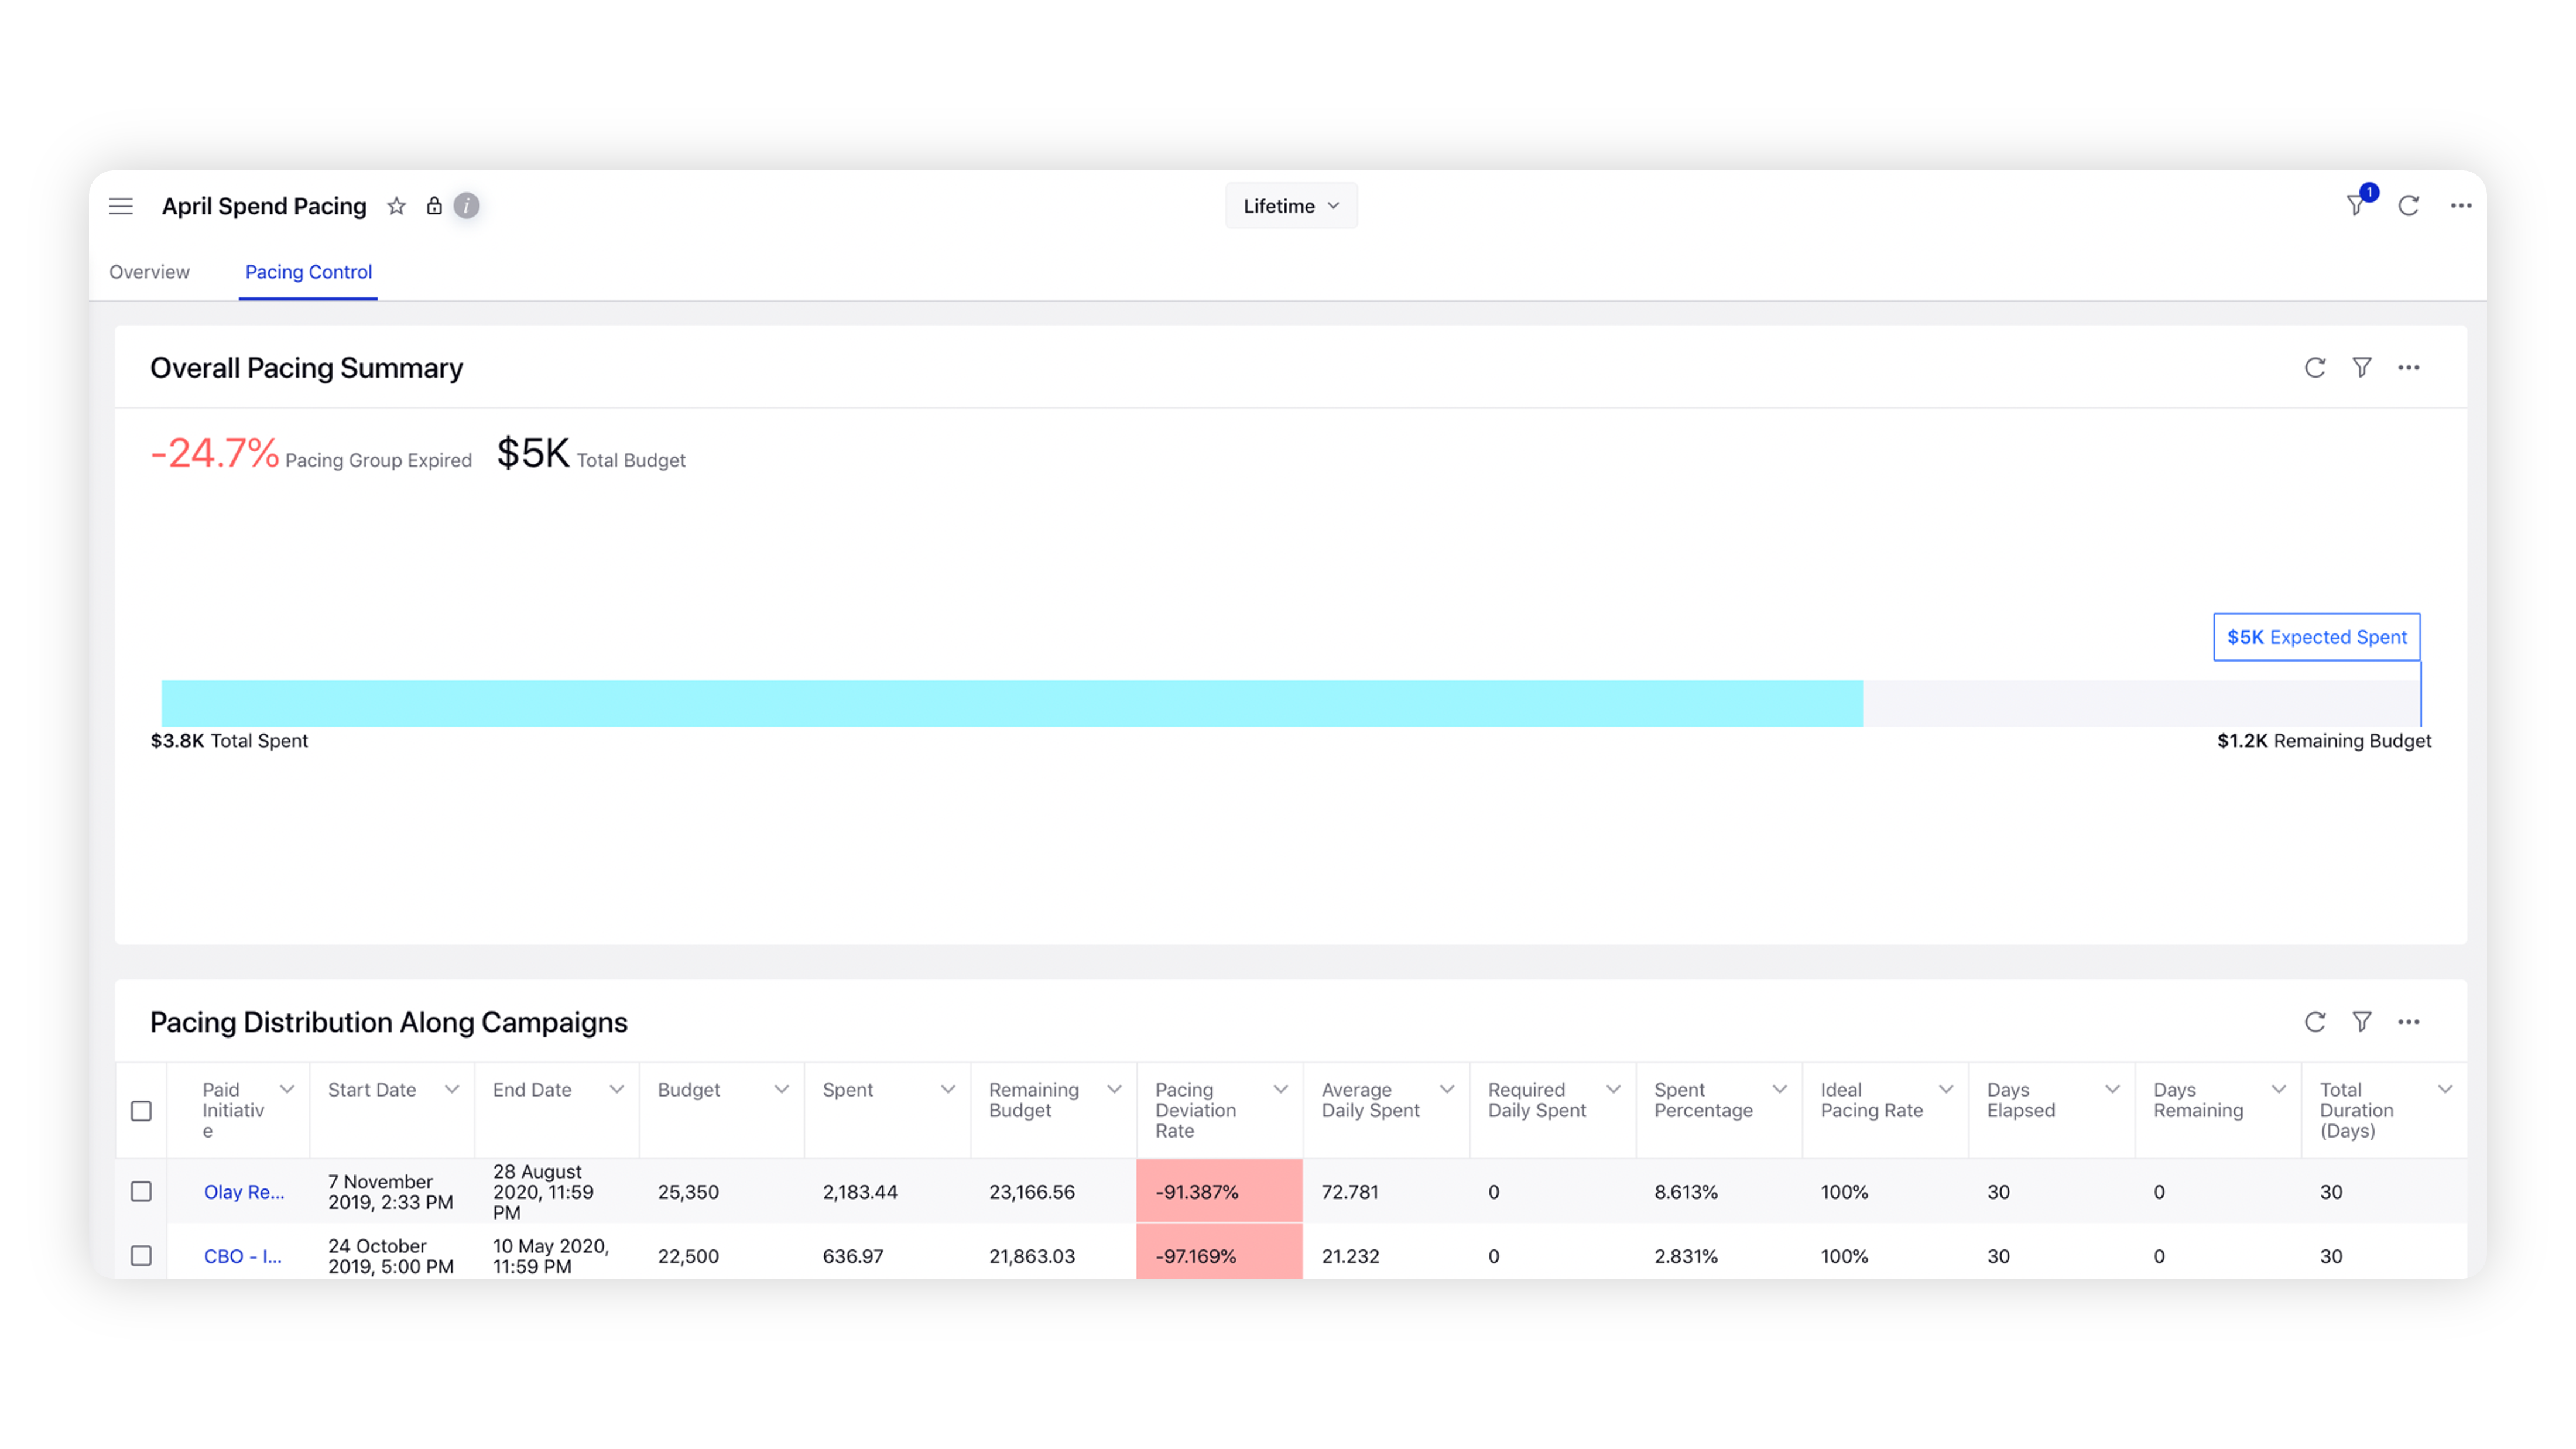
To view Pacing Control Reporting in Ads Manager
Click the New Tab icon
. Under the Sprinklr Marketing (Ads) tab, click Ads Manager within Analyze.
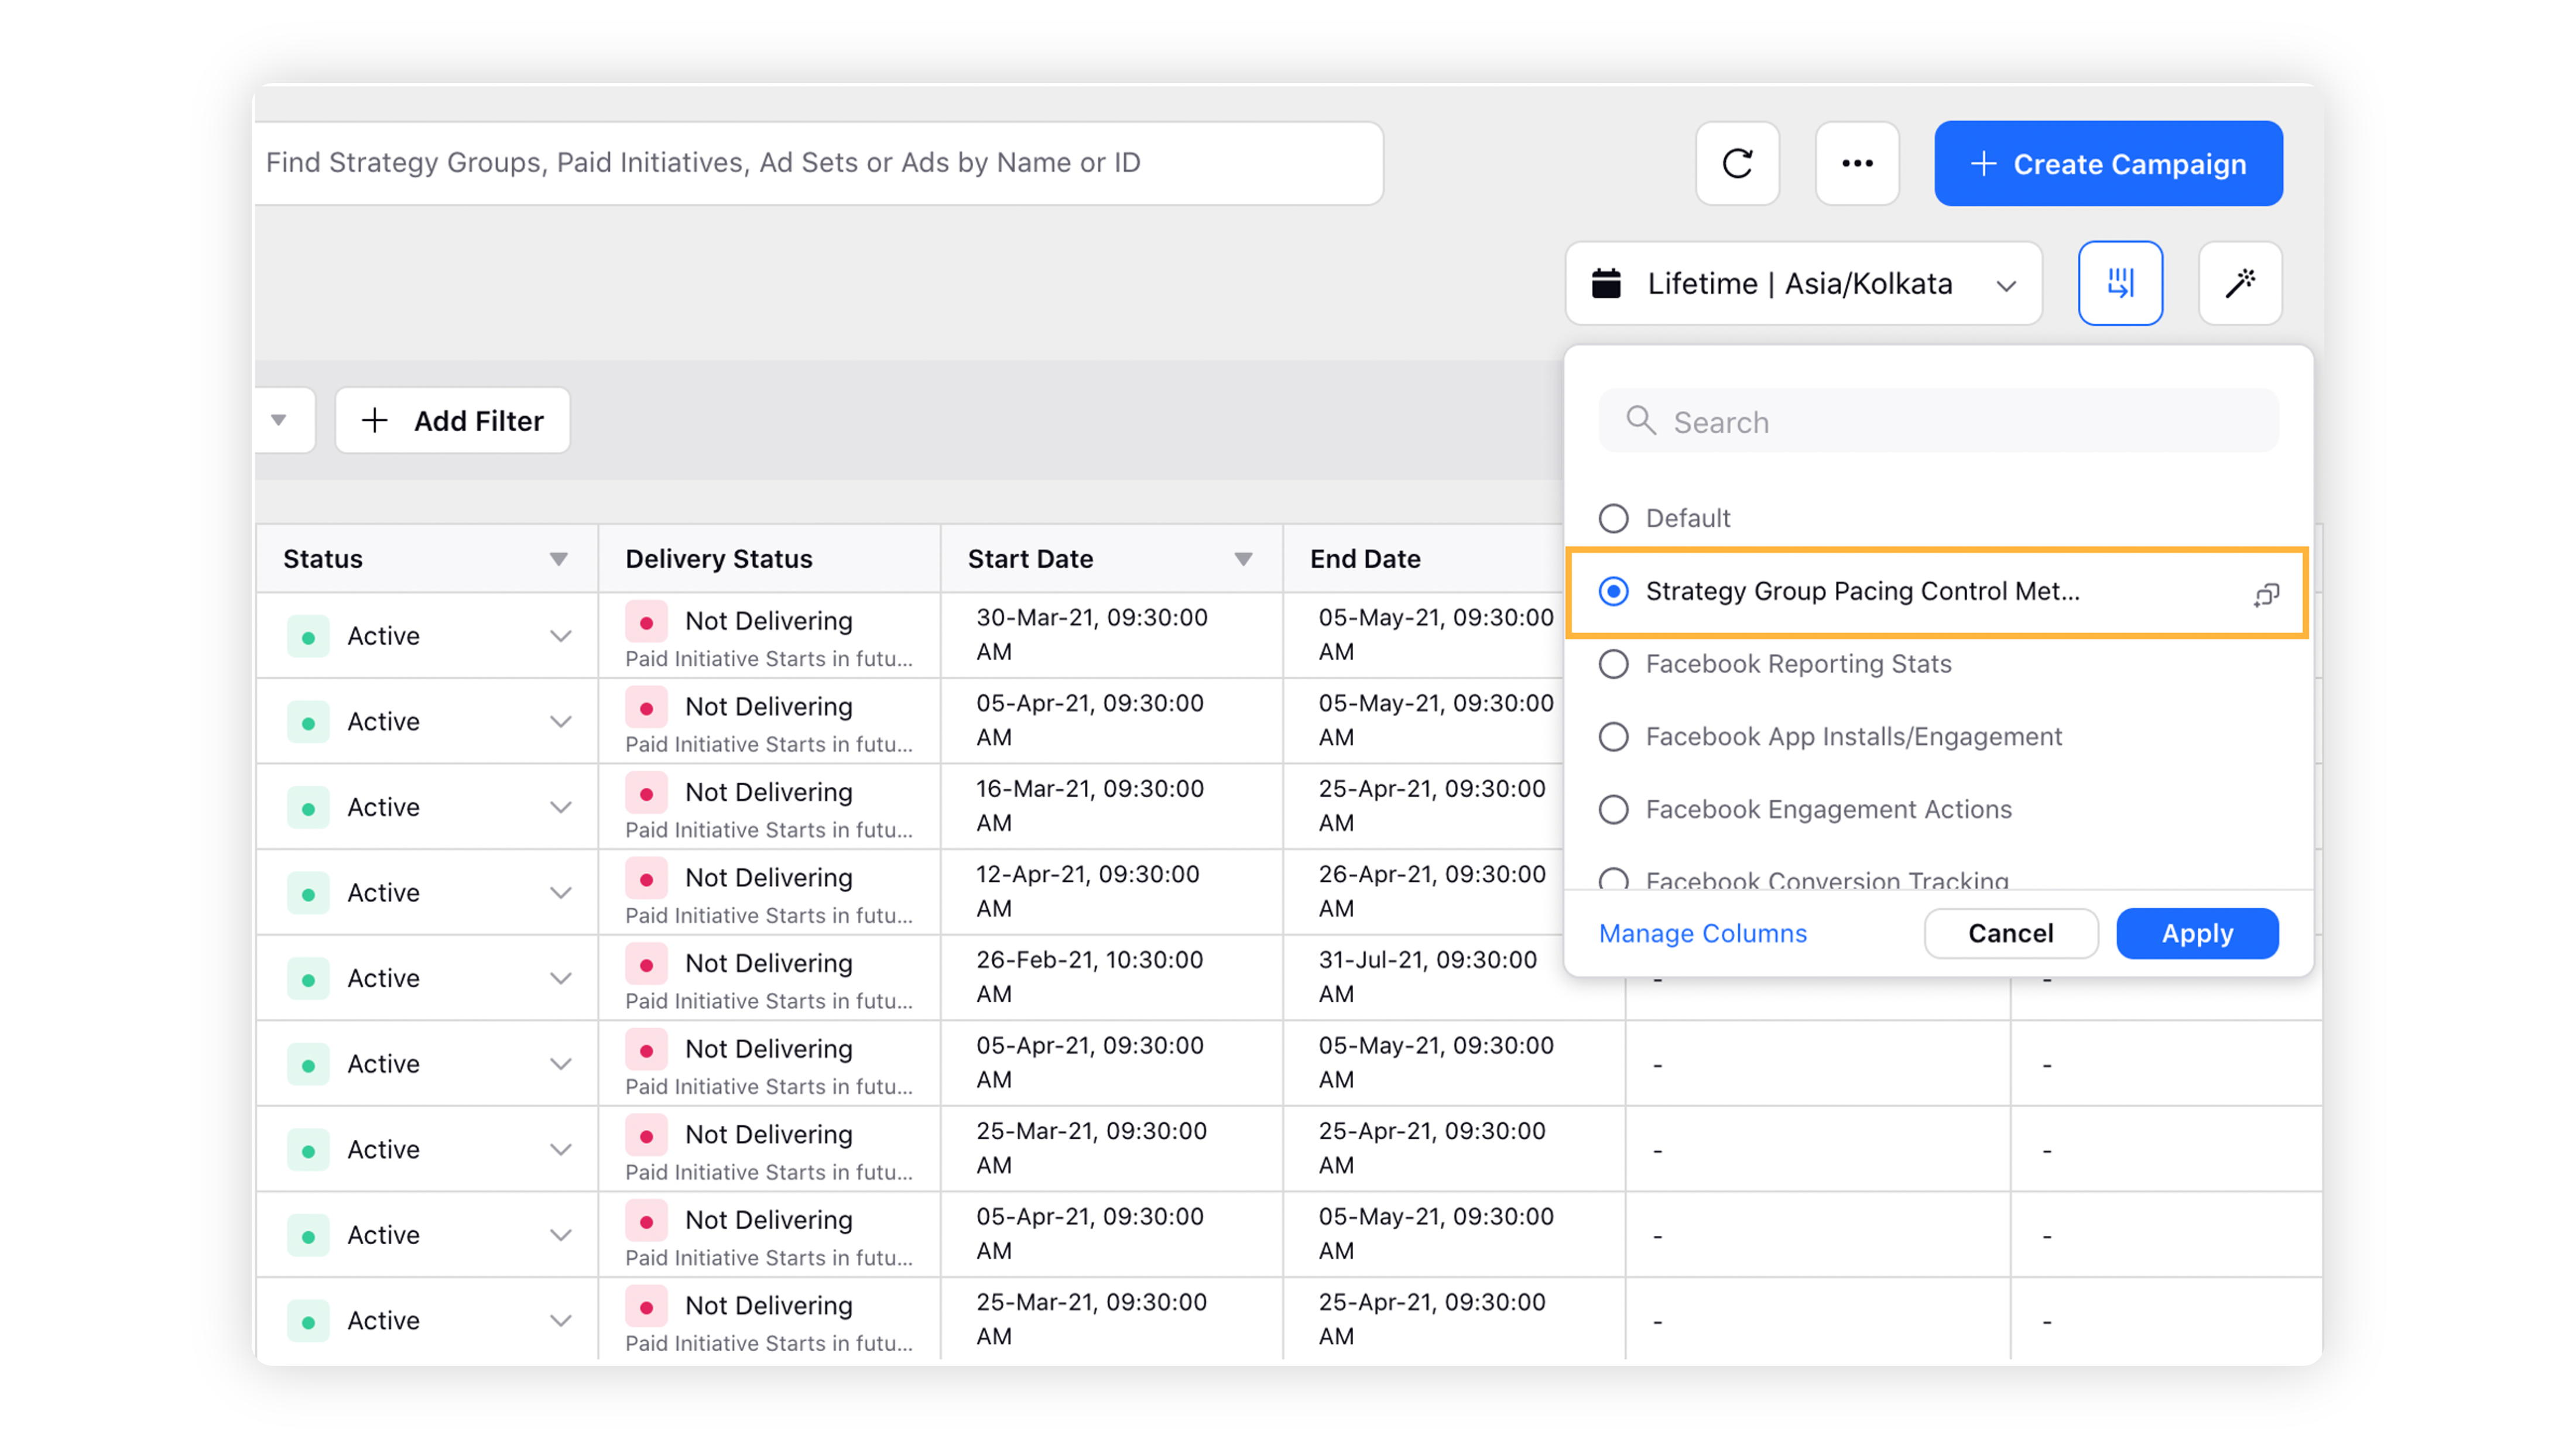
In the top right corner of the Ads Manager window, click the Column Configuration icon
.
Select Strategy Group Pacing Control Metrics option from the standard column configurations and click Apply. You can view the Pacing Insights at the Campaign and Ad Set level.
Analyze Pacing
The details of your budget spend and the rate at which your campaign is consuming resources are represented in Ads Reporting in an informative and graphical layout. It provides a straightforward representation of how your advertising campaigns perform on a daily basis in order to minimize under or overspends while simultaneously achieving your advertising goals.
You will have a standard dashboard for Pacing Control along with an Overview mapped to Advertising PBOs and PBUCs.
Metrics values will not begin to populate until the Campaigns are tagged and the data is mapped to those Campaigns.
Points to Remember
Lifetime Spend Pacing Insights are shown using Lifetime Spend Limit and Start & End dates. It also takes into consideration the Custom Duration Limits, if specified.
Optimization Volume Pacing insights are shown using Volume Goal and Start & End dates.
Daily Spend Pacing Insights are shown using Daily Spend Limit. It shows today’s pacing insight.
Overview of Pacing Control Reporting
Widget + Supported Dimensions | Pictorial Reference |
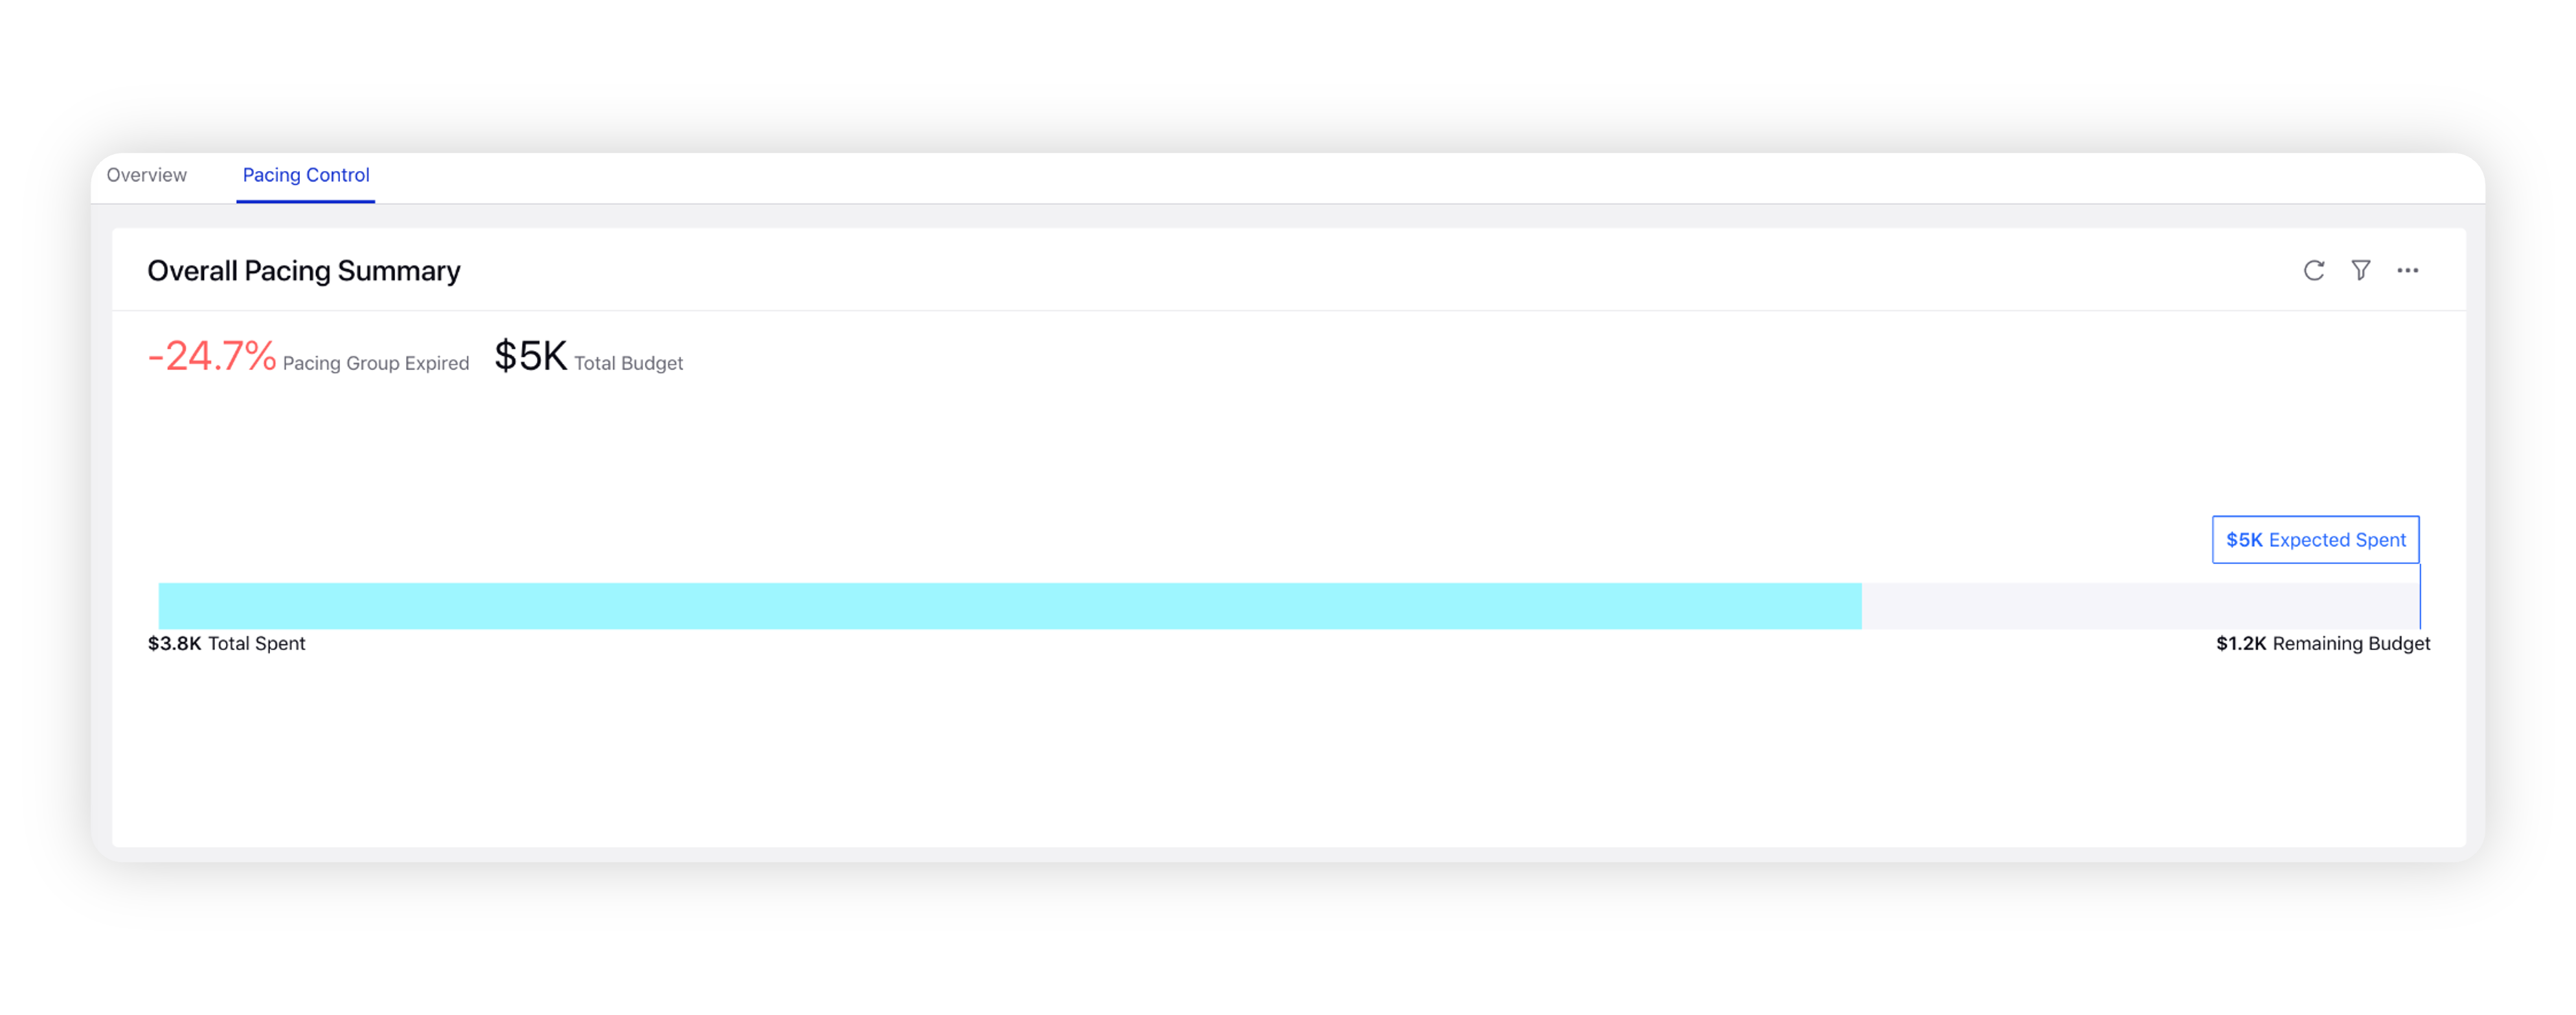
Overall Pacing Summary
View an overall pacing summary of your campaign. The widget highlights:
|
|
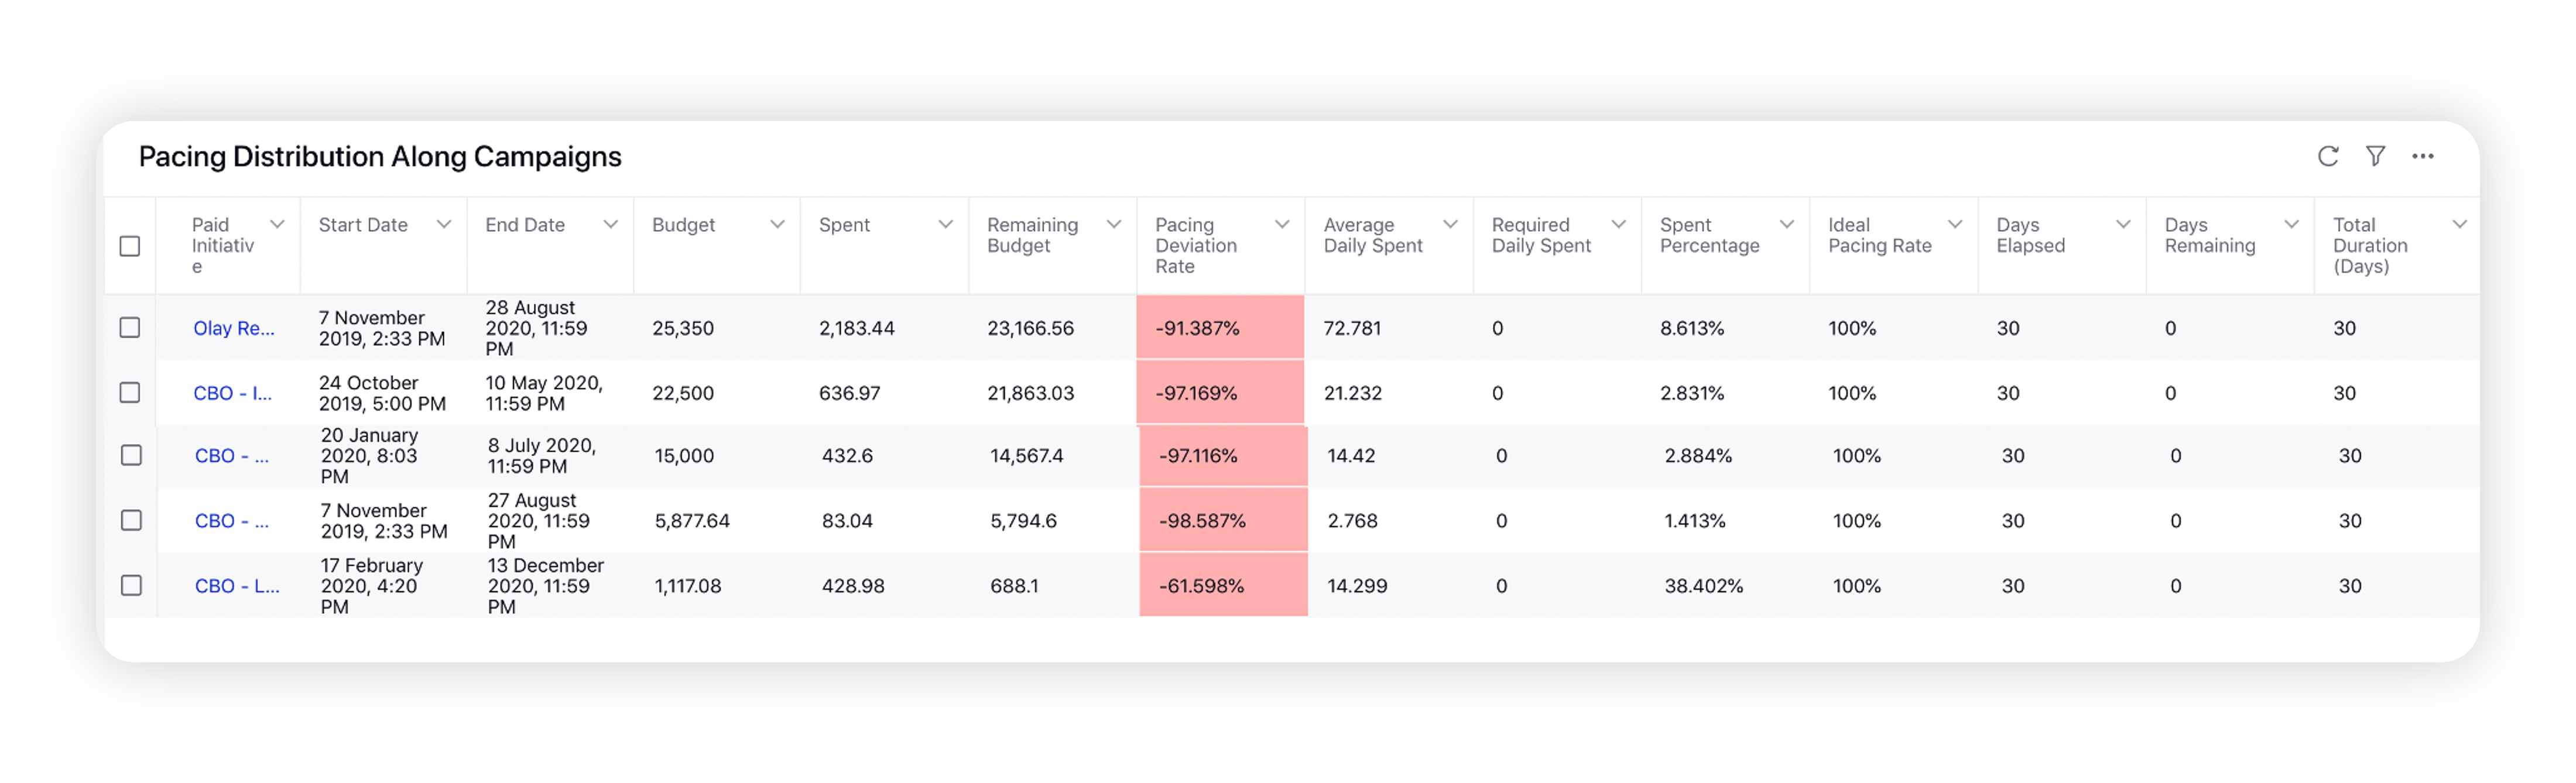
Pacing Distribution Along Campaigns
View distribution of your budget along with the respective campaigns.
|
|
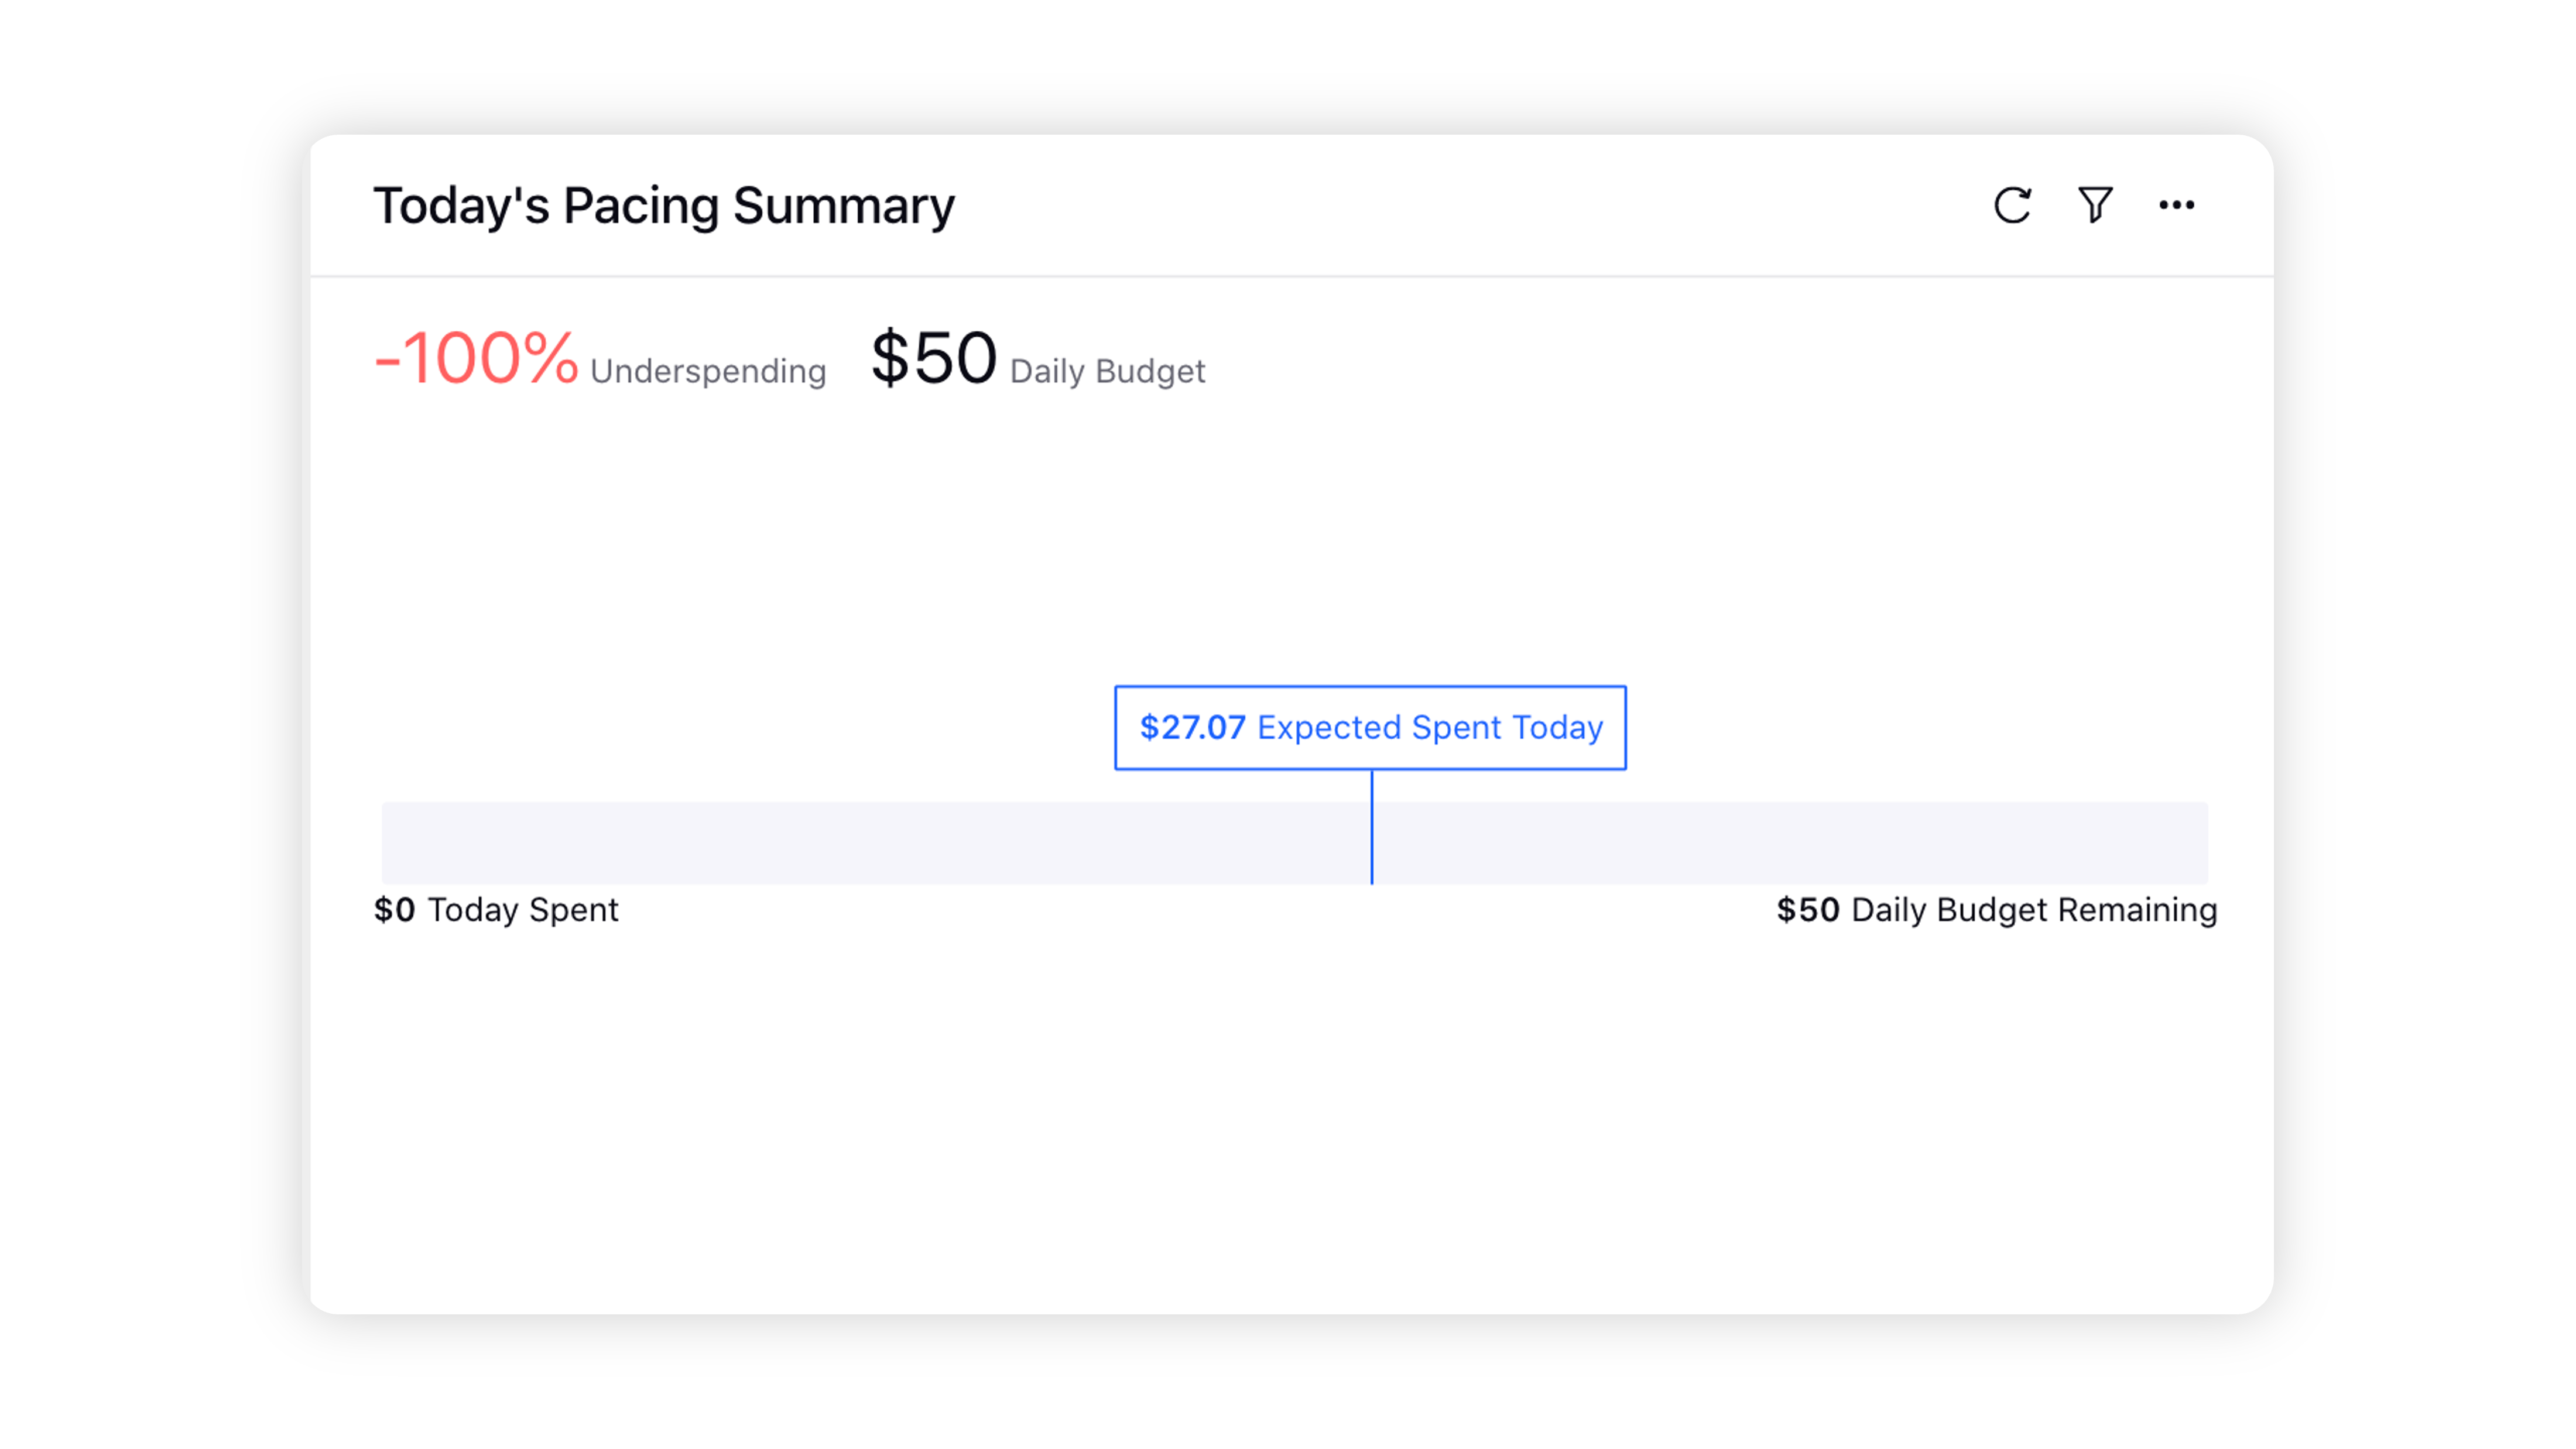
Today's Pacing Summary
View pacing summary of the present day. The widget highlights:
|
|
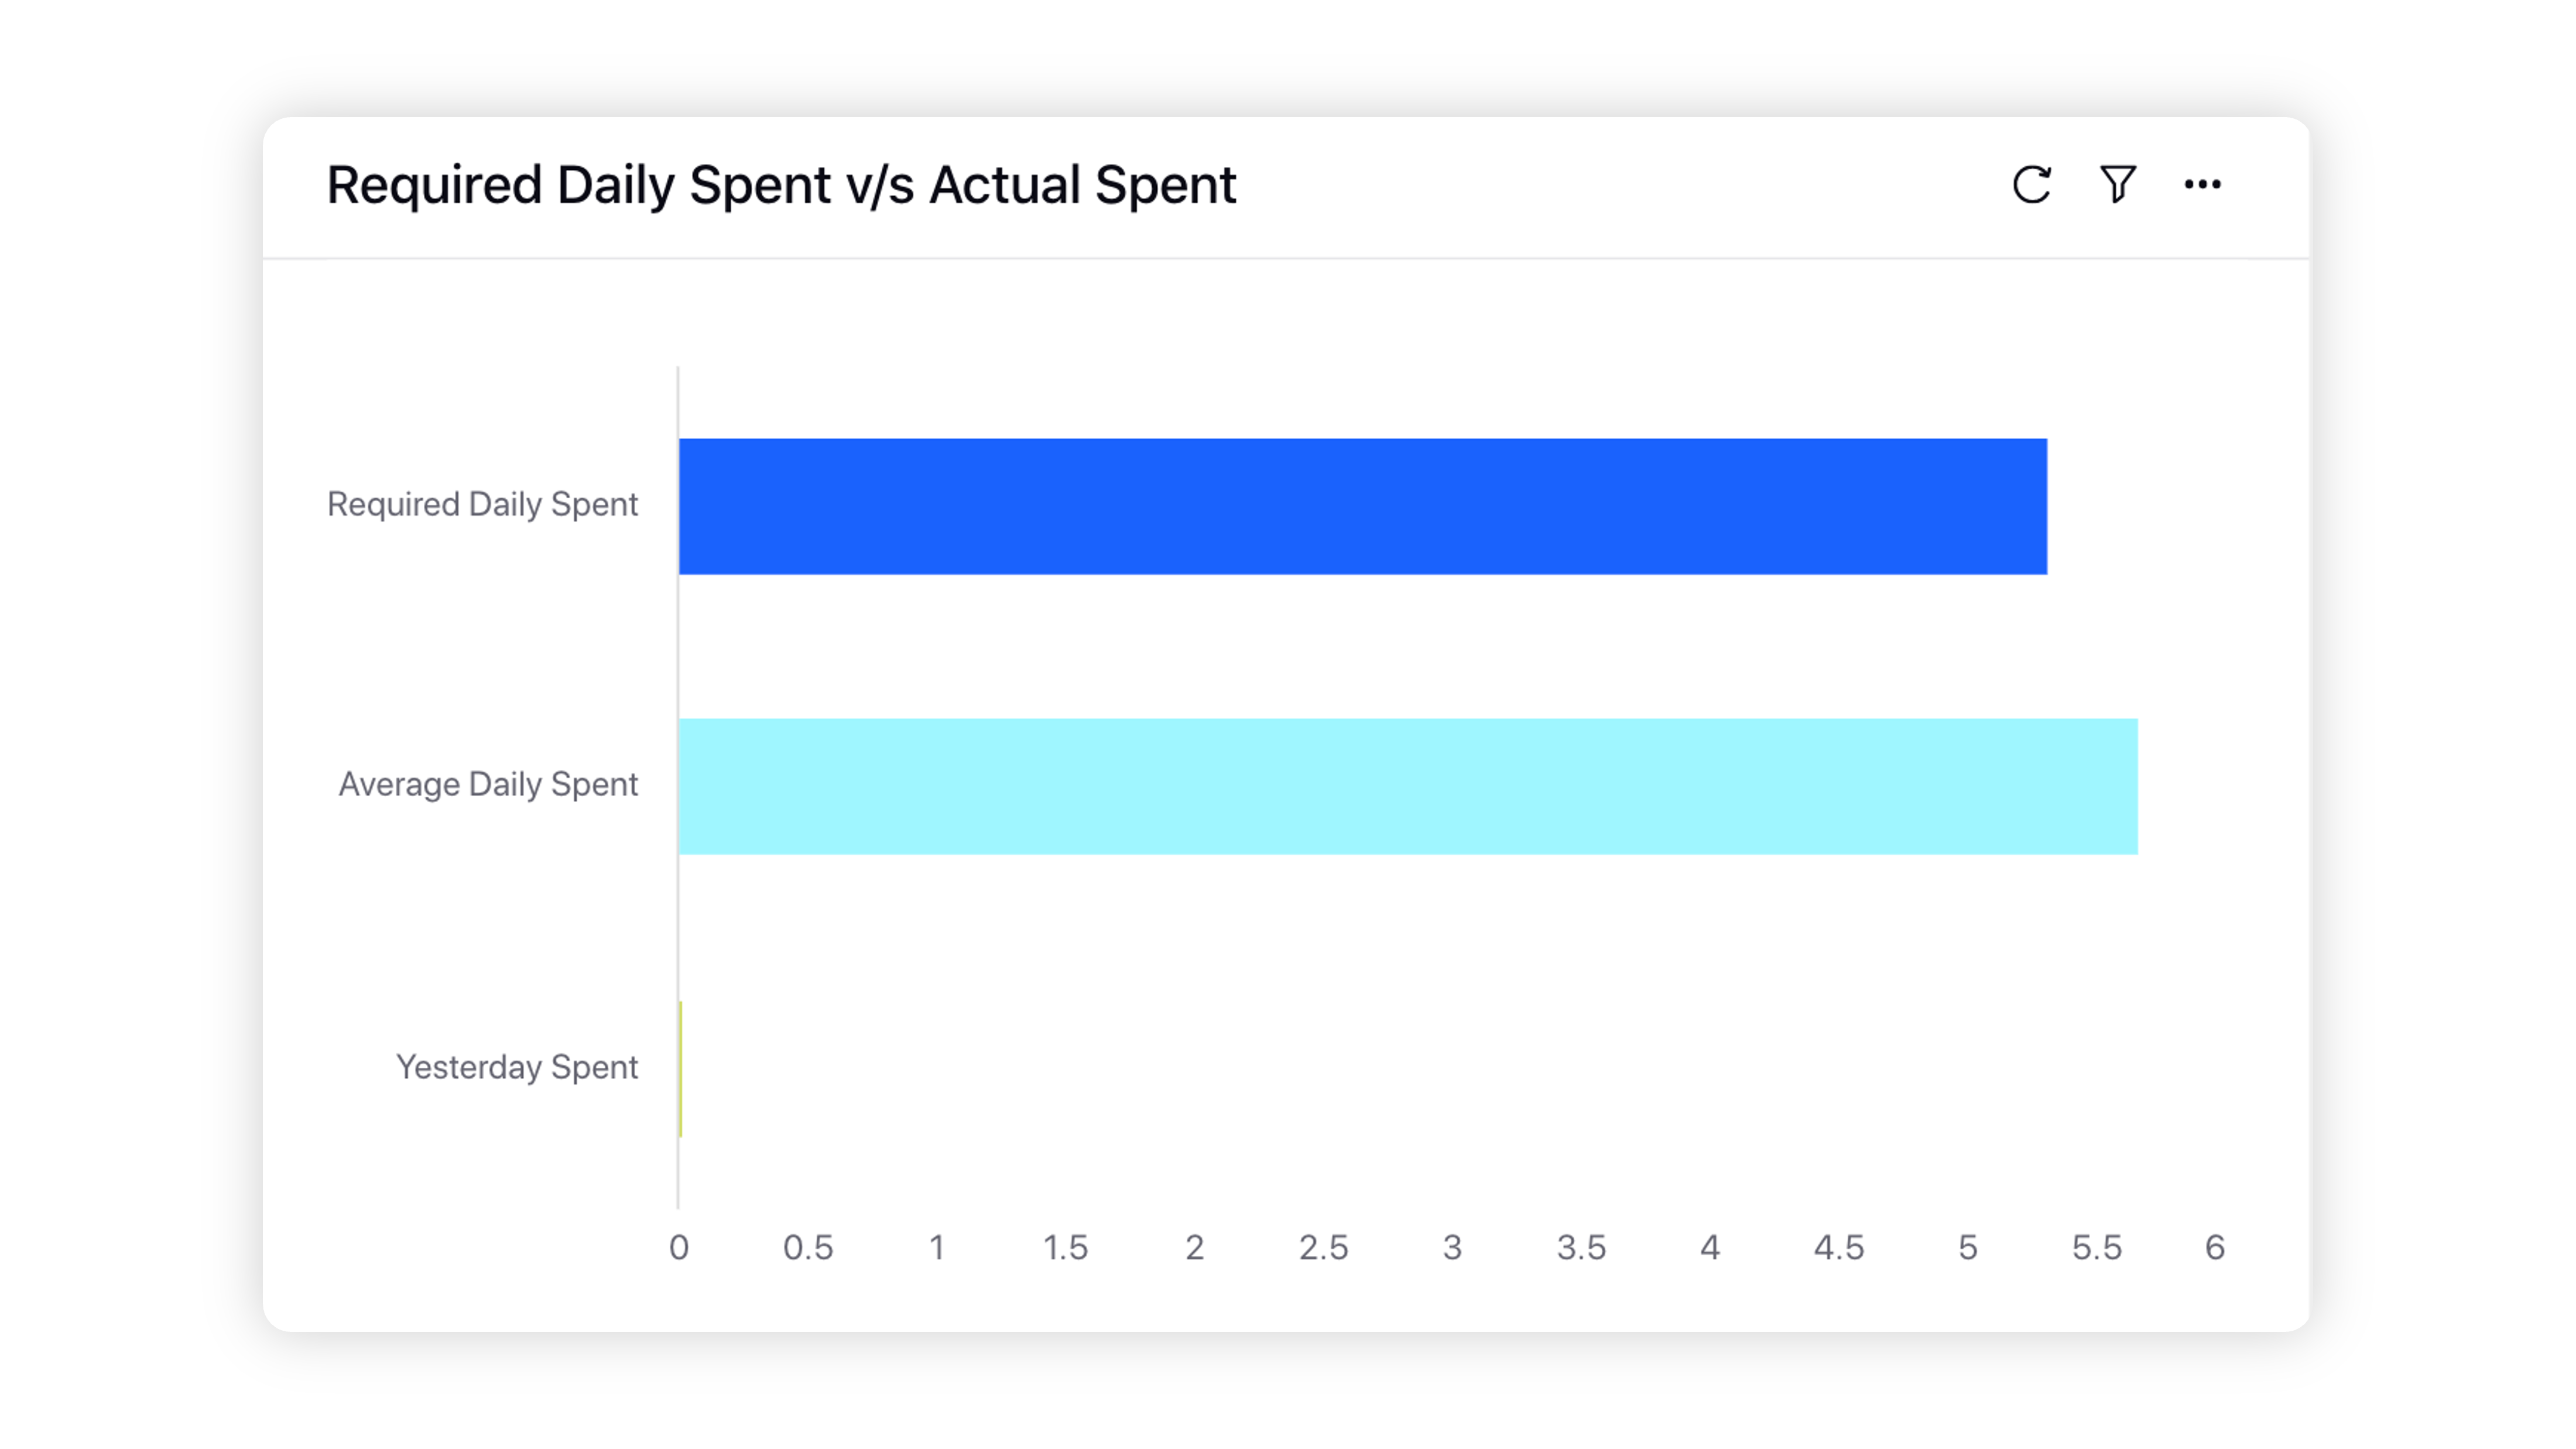
Required Daily Spent v/s Actual Spent
View the real-time comparison between the required daily spent vs. actual spent. The widget highlights:
|
|
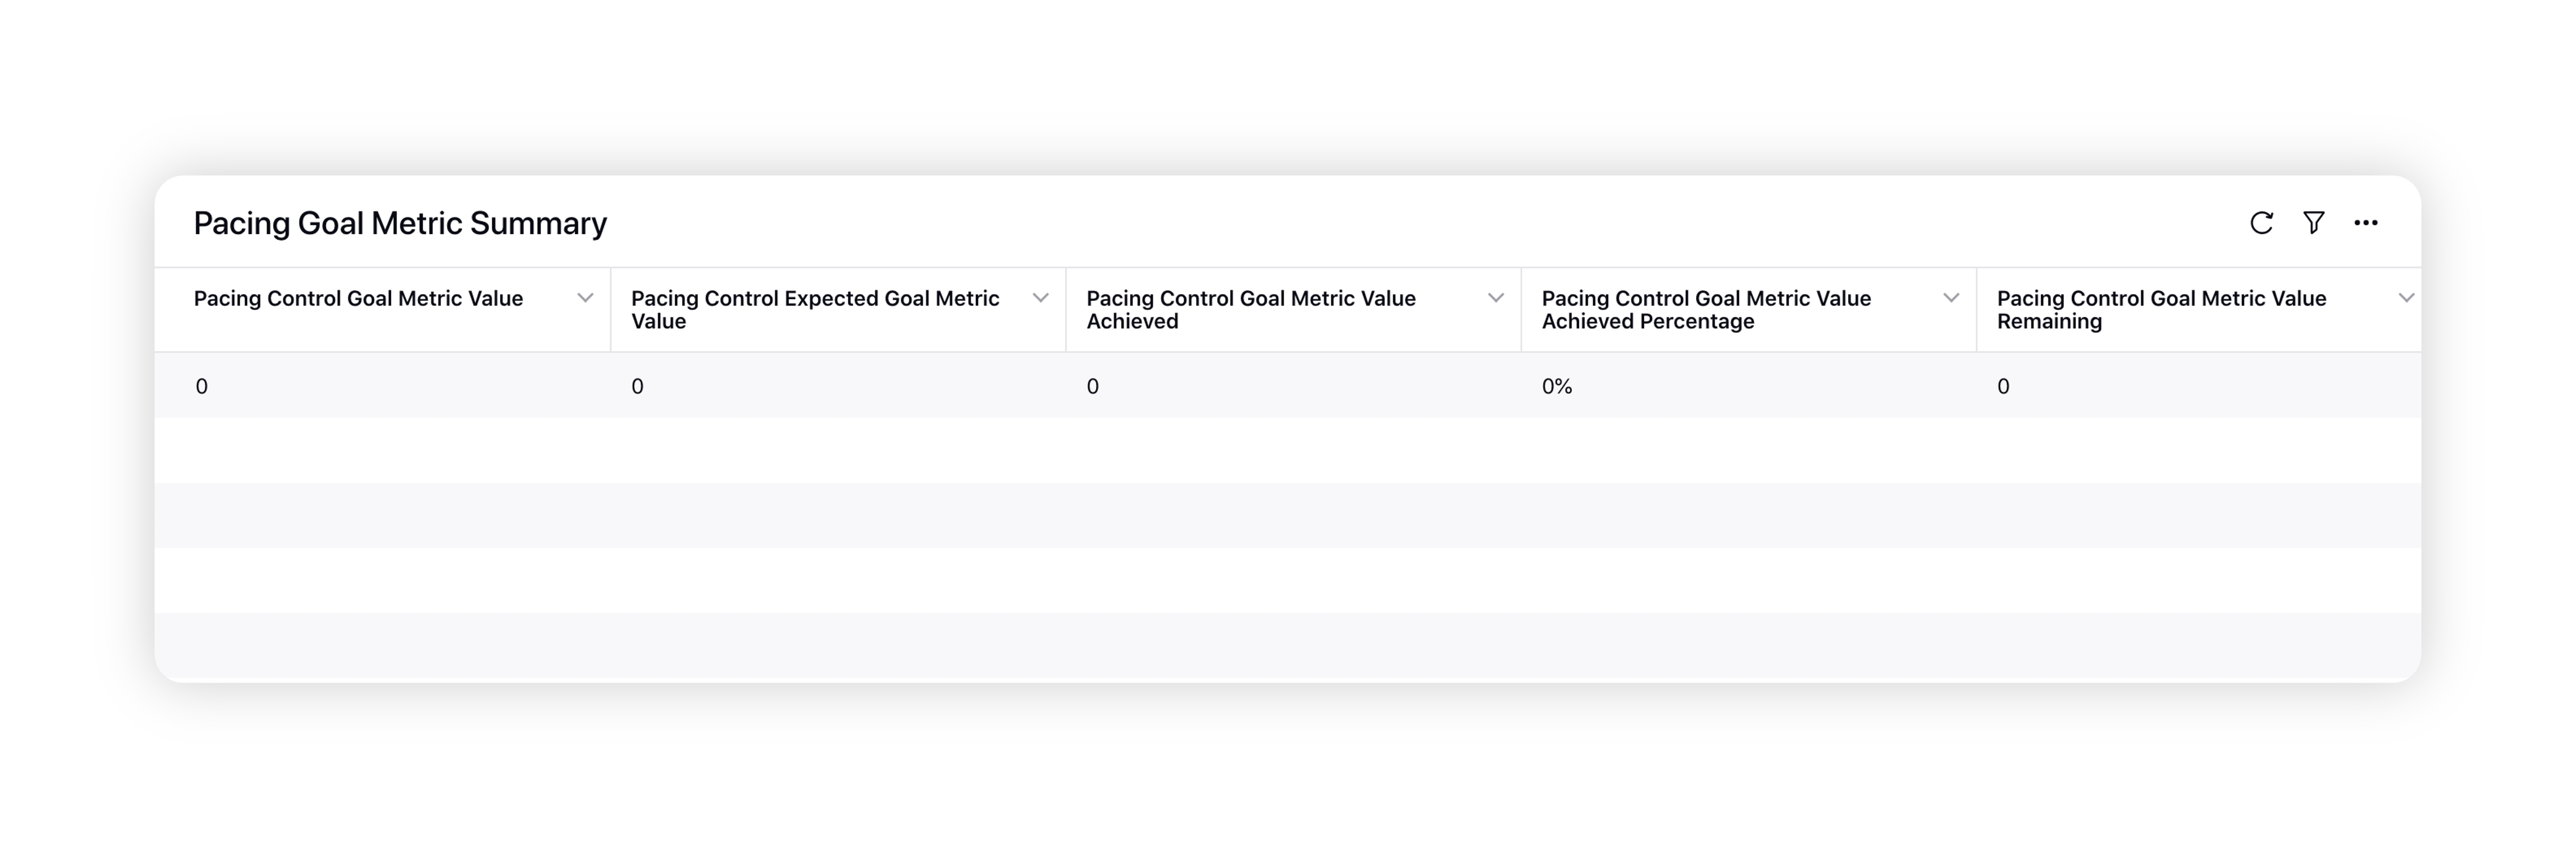
Pacing Goal Metric Summary
View the complete summary of your pacing goal with the help of the following metrics:
|
|
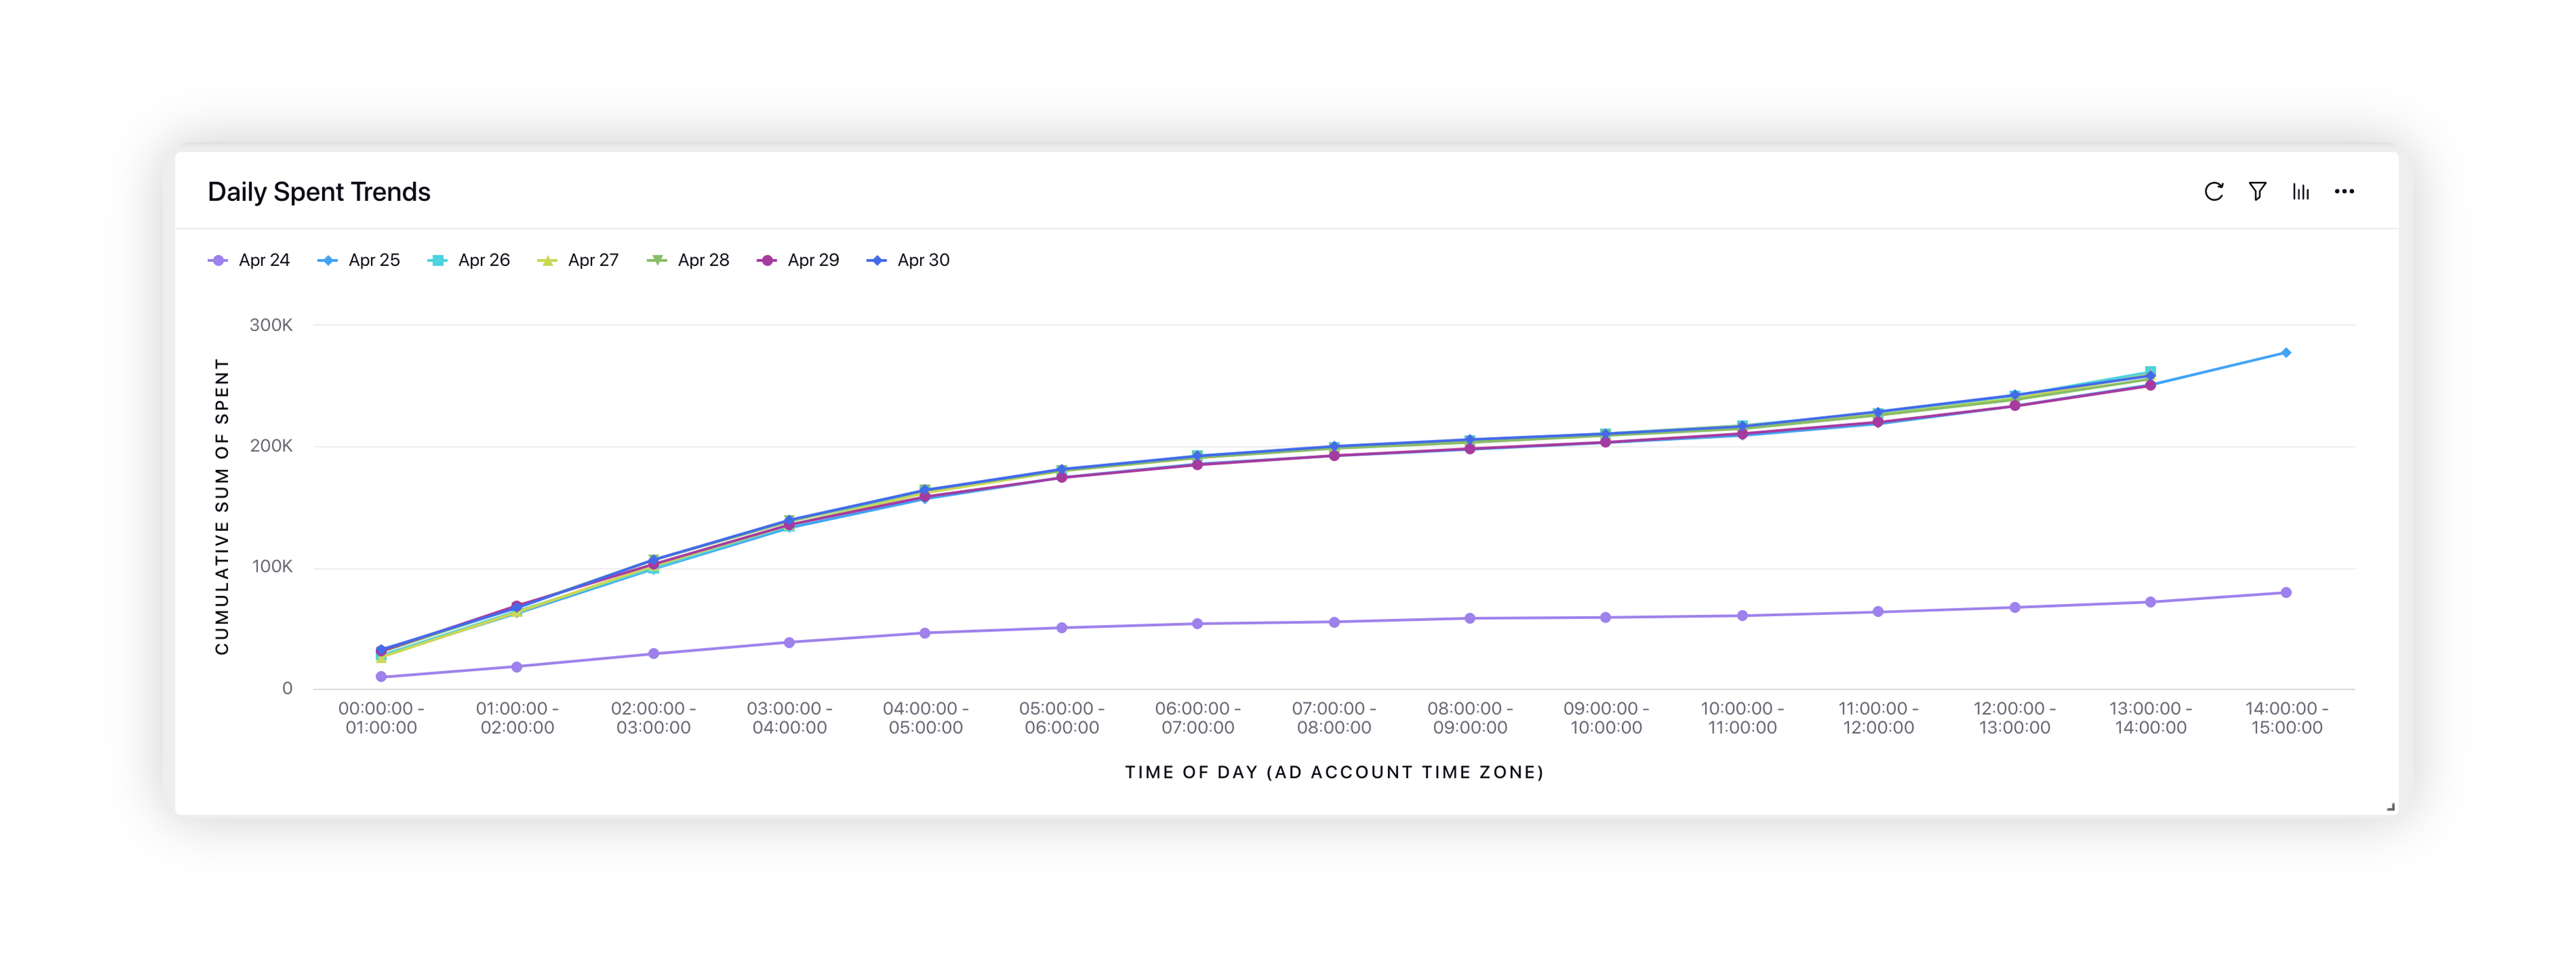
Daily Spent Trends
View day-over-day changes in the Pacing Control inputs and analyze your daily spend limit set on a particular date, and how much of the budget was spent on that day. The widget highlights:
Note that you will not be able to see daily spend trends for the channels where hourly spend data is not supported.
|
|
Pacing Initiative Duration (Days)
View your pacing initiative duration. The widget highlights:
| |
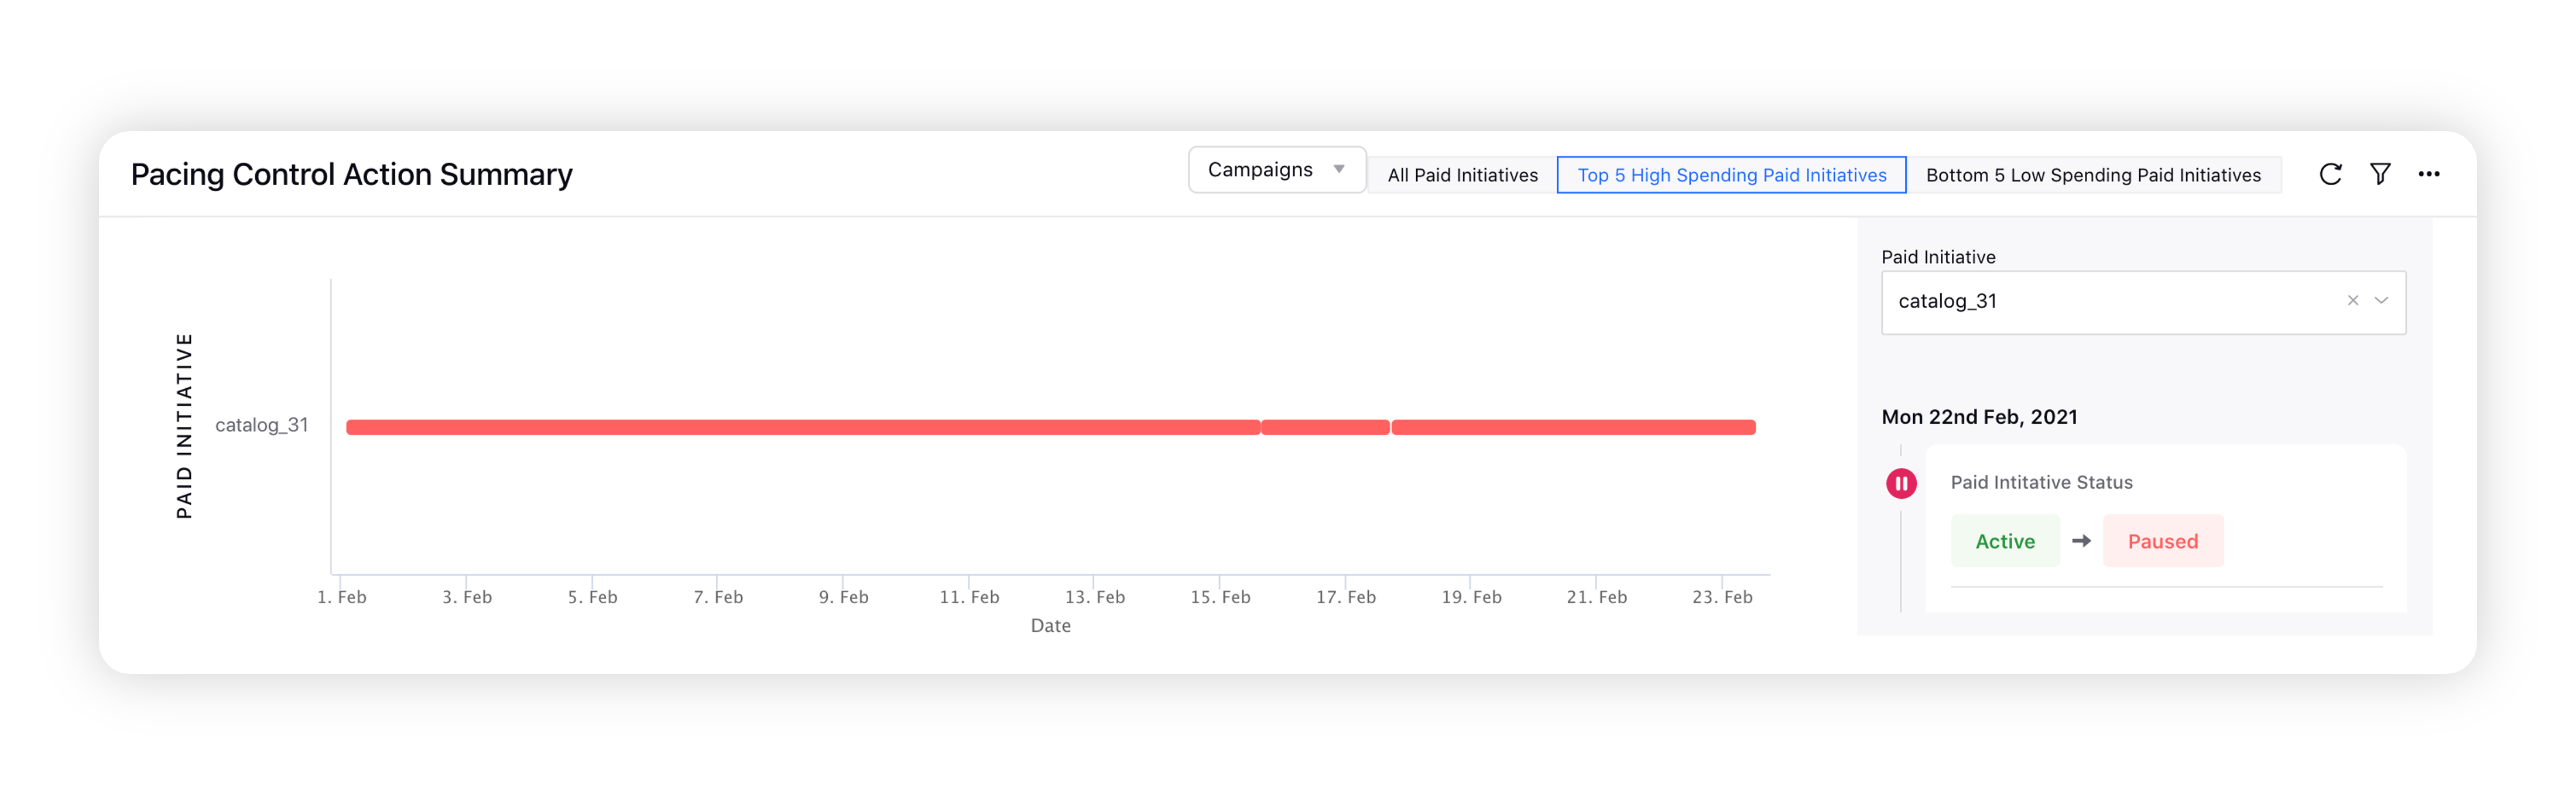
Pacing Control Action Summary View pacing control action summary of Campaigns, Ad Sets, and Ad Variants. You can also view the Top 5 High/Low Spending entities in your advertising effort with a single click. Double click on any projection of the reporting data to view the audit trail such as a change in the Ad Entity Status from the right-hand pane. You can view all the changes in the Audit Trail view. Note: You can monitor and control spending on ad entity or account level based on commonly defined periods – daily/ weekly/ monthly etc., for channels within Manual Pacing control. |
|