Unified Monitoring Dashboard
Updated
The Unified Monitoring dashboard consolidates agent, queue, campaign, and other live monitoring screens into a single interface. Supervisors can manage all aspects of their operation from one screen, reducing the need to switch between different monitoring screens and enabling more informed, real-time decision-making.
Note: To enable this feature, reach out to your Success Manager or submit a request at tickets@sprinklr.com.
Key Features
The following are the key features of the Unified Monitoring dashboard:
Unified View: The dashboard combines multiple live monitoring screens such as Agents, Callback Manager, and Case, into a single view.
Integration with Multiple Data Sources: The dashboard supports integration with various internal and external data sources, including Sprinklr, Salesforce, Cisco, and other supported monitoring systems.
Customizable Layout: Supervisors can customize the dashboard to display the data most relevant to their requirements. They can configure which data sources to display and set custom refresh rates for data streams.
Real-Time Updates: Supervisors can receive real-time updates for anomalies or threshold breaches. They can set alerts for specific thresholds, such as high call wait times or agent inactivity.
Drill-Down Capabilities: Supervisors can click on data points to access more detailed metrics. They can use the drill-down feature for metrics to explore granular data.
Access Unified Monitoring Dashboard
After the feature is enabled for your environment, follow these steps to access the dashboard:
1. Open the Supervisor Console persona app from the Launchpad.
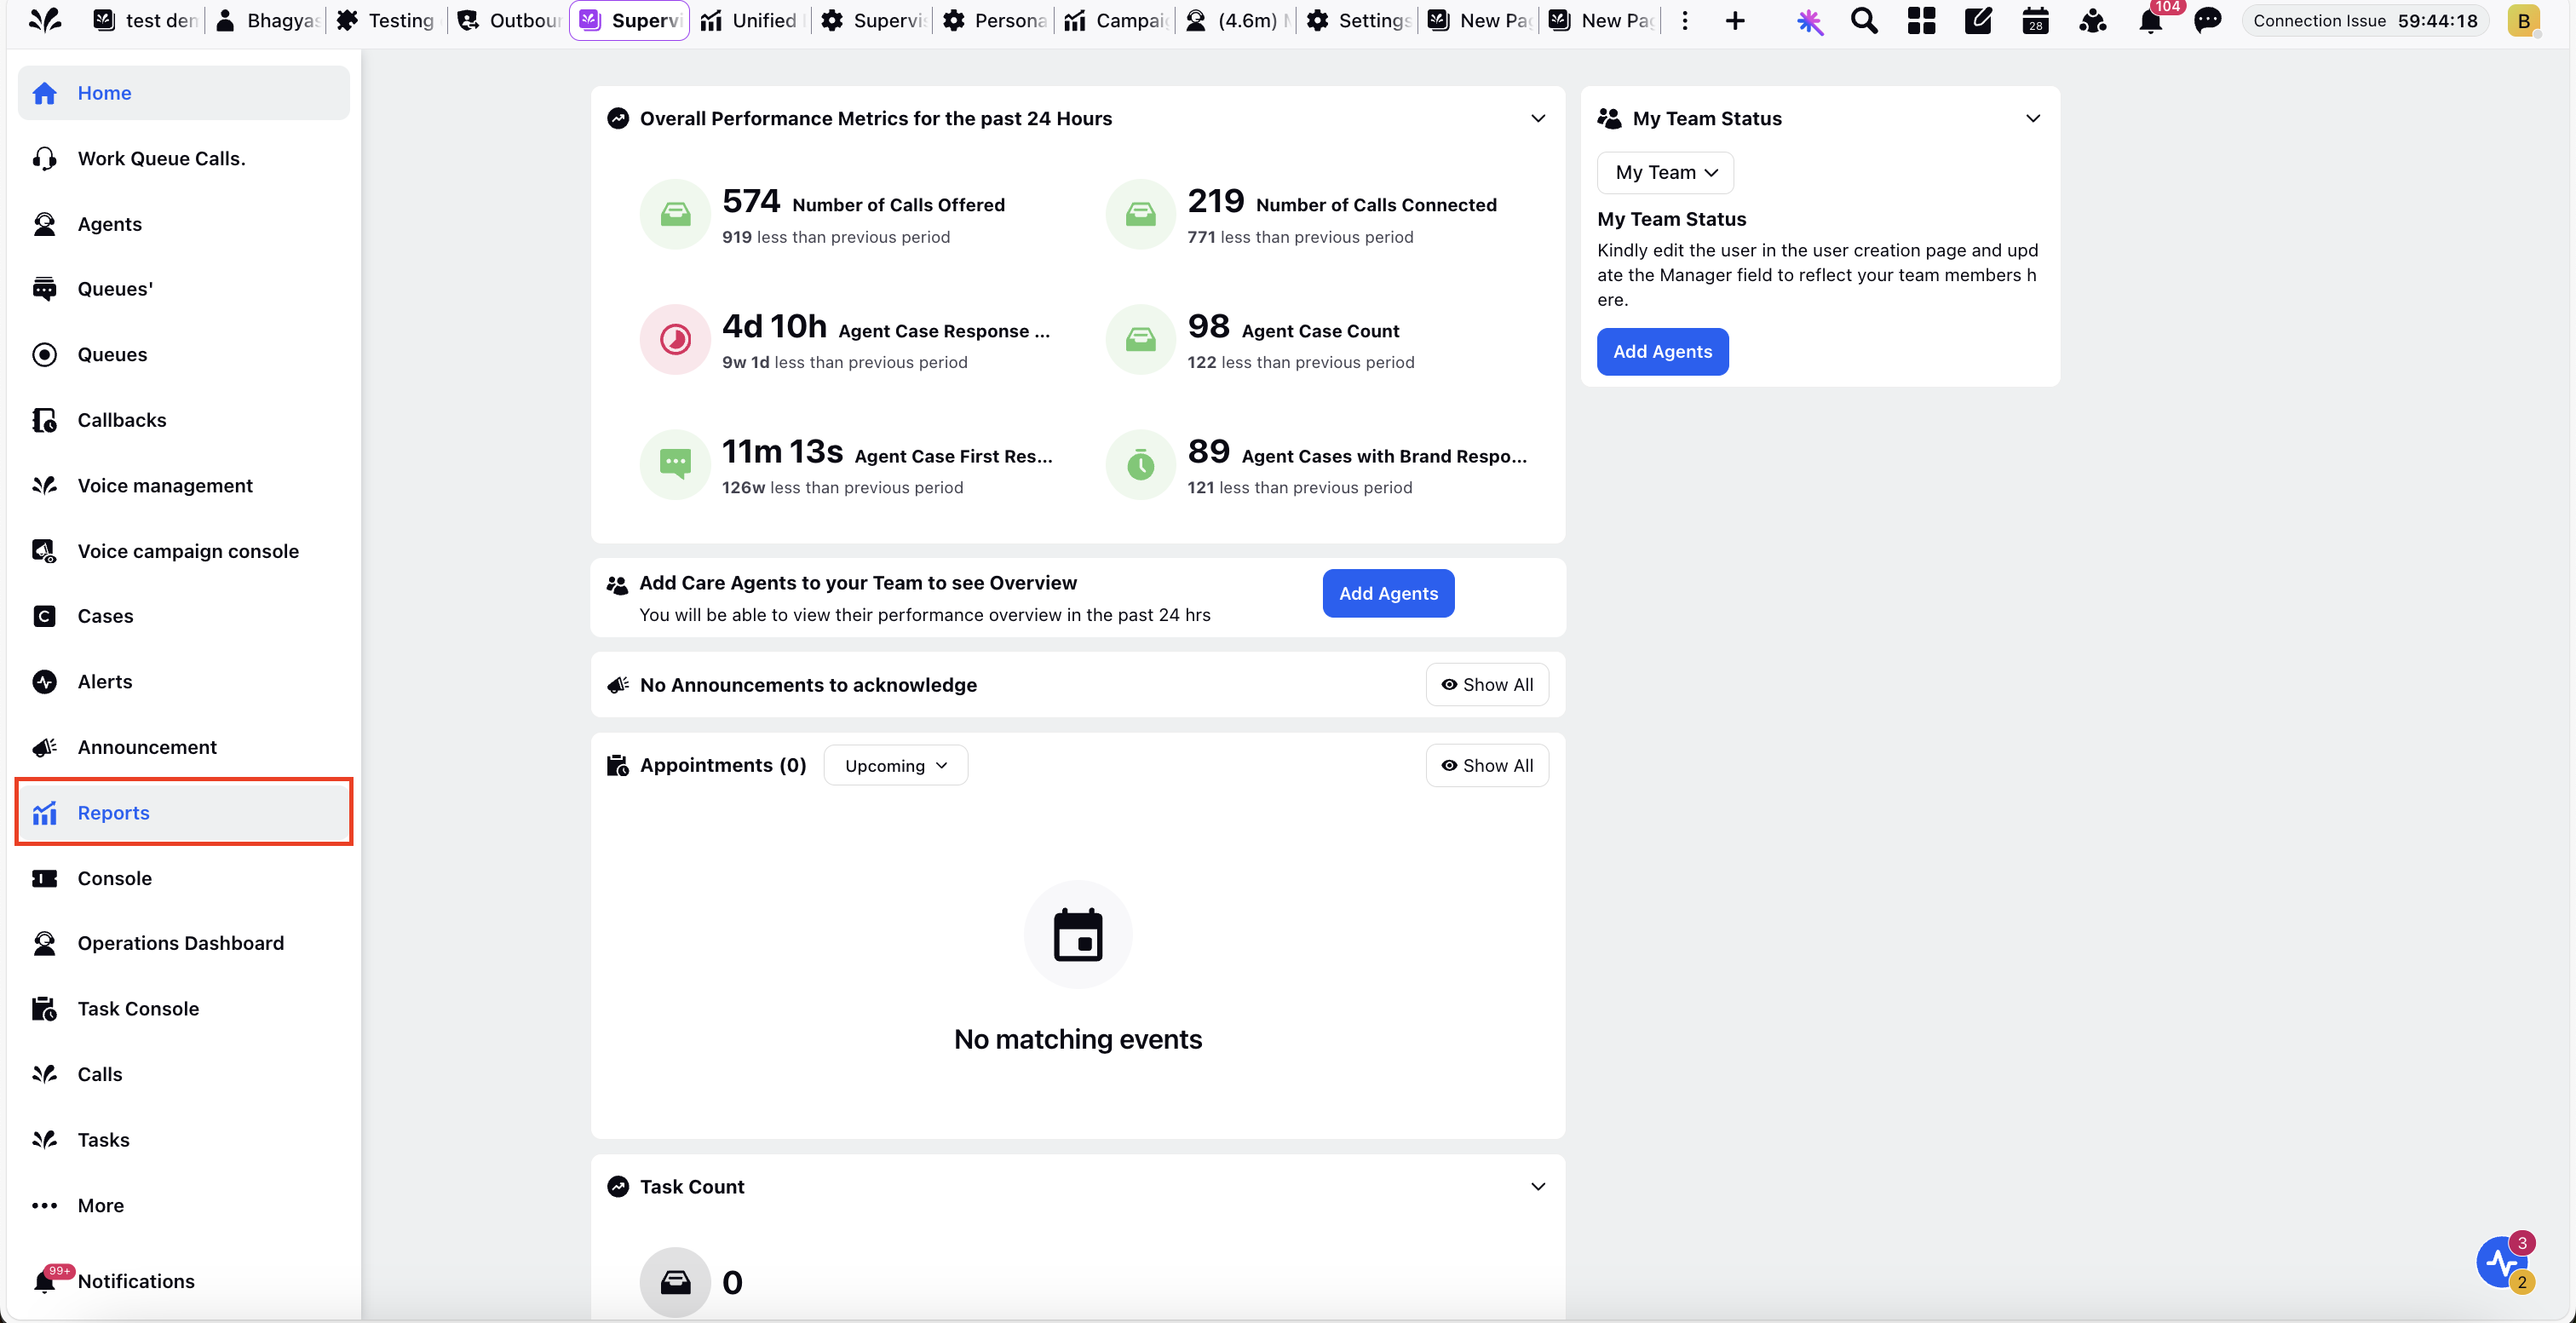
2. In the left pane, click Reports.
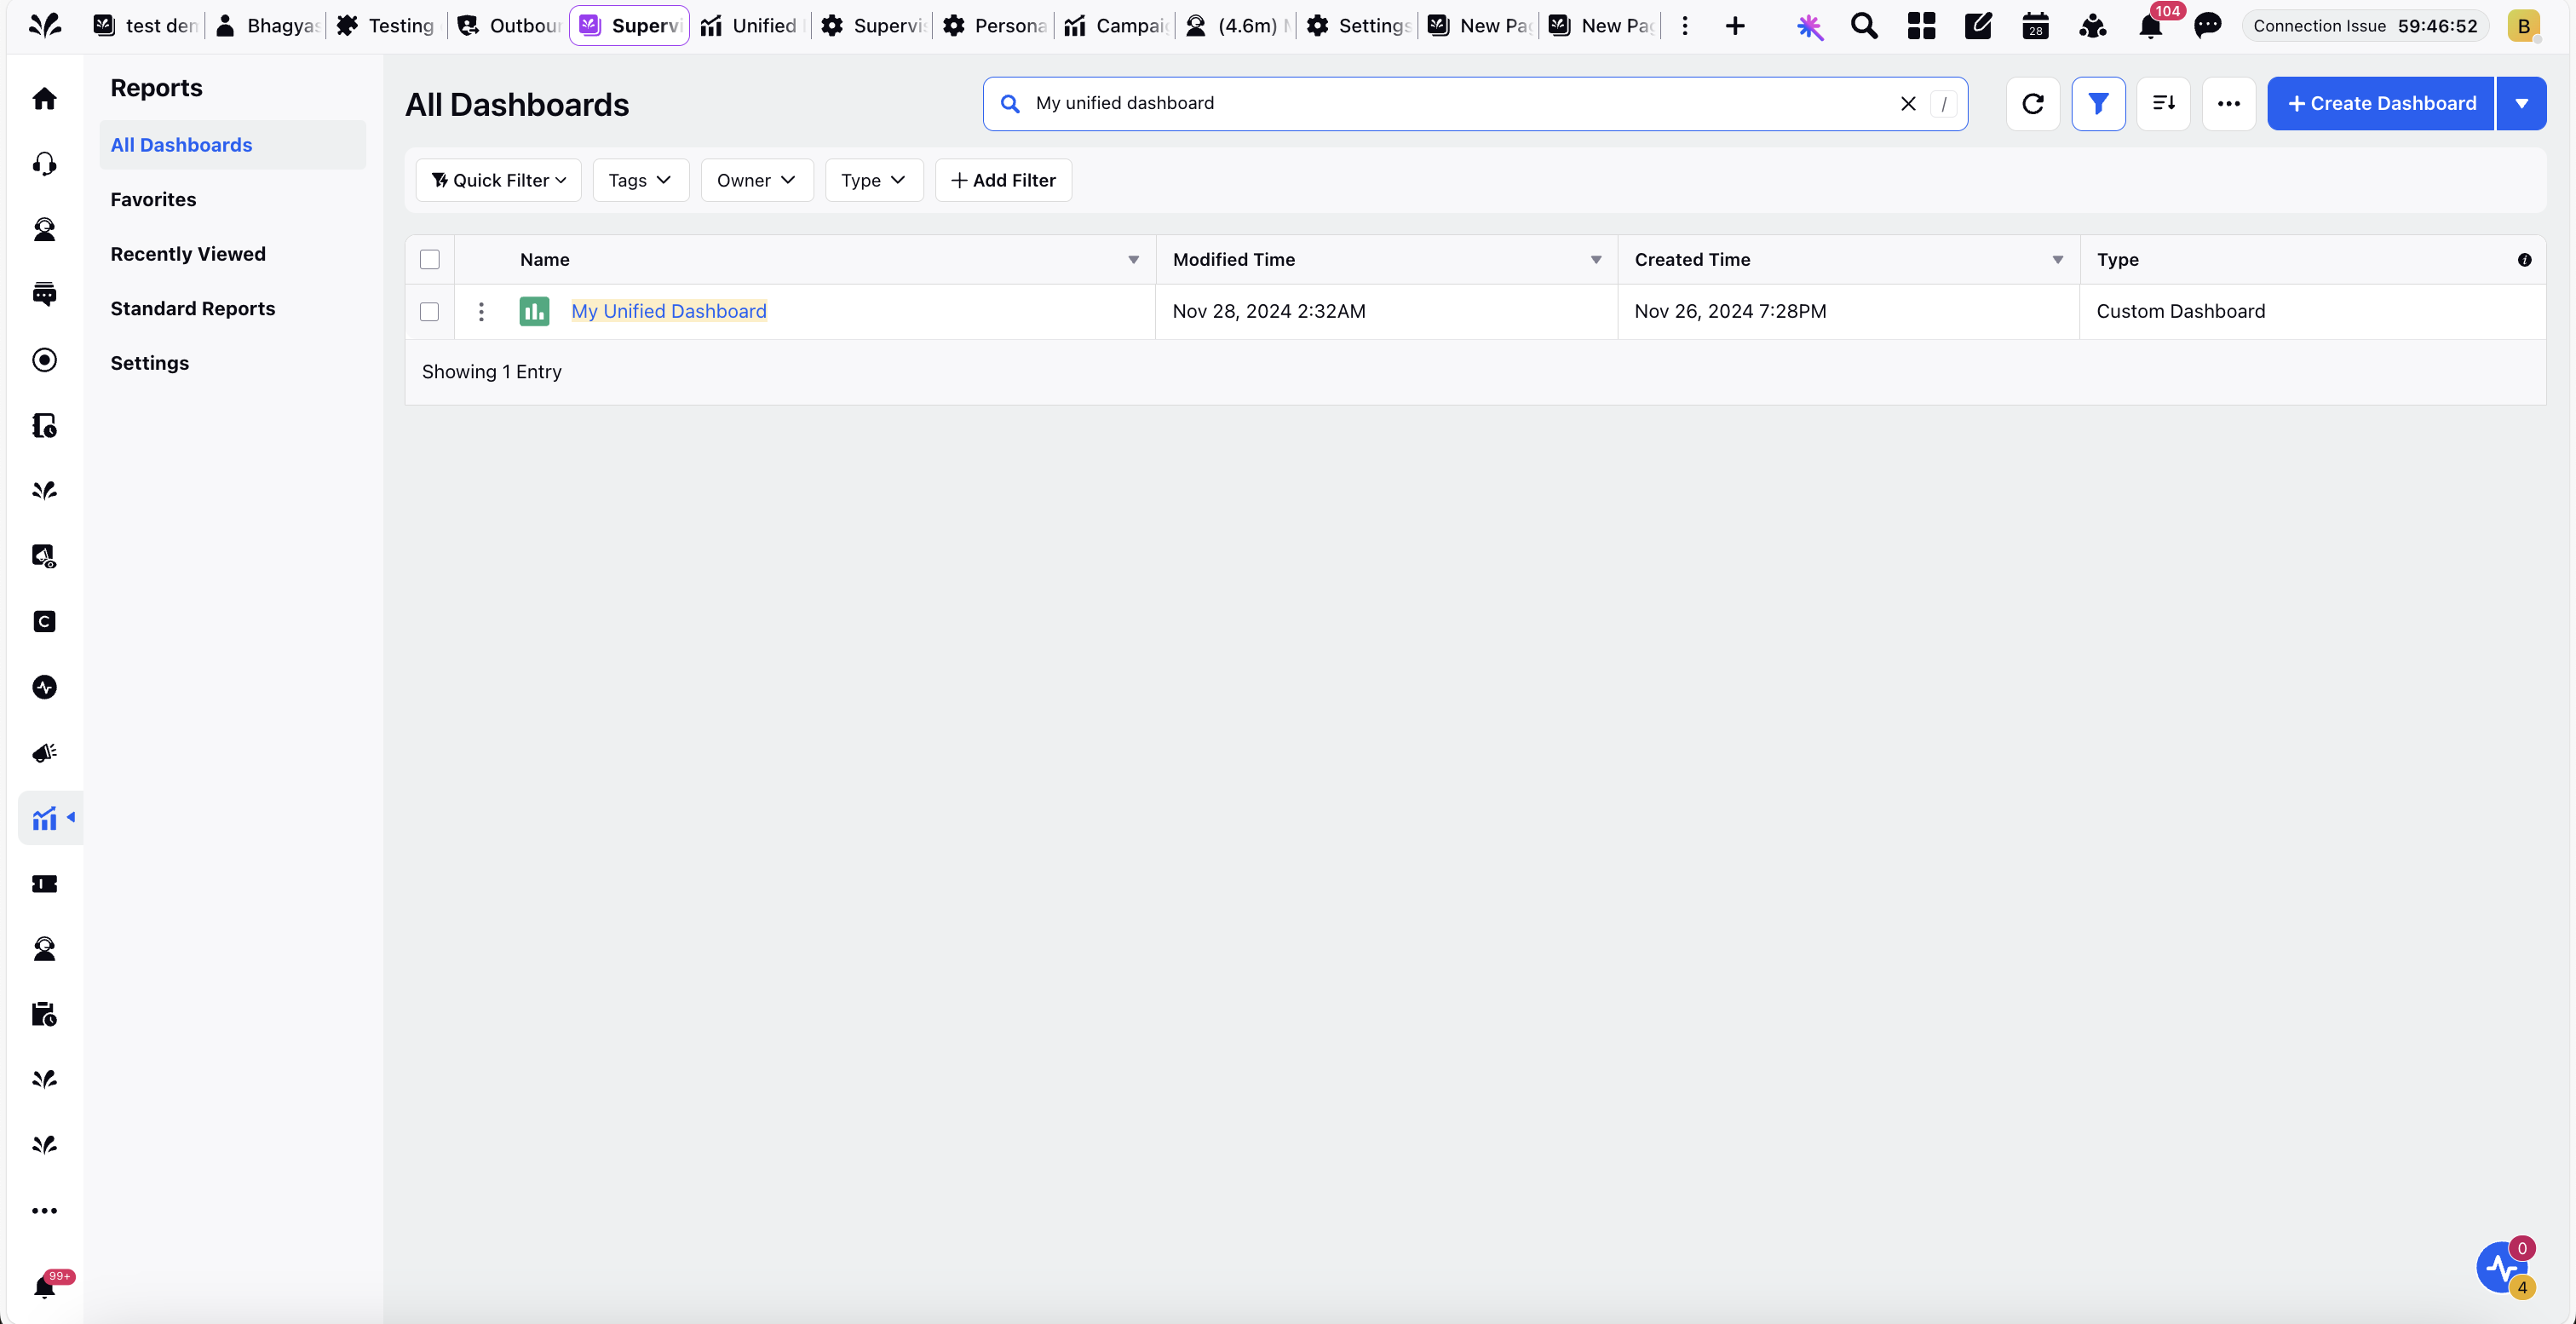
3. In the Reports menu, click All Dashboards.
4. Search for the dashboard by name.
5. Click on the desired dashboard to open it.
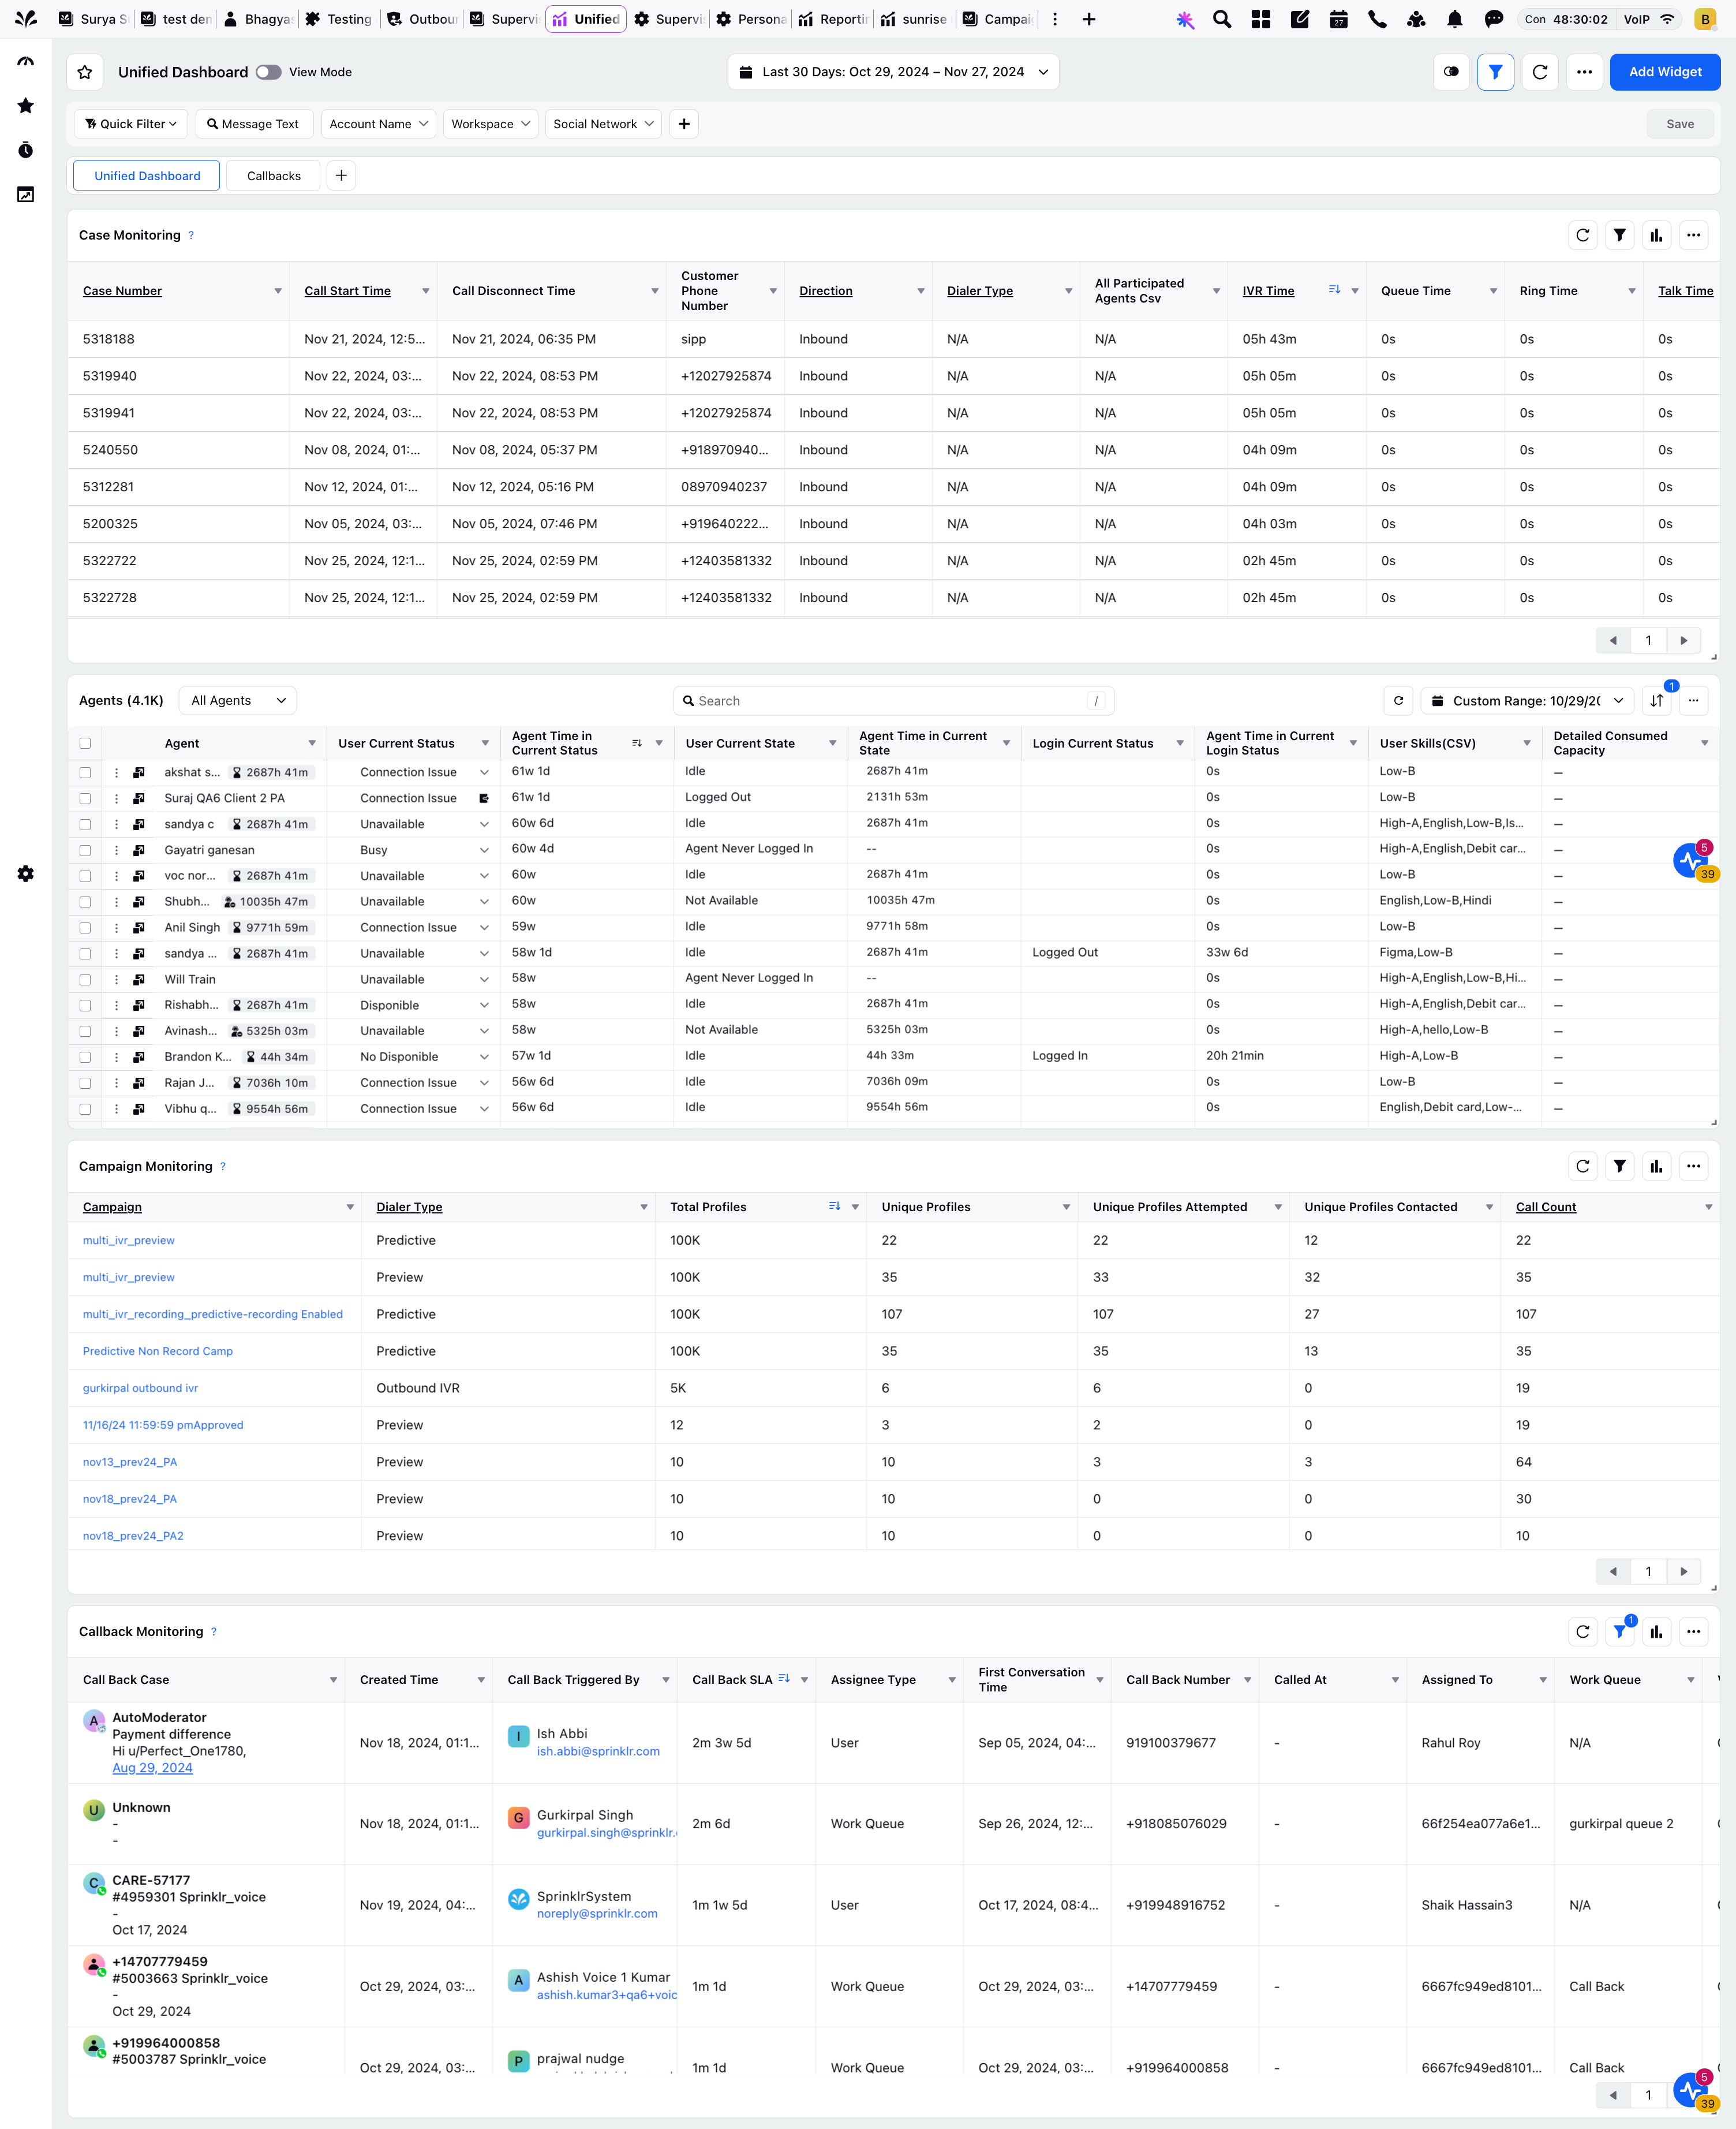
The following unified dashboard is displayed:
Using Unified Monitoring Dashboard
On the Unified Monitoring dashboard, supervisors can do the following:
Set the Date Range
Select a specific date range for which you want to analyze the data on the live monitoring screens.
Add Widgets
Use the Add Widget button to add any widget of your choice to the dashboard for enhanced monitoring. For example, you can add a widget for monitoring Work Queues.
Apply Quick Filters
Use existing quick filters or create a new quick filter that you use frequently to filter the entries on the live monitoring screens based on criteria.
View Live Monitoring Screens
Depending on the configuration, the following live monitoring screens are displayed:
Note: You can use the Add Widget option to add a live monitoring screen that you want to monitor from the Unified Monitoring dashboard.
Case Monitoring
The Case Monitoring widget enables supervisors to track cases created within the selected date range. It displays key case details such as call start time, call disconnect time, customer phone number, Work Queue details, and more. Supervisors can click on a case number to view additional case properties and details.
Agents
The Agents widget provides supervisors a comprehensive overview of agents activity. Supervisors can monitor agent availability, current cases, and activities in real time, enabling them to proactively manage and support their team.
Supervisors can perform various actions directly from the agents list, including updating skills, viewing agent activity, sending a message to the agent, exporting agent activity, and more. They can also access the agent details pane to view agent details, properties, activity, coaching sessions, and time-off records.
For more details, see Agent Monitoring.
Campaign Monitoring
The Campaign Monitoring widget allows supervisors to track and manage voice campaigns. Supervisors can view key campaign details, such as dialer type, number of profiles reached, call count, and more. By clicking on a campaign in the campaign list, supervisors can view its associated properties and details.
For more details, see Campaign Monitoring.
Callback Monitoring
The Callback Monitoring widget enables supervisors to view the callbacks scheduled by their agents. Supervisors can see key callback details, such as the agent name, callback status, callback time, and more. By clicking on a campaign, they can access its associated properties and details. Double-clicking on a callback opens a detailed view, displaying the related case, conversation history, and customer profile.
To take action on the callbacks, supervisors can use the Callback Manager within the Supervisor Console.
Take Actions on Calls
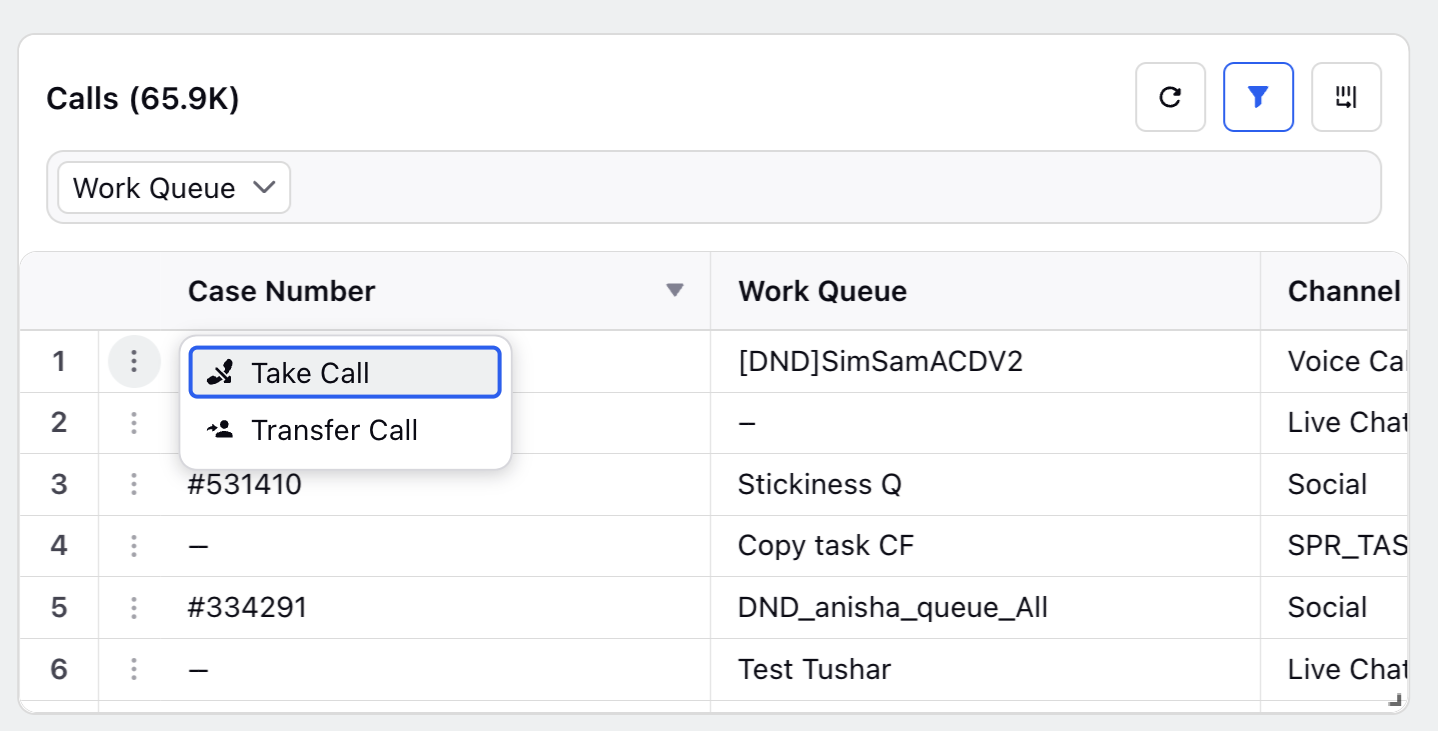
Supervisors can monitor and take action on calls waiting in the queue directly from the Unified Monitoring dashboard. By either taking calls themselves or transferring the calls to another agent, they can manage call queues more effectively and reduce customer wait times.
Take a call
To take a call, follow these steps:
1. In the unified dashboard, go to the Calls widget.
2. Click the three-dot icon next to the case number.
3. Click Take Call.
Transfer a call
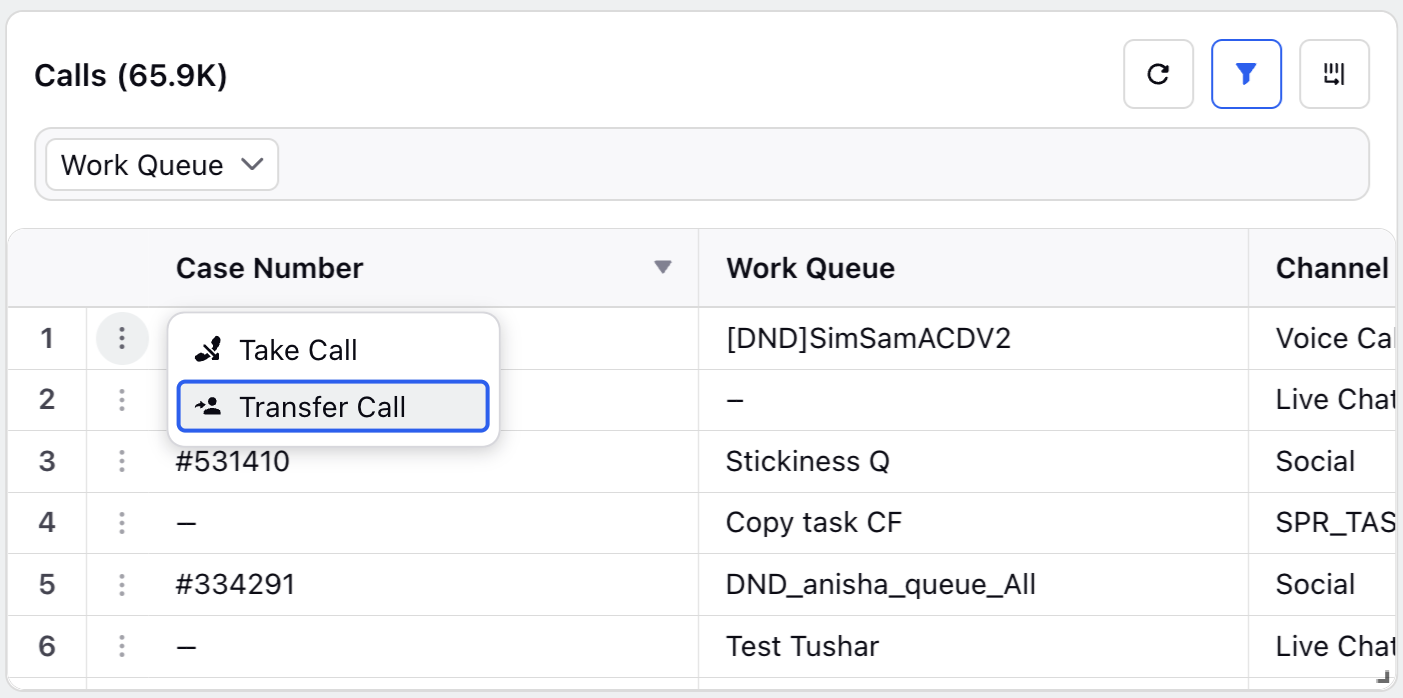
To transfer a call, follow these steps:
1. In the unified dashboard, open the section that includes the Calls widget.
2. Click the three-dot icon next to the case number.
3. Click Transfer Call.
4. In the pop-up window, choose whether to transfer the call to a queue or an agent.
From the Transfer To drop-down, select Queue or Agent.
Depending on your selection, the queue or agent drop-down is displayed.
5. Select the desired queue or agent.
6. Click Transfer Call.
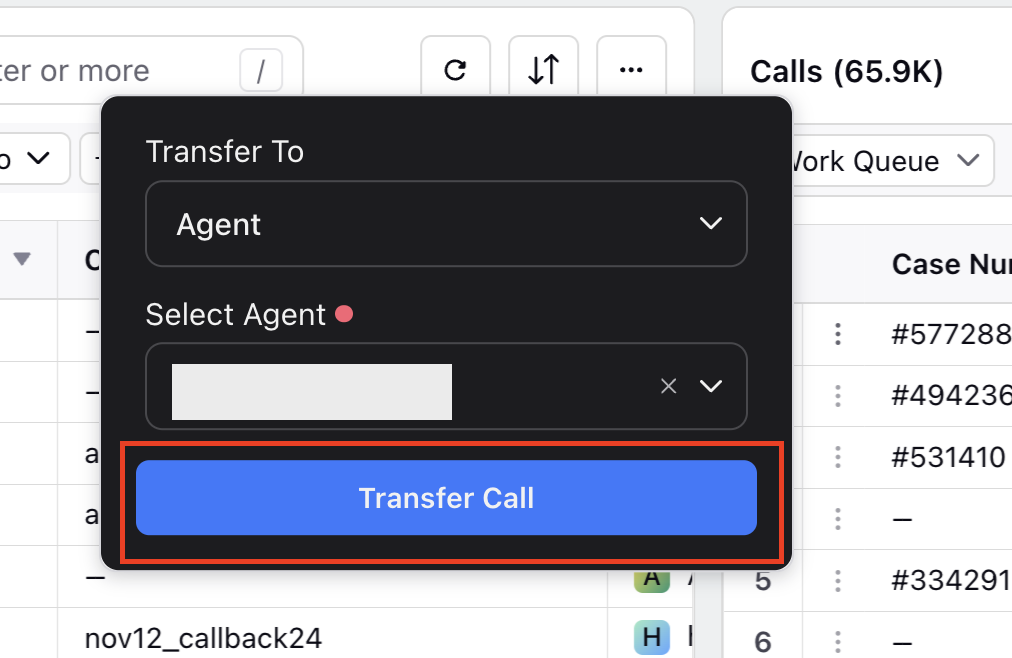
The call is now transferred to the selected queue or agent.
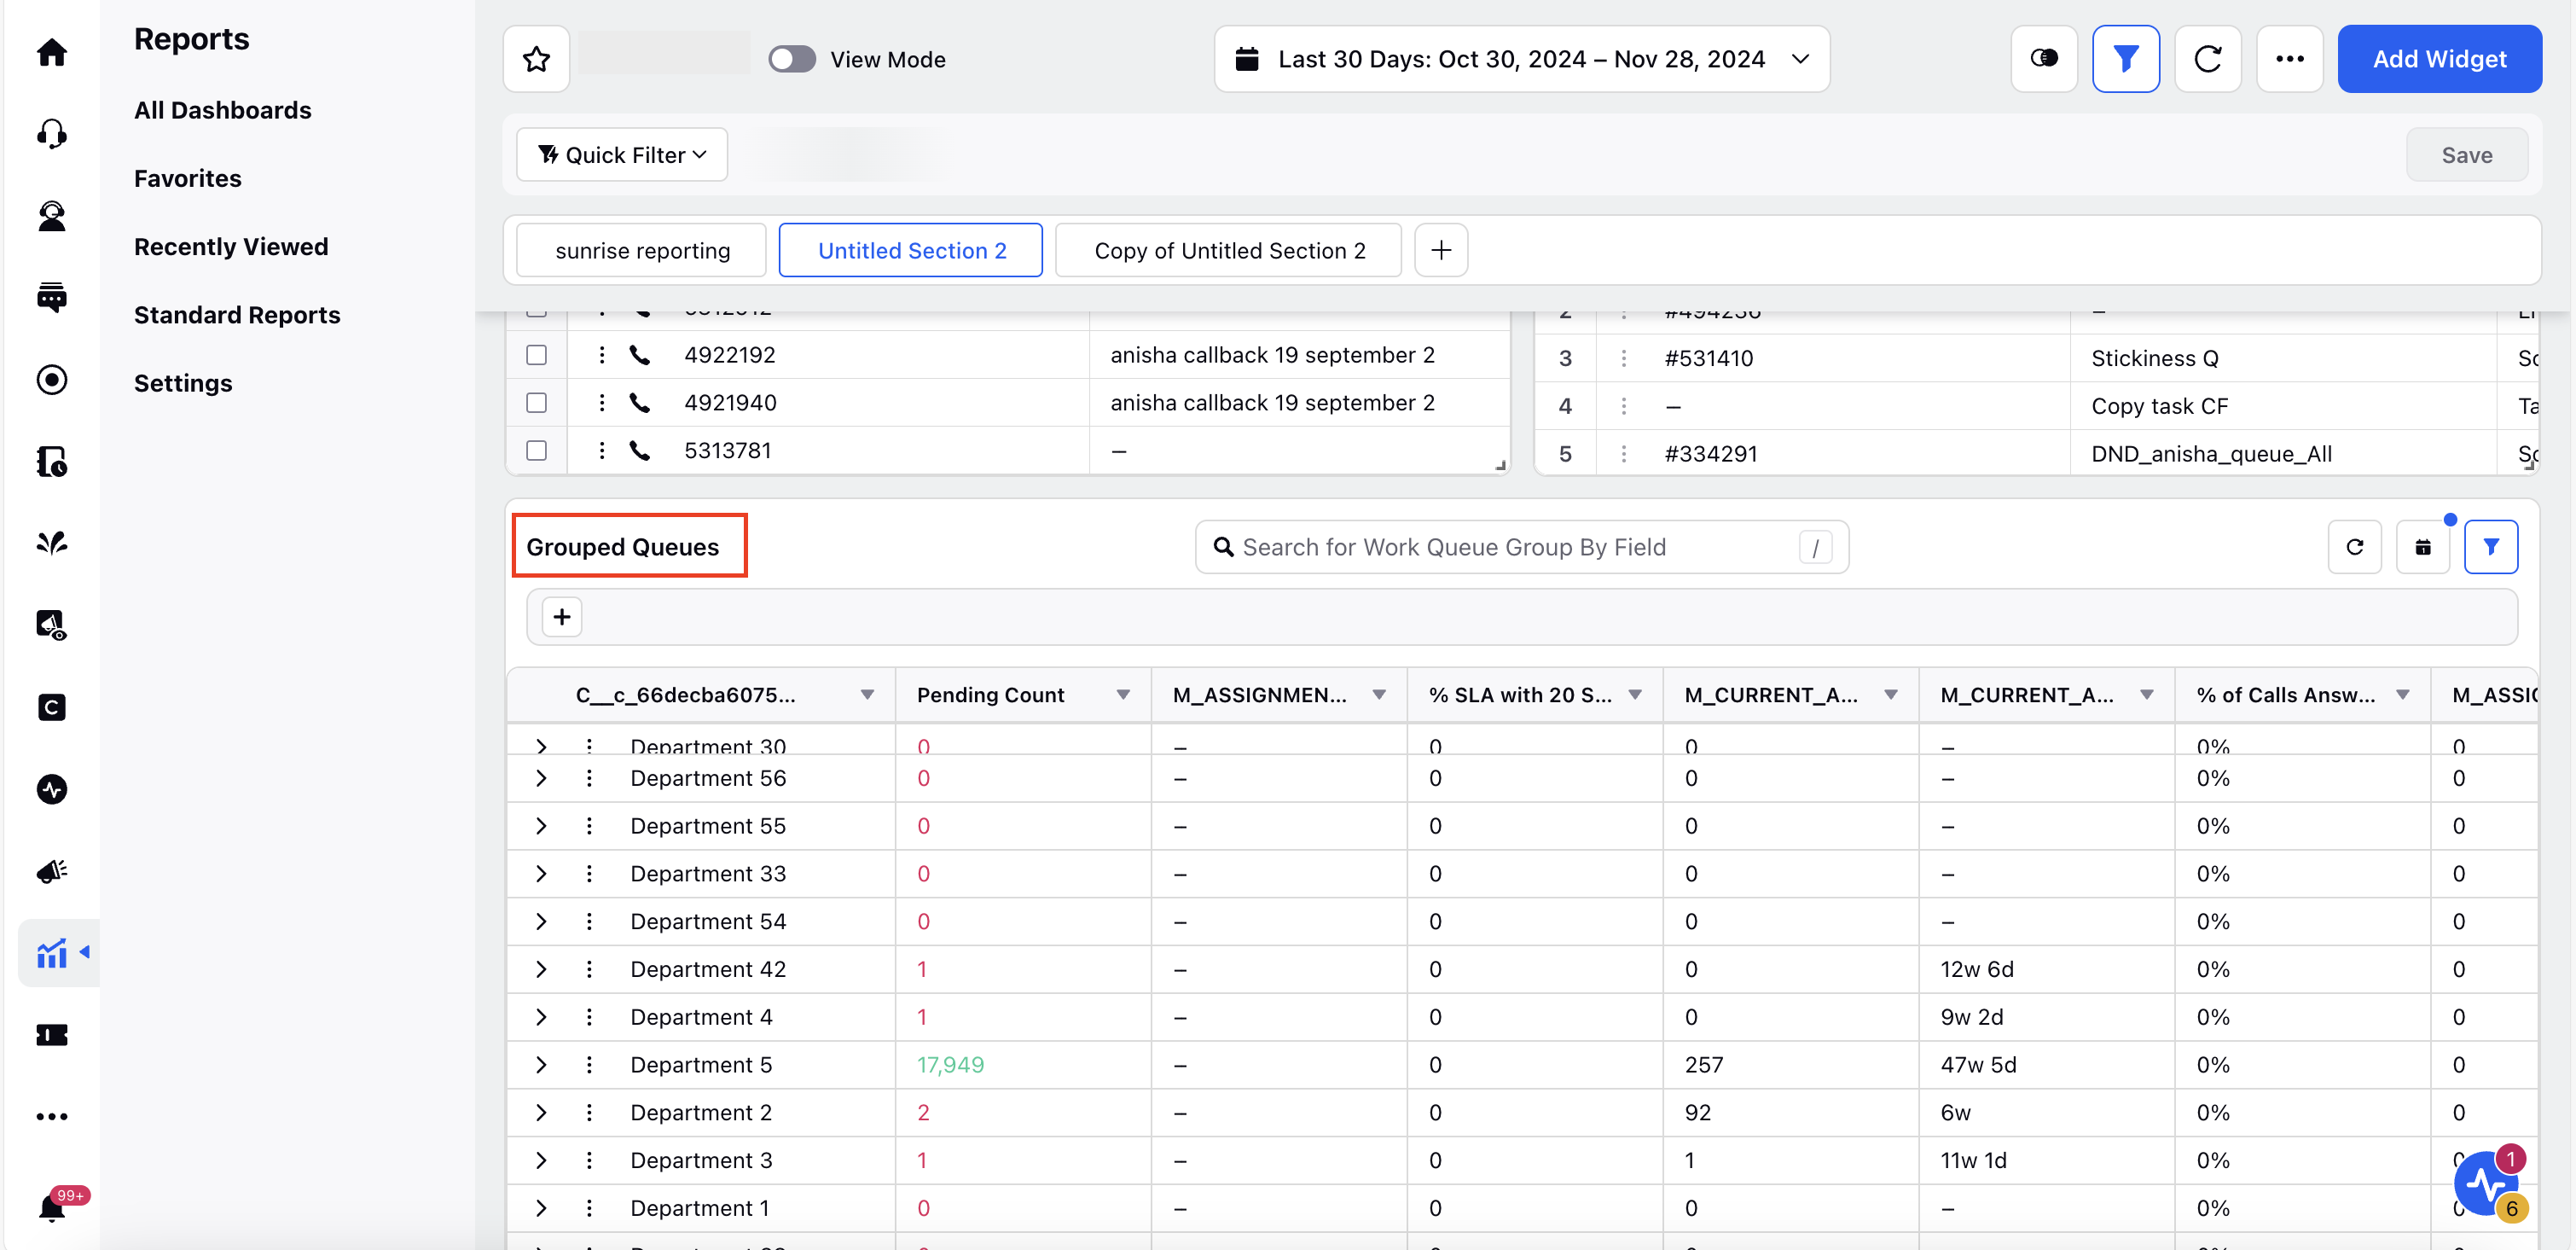
Monitor Work Queue Groups
Supervisors can view reports at the Work Queue group level. This enables supervisors to analyze multiple Work Queues, for example, they can analyze all Work Queues assigned to a specific department.
This report includes key metrics such as queue summaries, agent status, agent states, and lists of agents with their respective details across multiple Work Queues. This allows for better visibility and management of Work Queues performance.
To monitor a Work Queue group, ensure that Work Queue group is enabled in your Supervisor Console. Then, the Grouped Queues widget needs to be added in the unified monitoring dashboard.
