Agent Usage
Updated
Tracking agents' use of articles while handling cases is essential for understanding the effectiveness of your knowledge base. This article covers reporting that helps monitor which articles are being utilized, how frequently they are accessed, and their impact on case resolution.
Note: The Widget configurations mentioned in this article, including Metrics, Dimensions, and filters, are intended as guidelines. You can adjust and customize them to suit your specific requirements.
Smart Assist: Knowledge Base
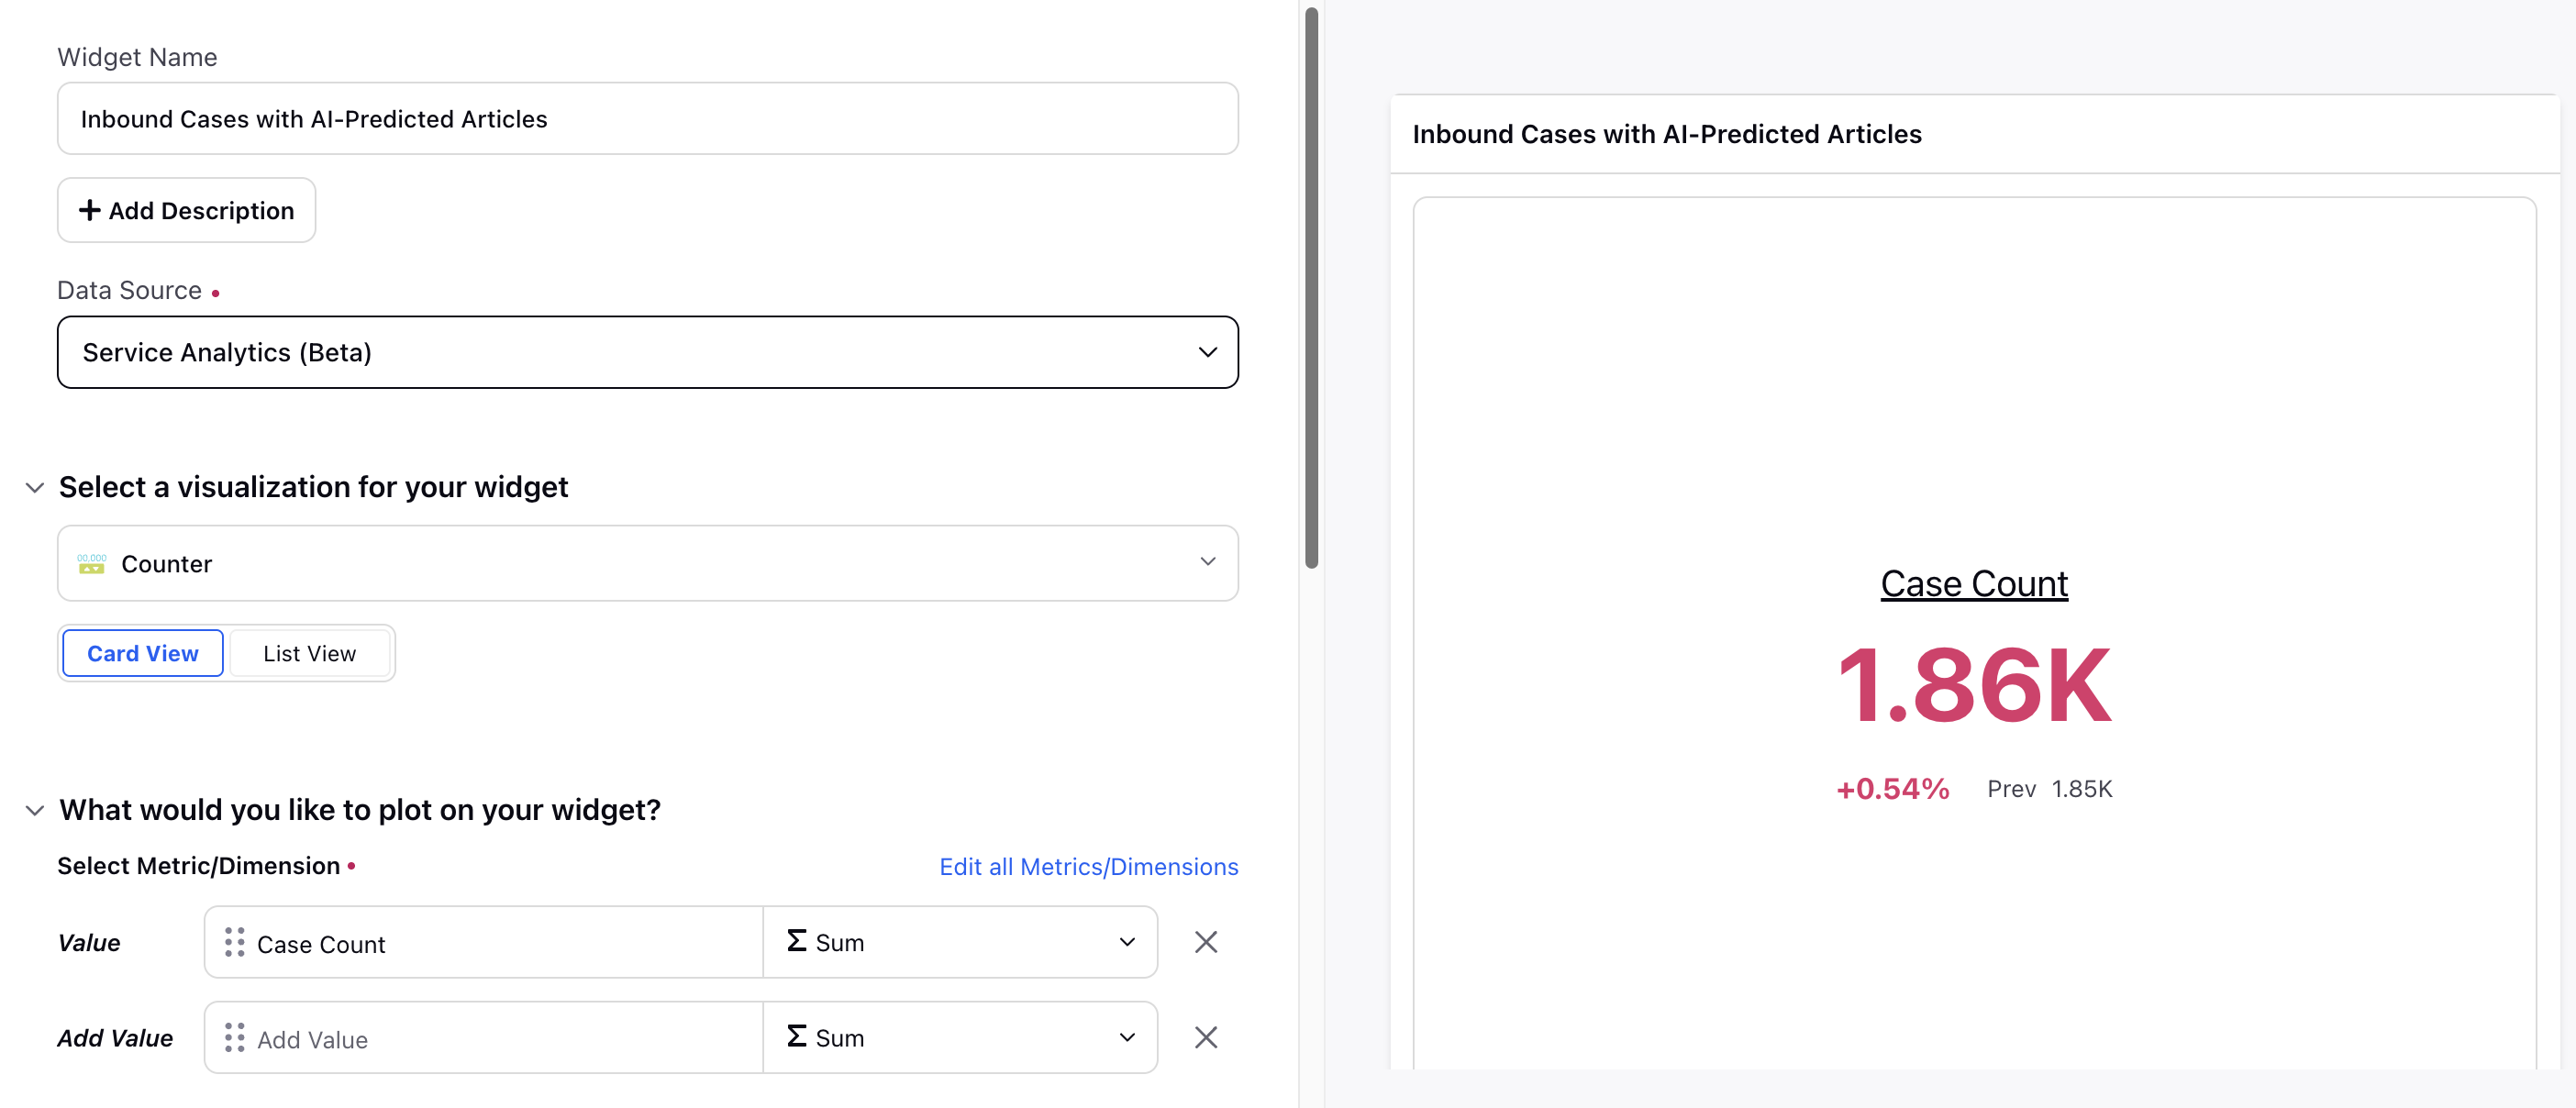
Number of Inbound Cases with AI-Predicted Articles
Monitoring the use of AI-predicted articles in resolving inbound cases showcases the enhancements in efficiency and accuracy achieved through AI integration. This section lists the required Widget configuration (including Metrics, Dimensions, and filters) to get the number of inbound cases in which AI-predicted articles were shown.
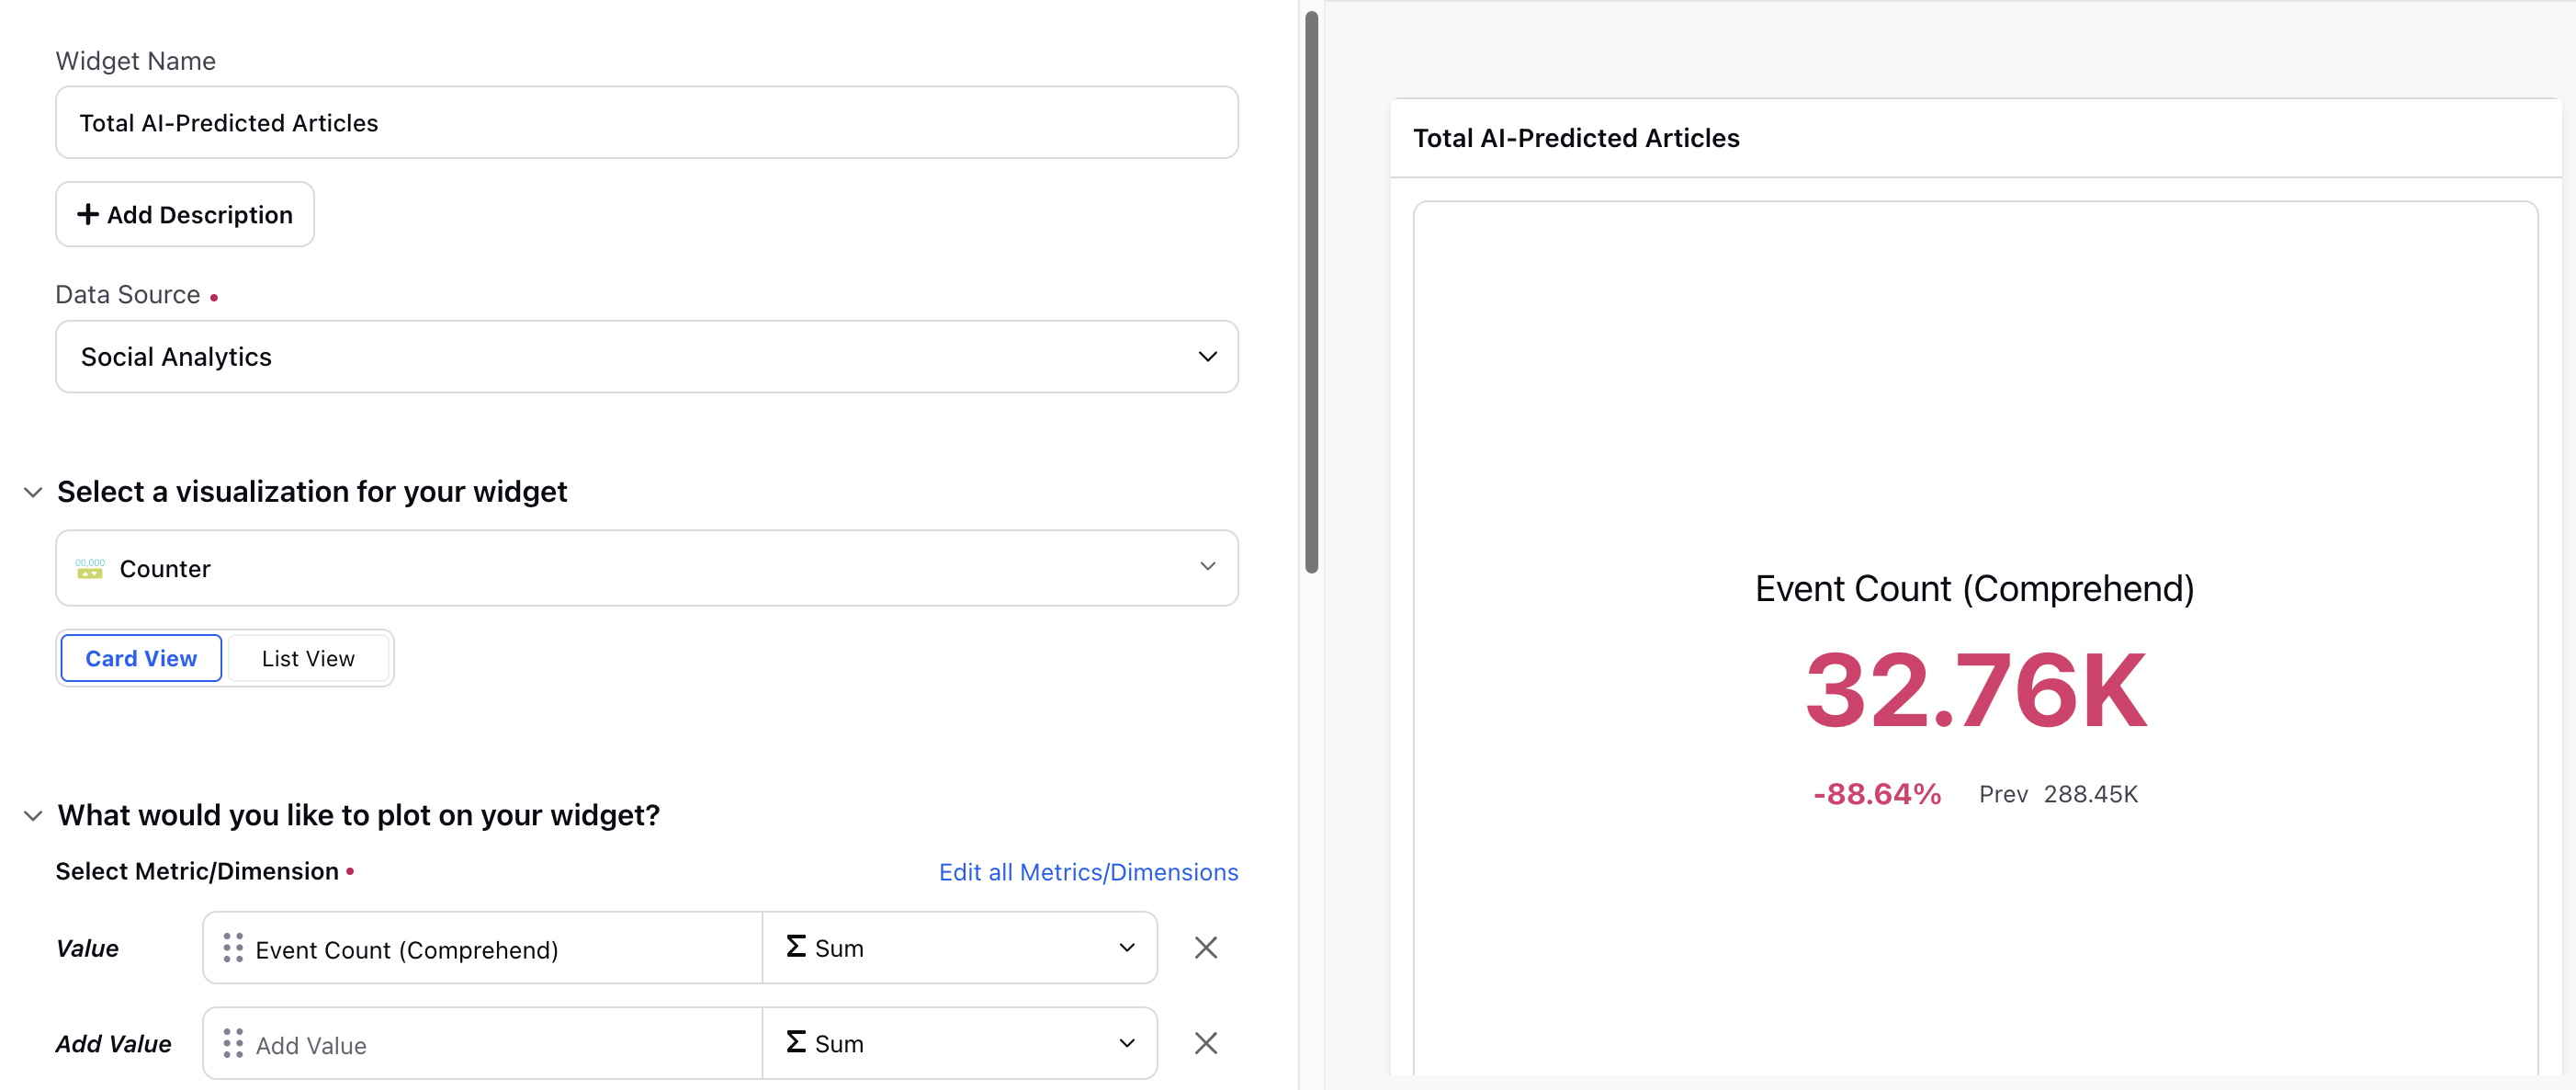
Total AI-Predicted Articles
Tracking the total number of articles AI suggests in Smart Assist highlights AI's role in enhancing knowledge management and case resolution. This section lists the required Widget configuration (including Metrics, Dimensions, and filters) to get the total number of AI-predicted articles in Smart Assist.
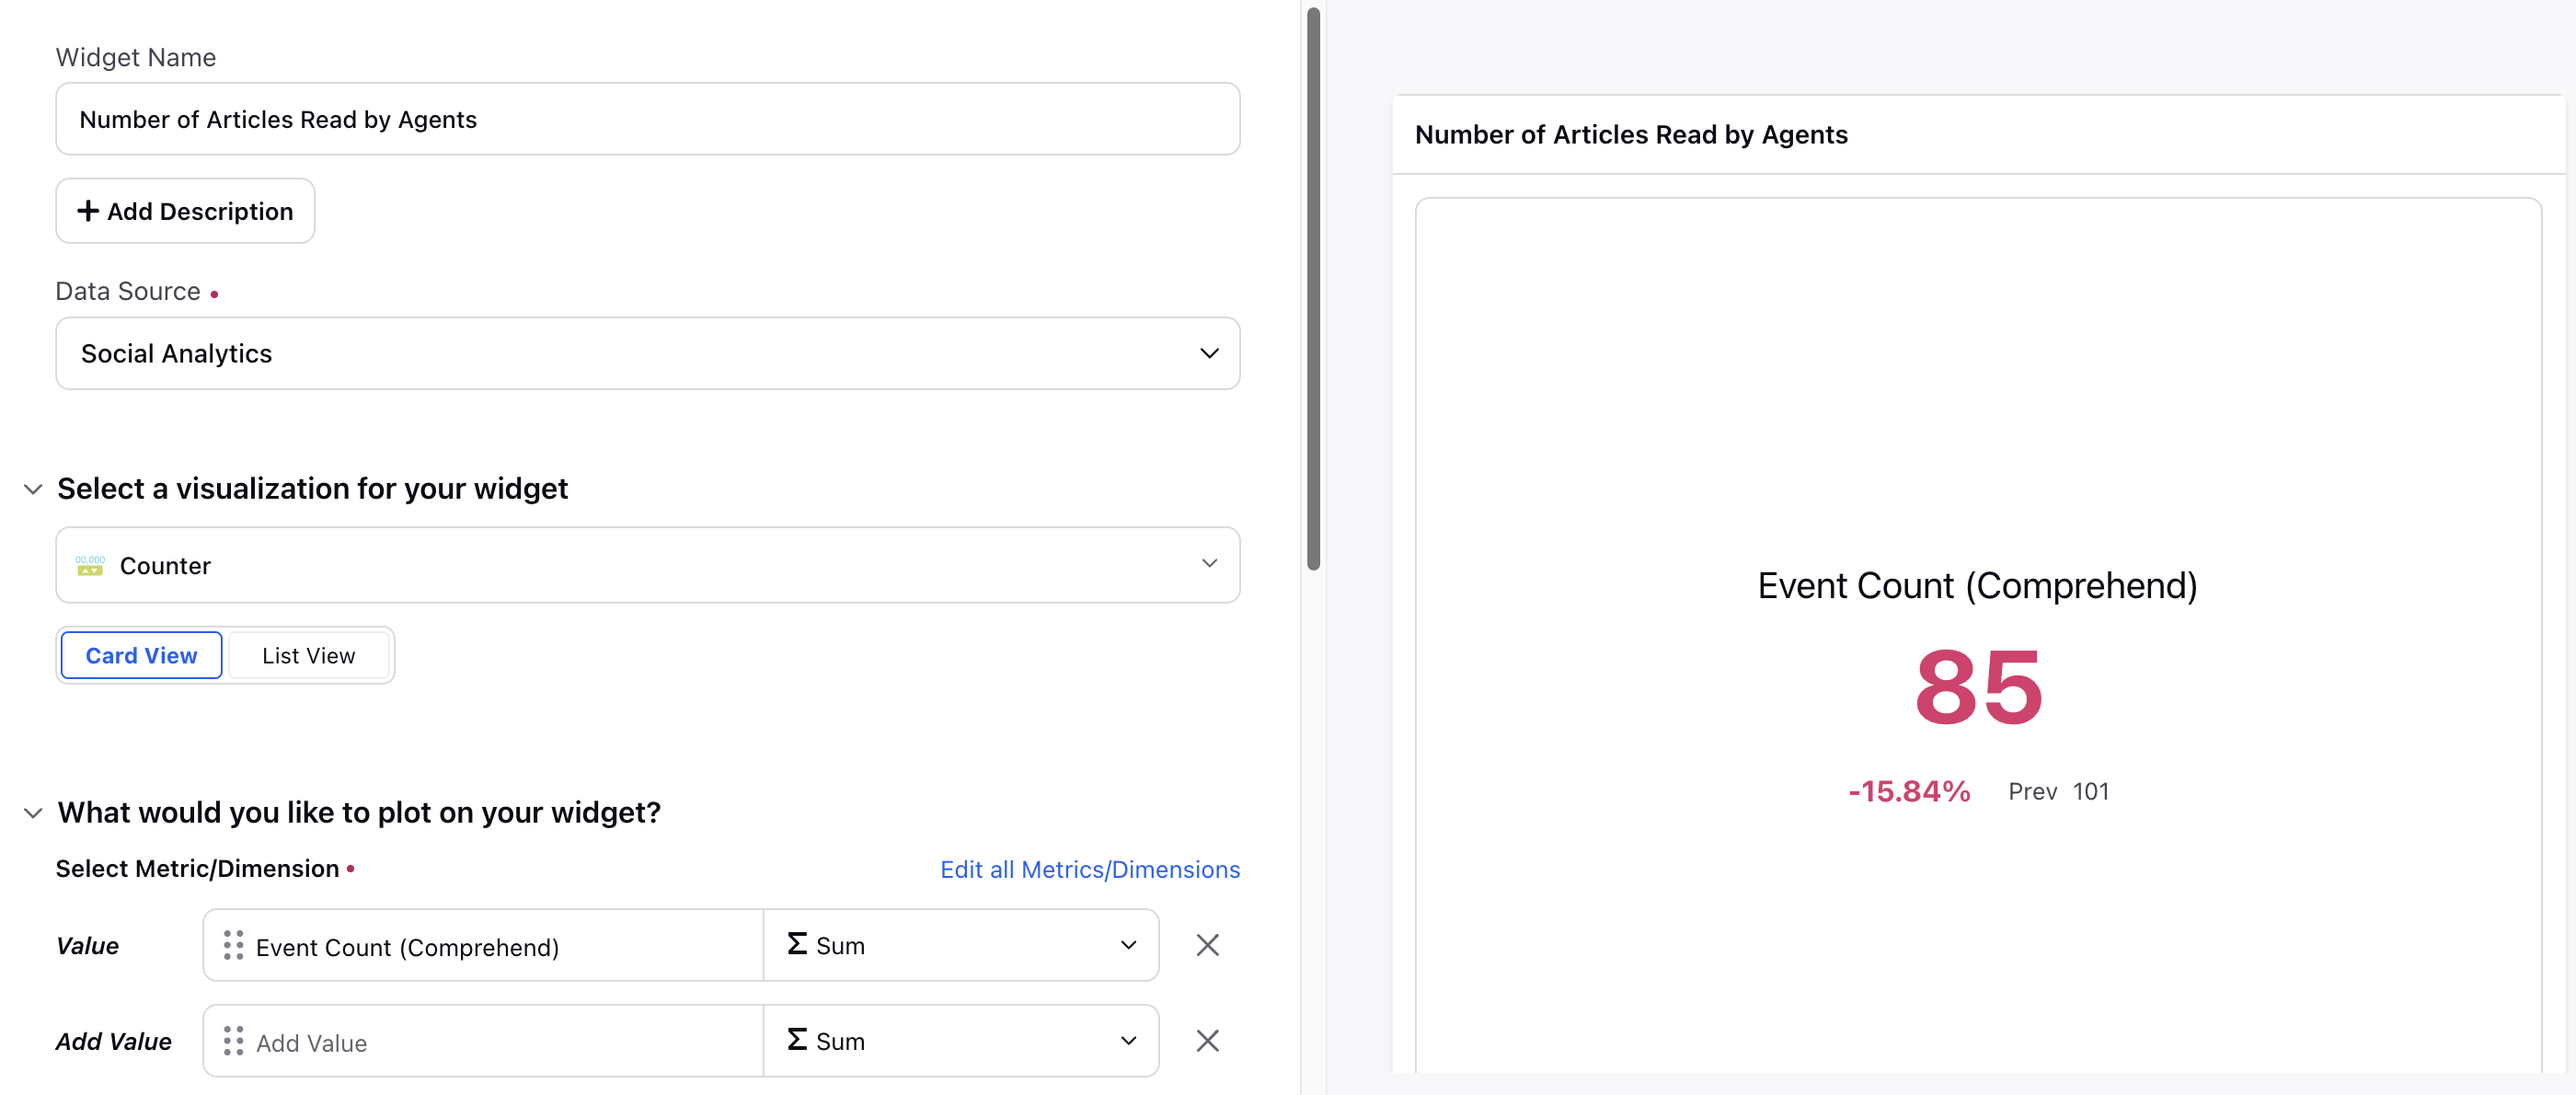
Number of Articles Read by Agents
Analyzing the number of articles read by agents provides insights into the most accessed resources and their impact on agent performance. This section lists the required Widget configuration (including Metrics, Dimensions, and filters) to calculate the number of articles read by agents in Smart Assist.
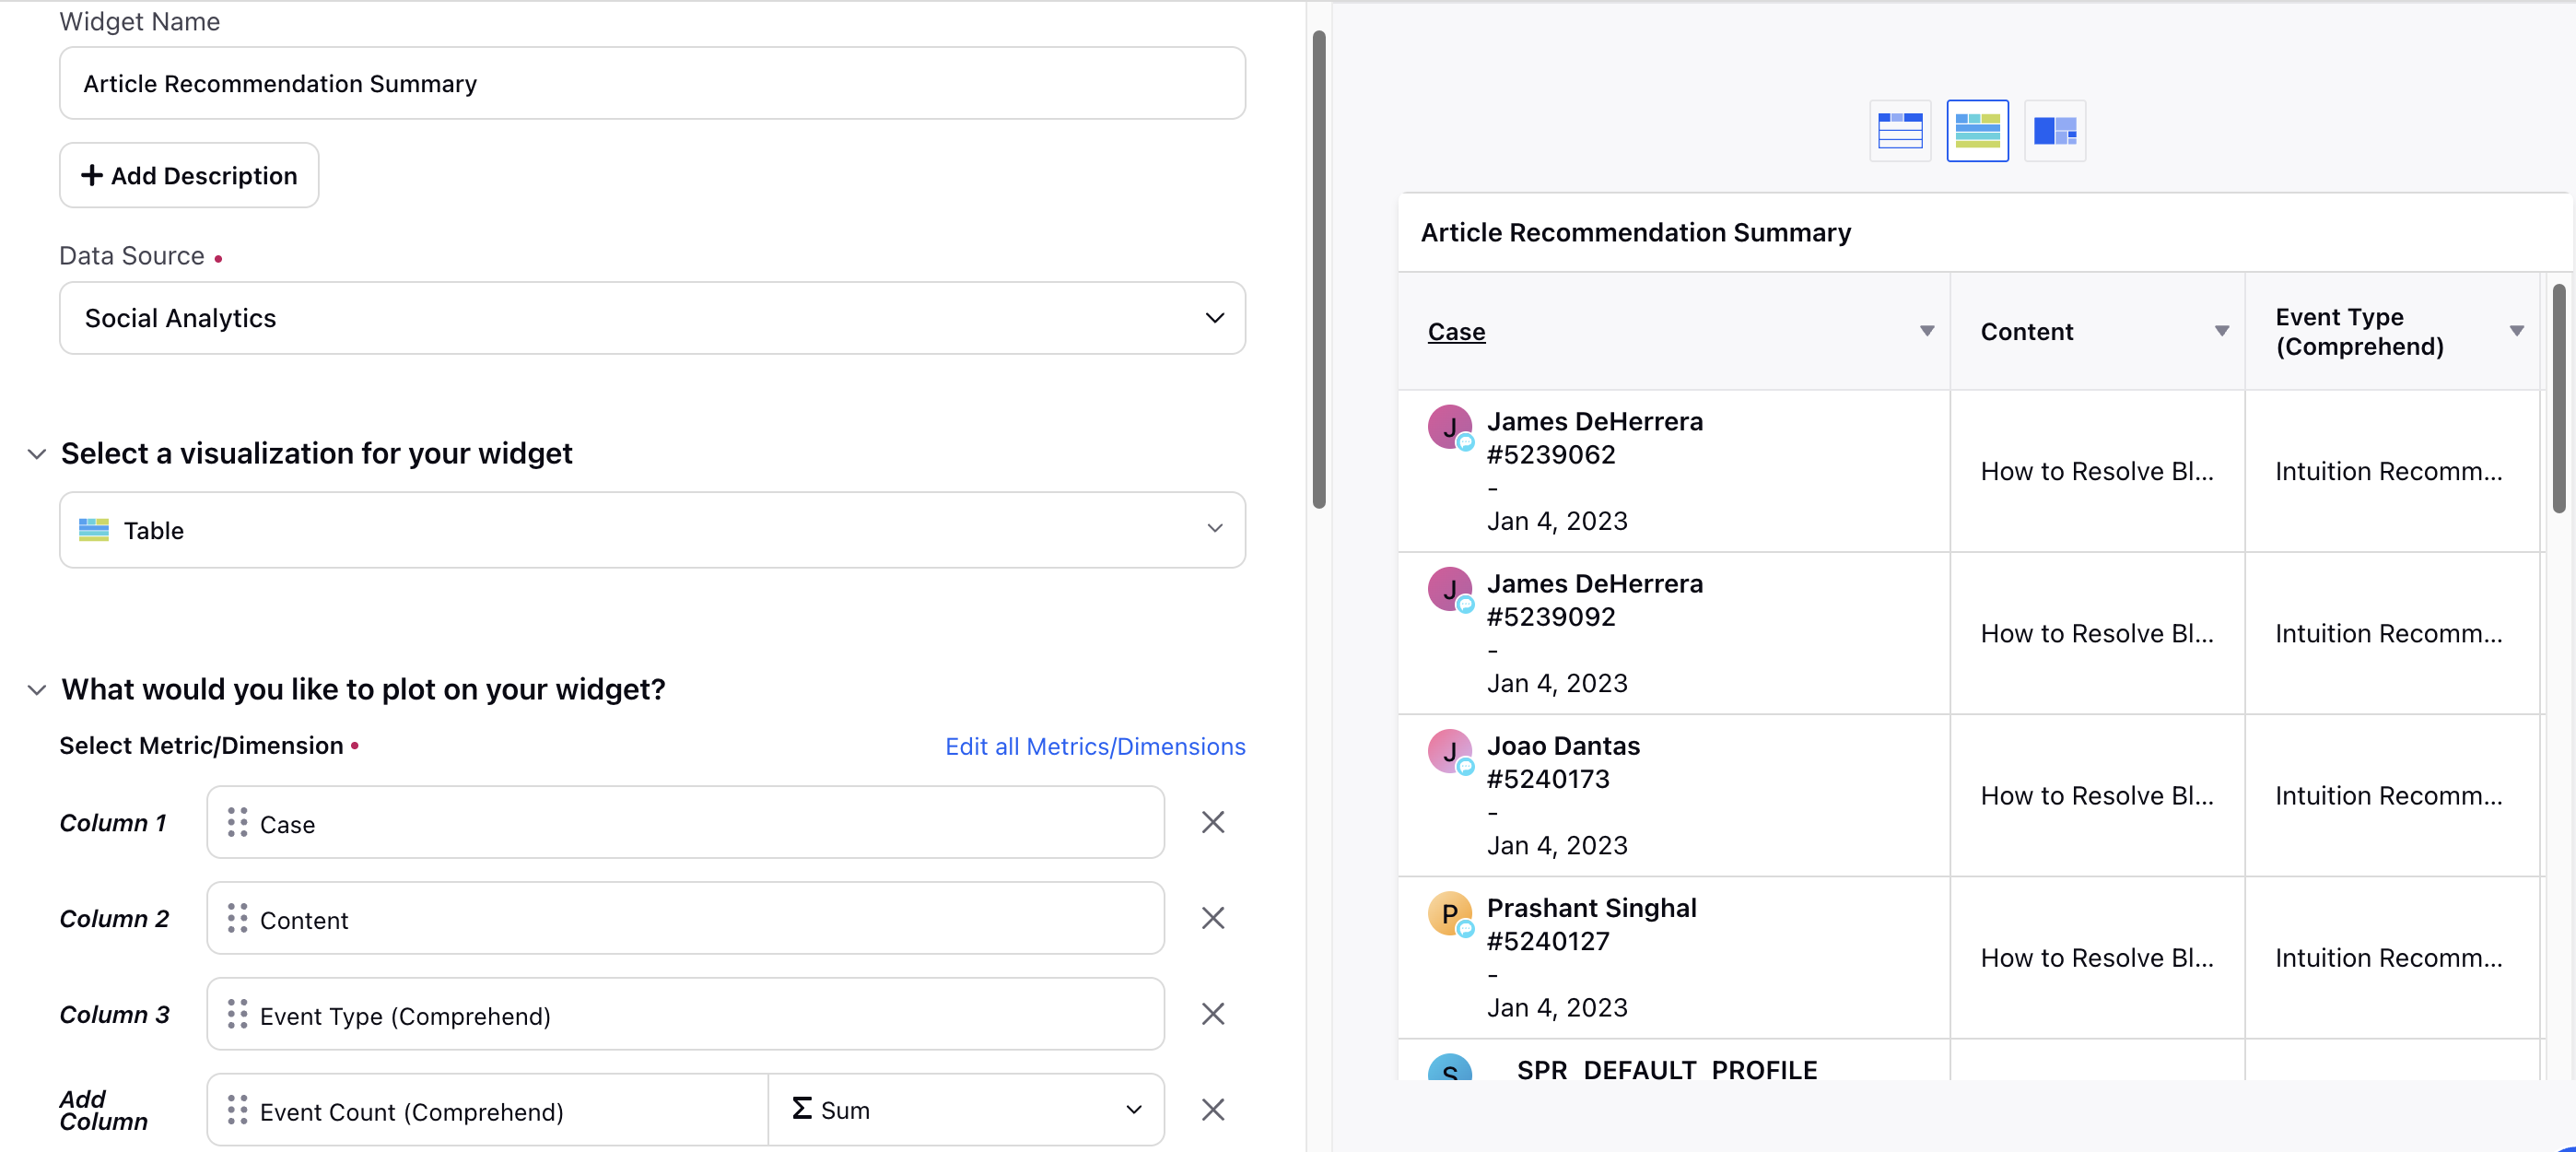
Article Recommendation Summary
This section provides a summary of the articles recommended for each case. By reviewing these recommendations, you can understand which articles are suggested to agents and how they contribute to case resolution. This section lists the required Widget configuration (including Metrics, Dimensions, and filters) analyzer case response SLA without using articles.
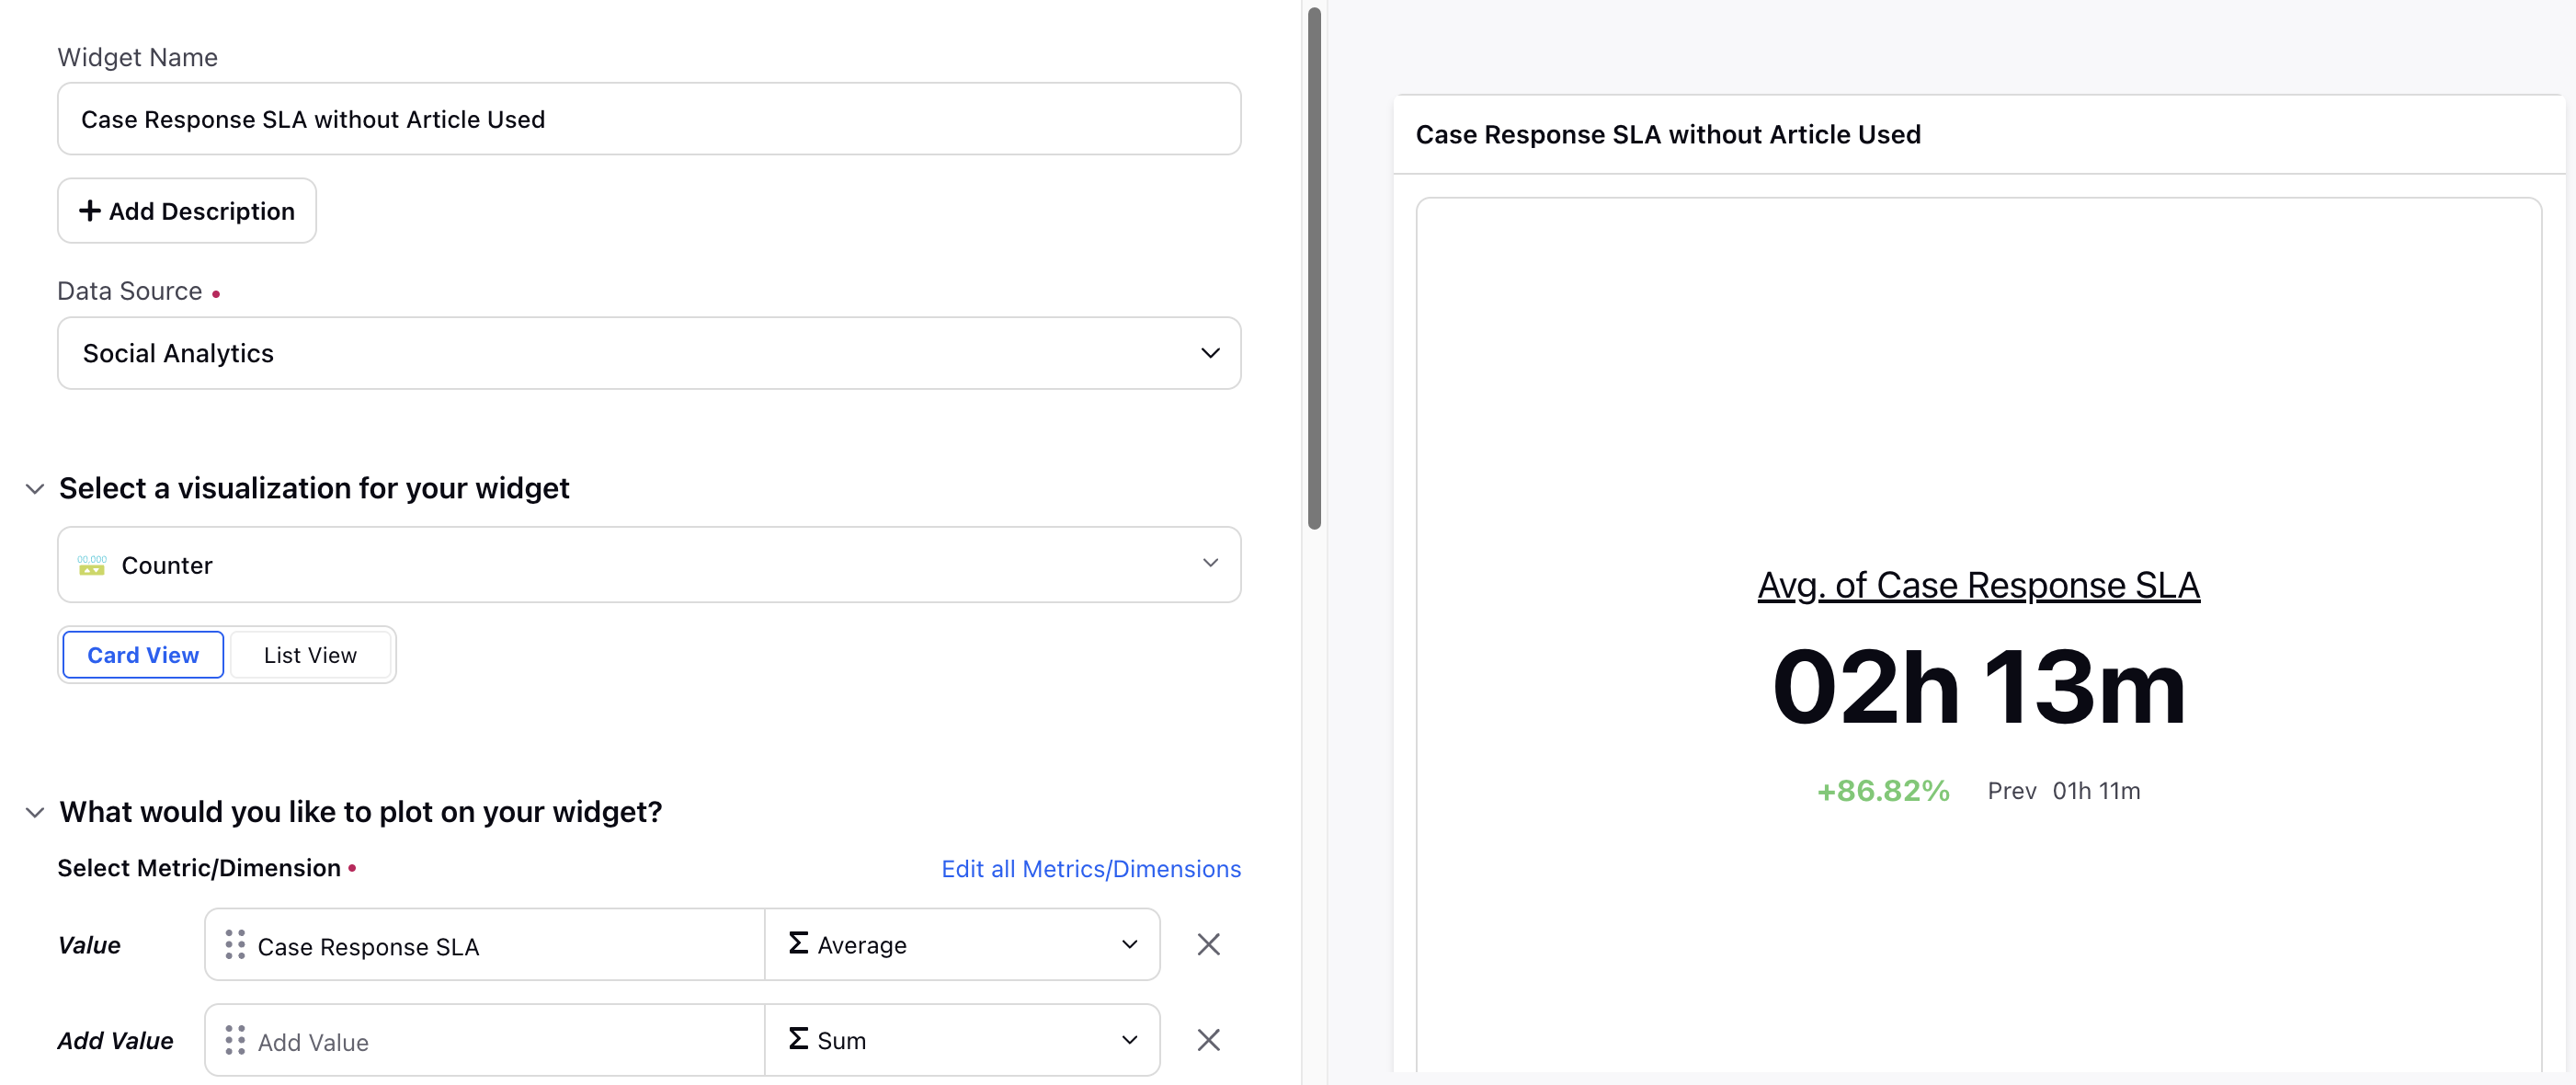
Case Response SLA Without Article Usage
Evaluate the Service Level Agreement (SLA) for case responses where articles were not utilized, providing a baseline for comparison with AI-assisted resolutions. This section lists the required Widget configuration (including Metrics, Dimensions, and filters) to analyze case response SLA without using articles.
Predicted Customer Satisfaction (CSAT) Without Article Usage
Understanding customer satisfaction is crucial for improving service quality. This section explores how predicted customer satisfaction when agents do not use articles from the knowledge base. By analyzing interactions without article usage, we can identify areas where additional support or training may be needed to enhance customer experiences.

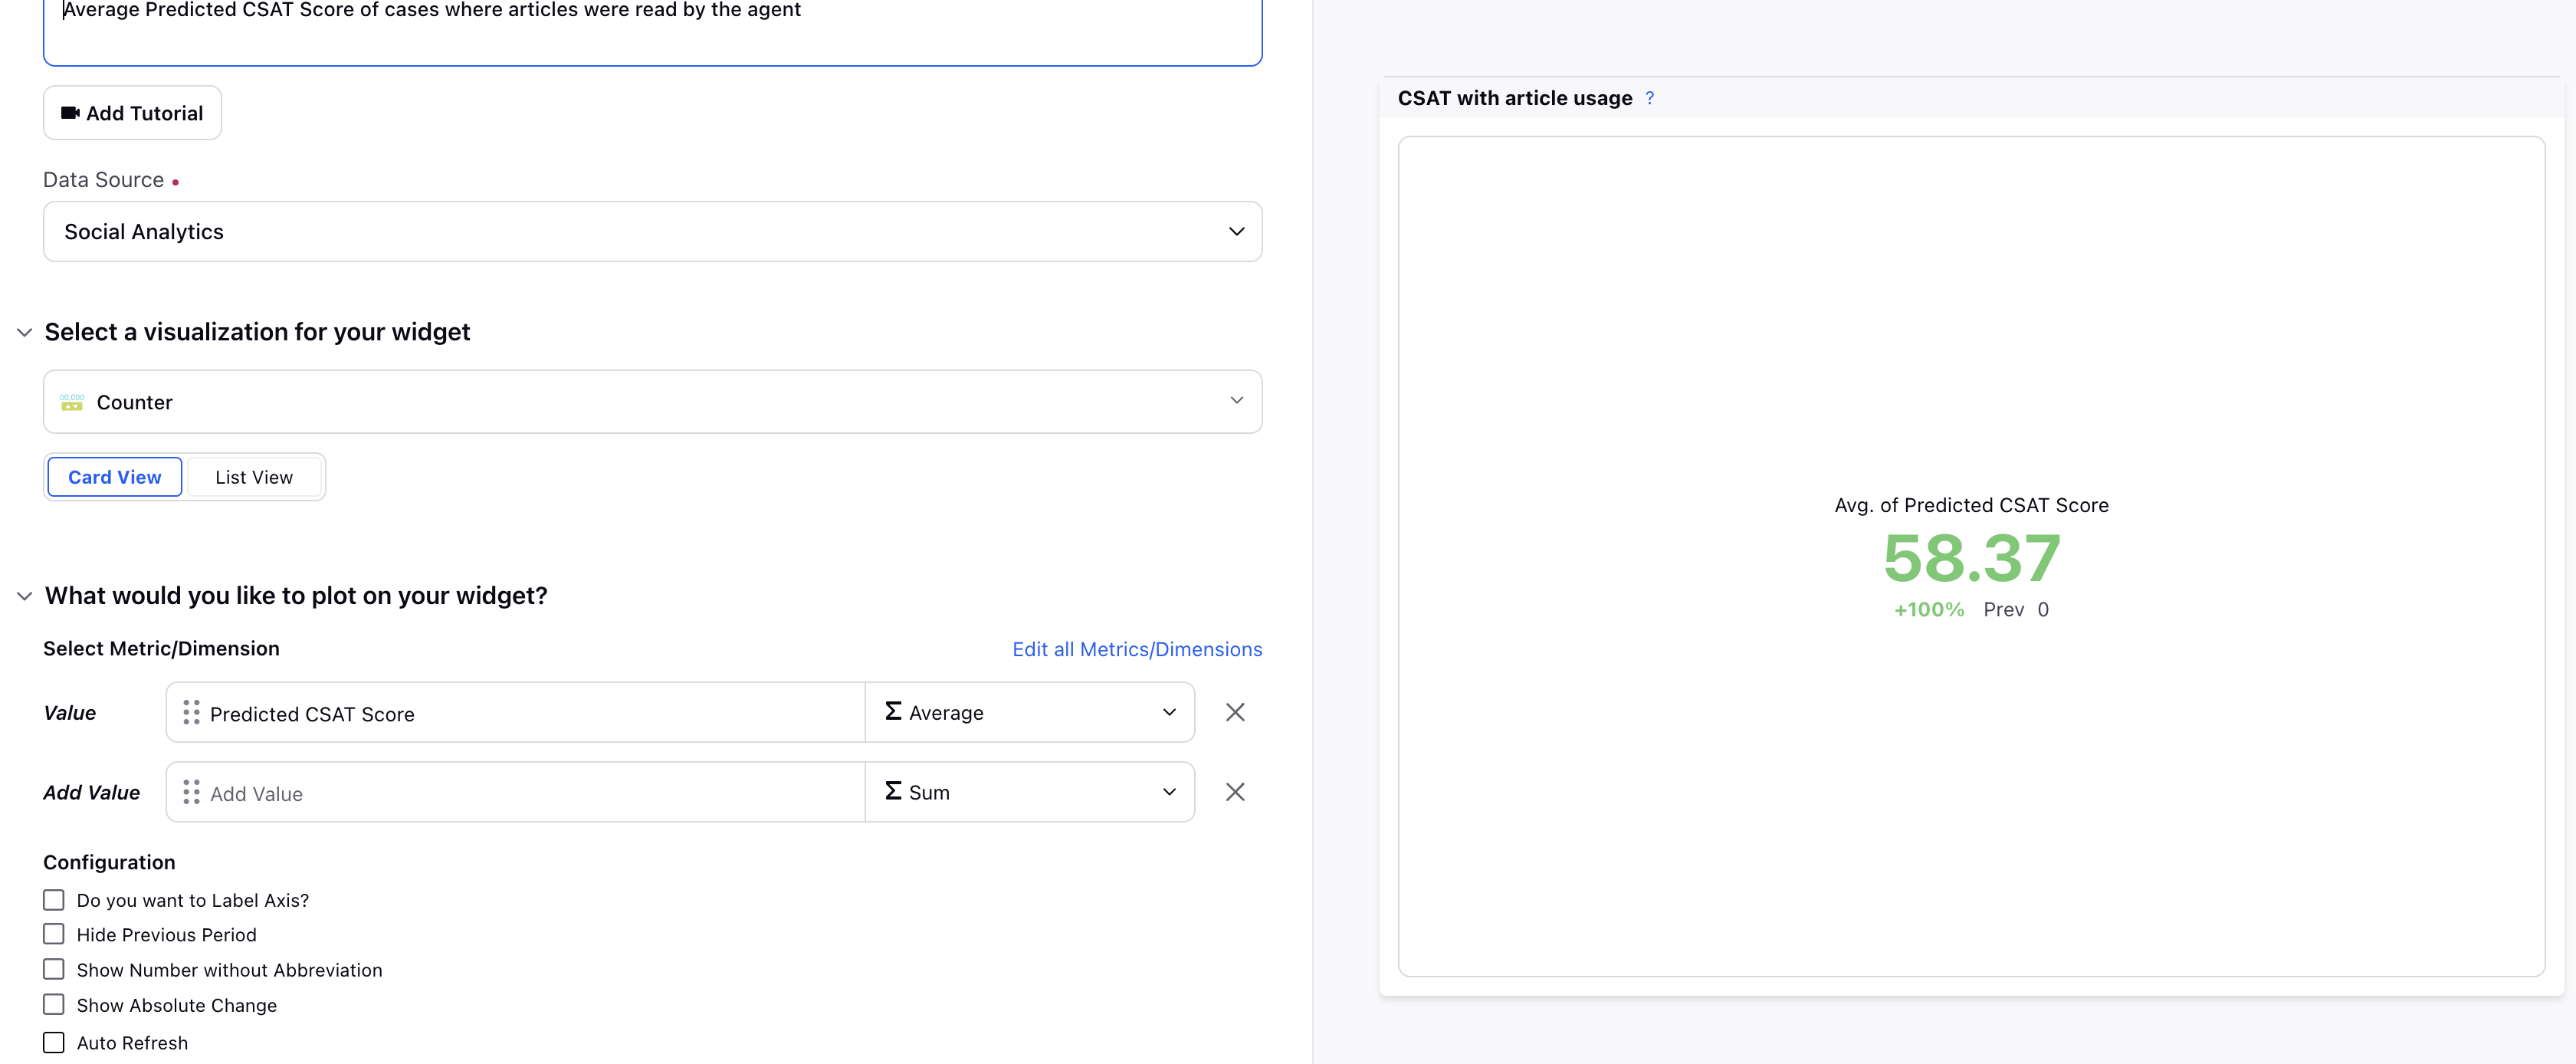
Predicted Customer Satistaction (CSAT) with Article Usage
Using articles from the knowledge base can greatly improve customer satisfaction. This section analyzes predicted customer satisfaction when agents use these articles during their interactions. By comparing these predictions with those from interactions where articles are not used, we can see how effective the knowledge base is in enhancing customer service.
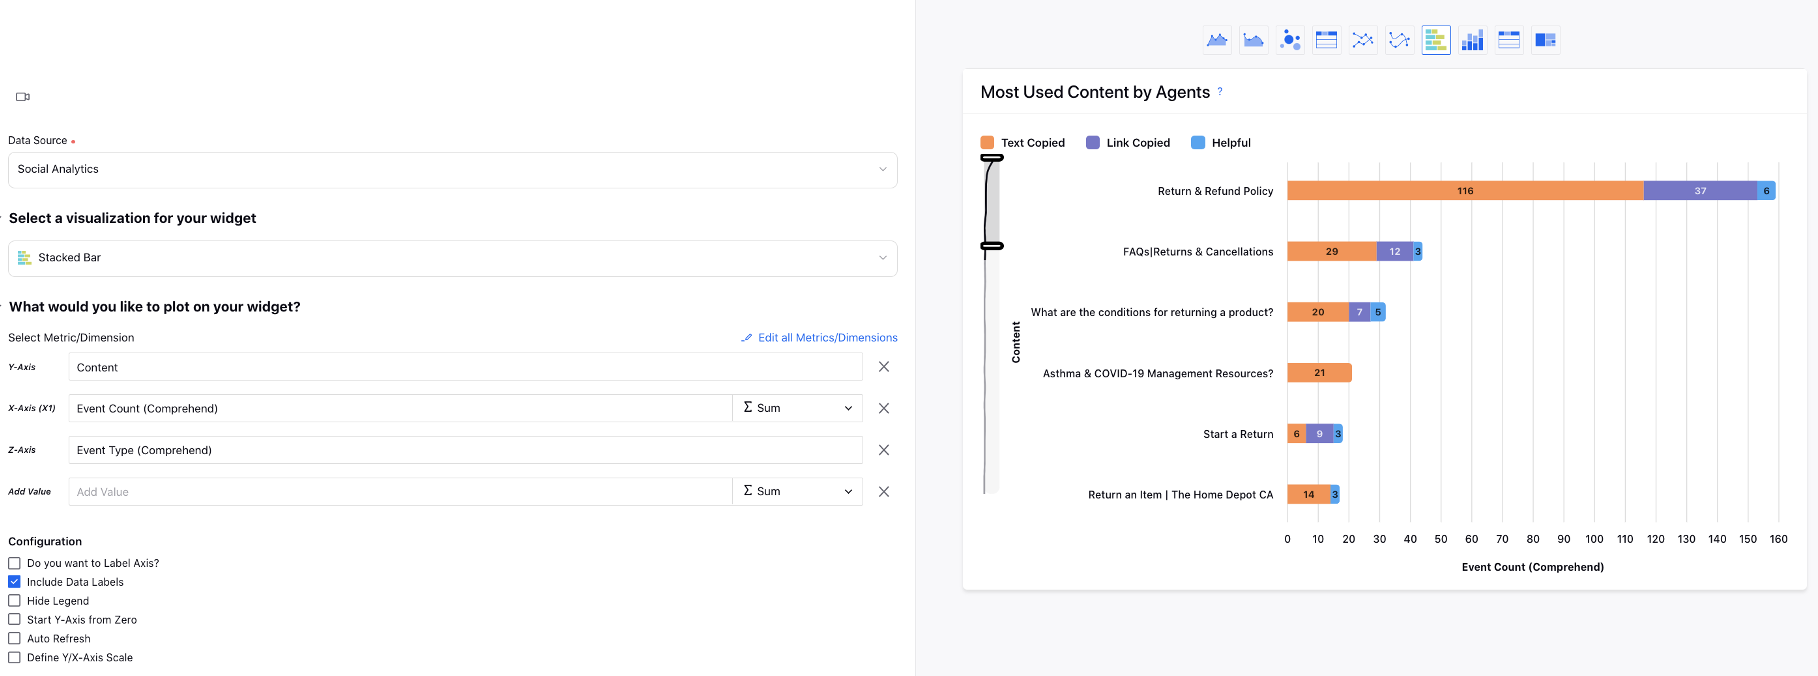
Most Used Content by Agents
Identify the articles that agents use the most. By knowing which resources are frequently accessed, you can better understand what information is most helpful for resolving cases and supporting daily tasks. This section lists the required Widget configuration (including Metrics, Dimensions, and filters) the most used articles by agents.
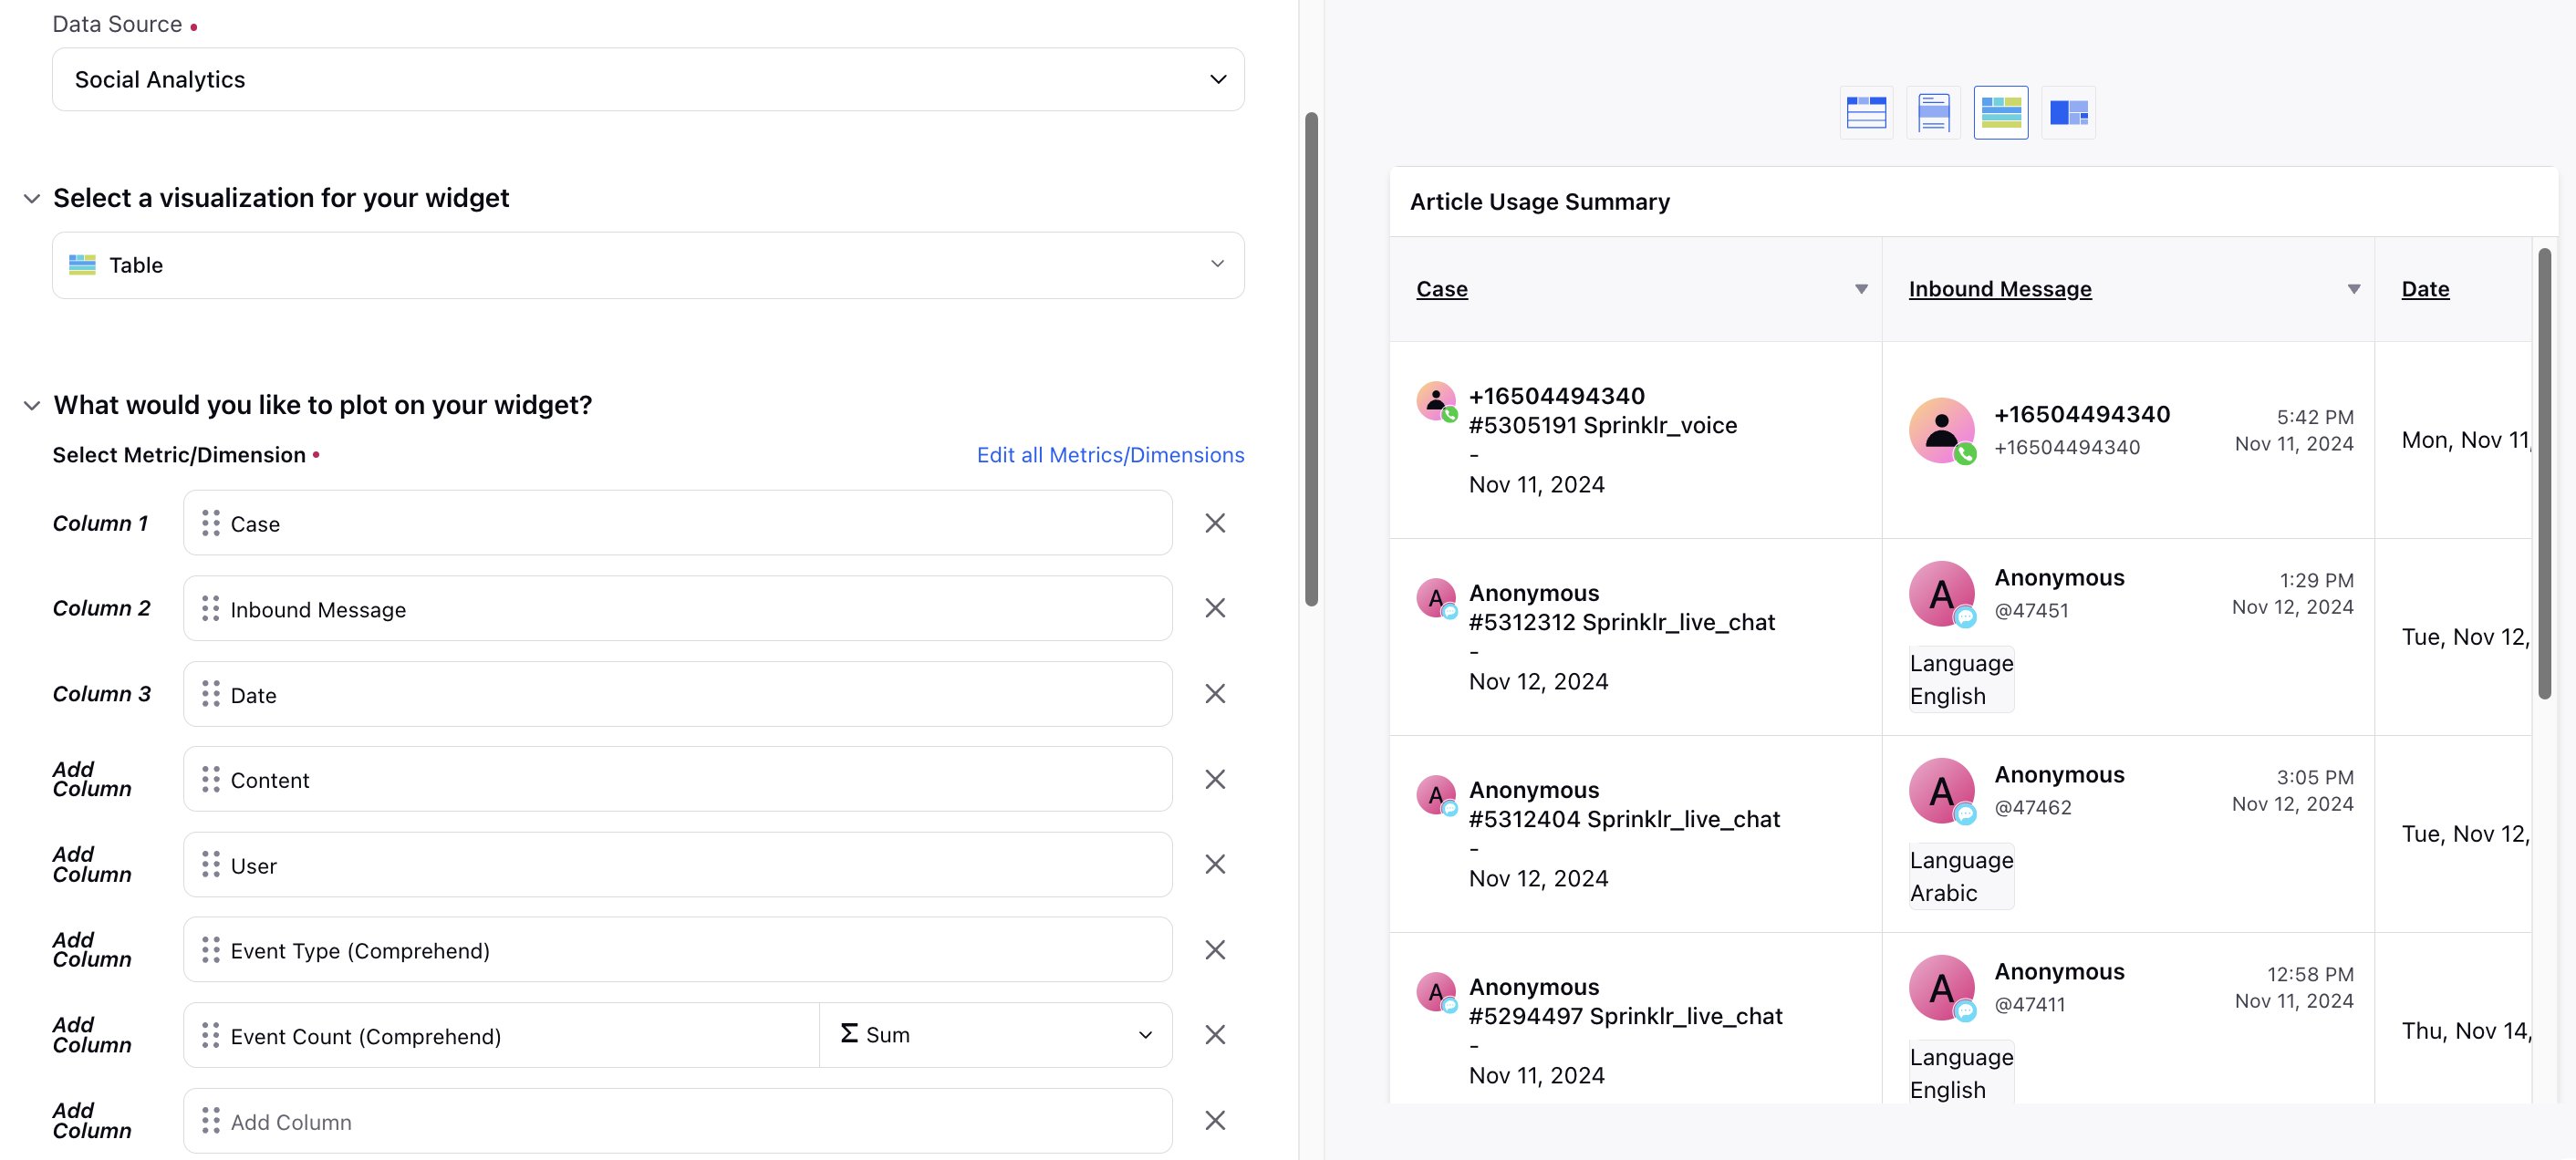
Case-Specific Article Usage Summary
Monitor a comprehensive summary of article usage for each Case, detailing how often and in what context agents access and utilize articles. This includes tracking when agents read articles, copy content, and mark them as helpful or not helpful. This section lists the required Widget configuration (including Metrics, Dimensions, and filters) to summarize agents' article usage for each Case.
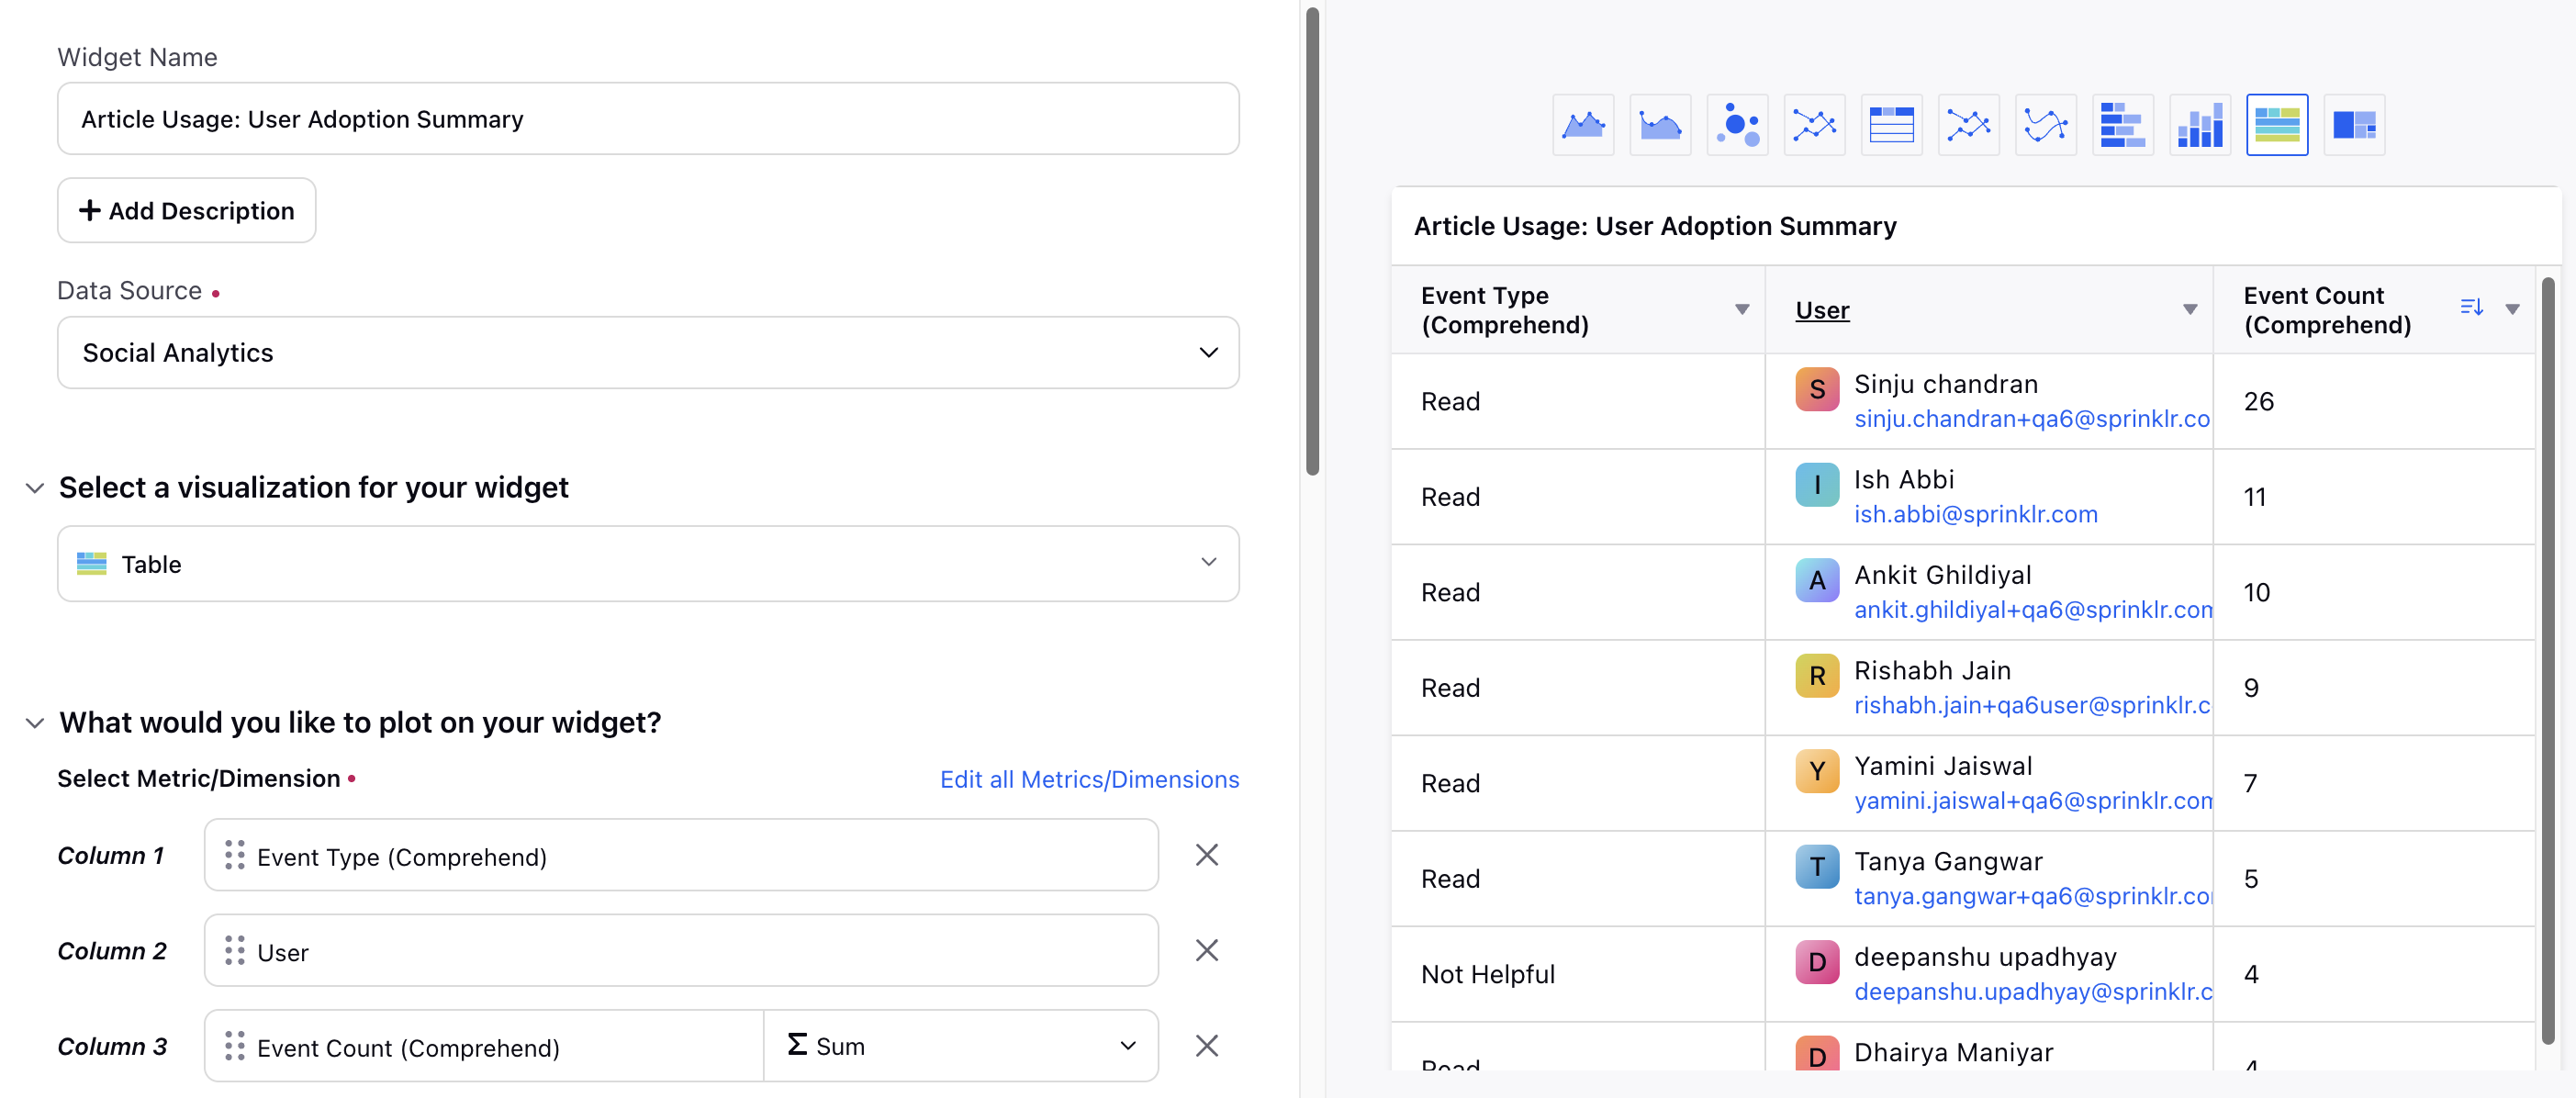
Article Usage: Agent Adoption Summary
This Widget provides an overview of agent adoption rates for article usage. It can include when the agents read an article or marked them helpful or not helpful. This section lists the required Widget configuration (including Metrics, Dimensions, and filters) to summarize agents' article usage.
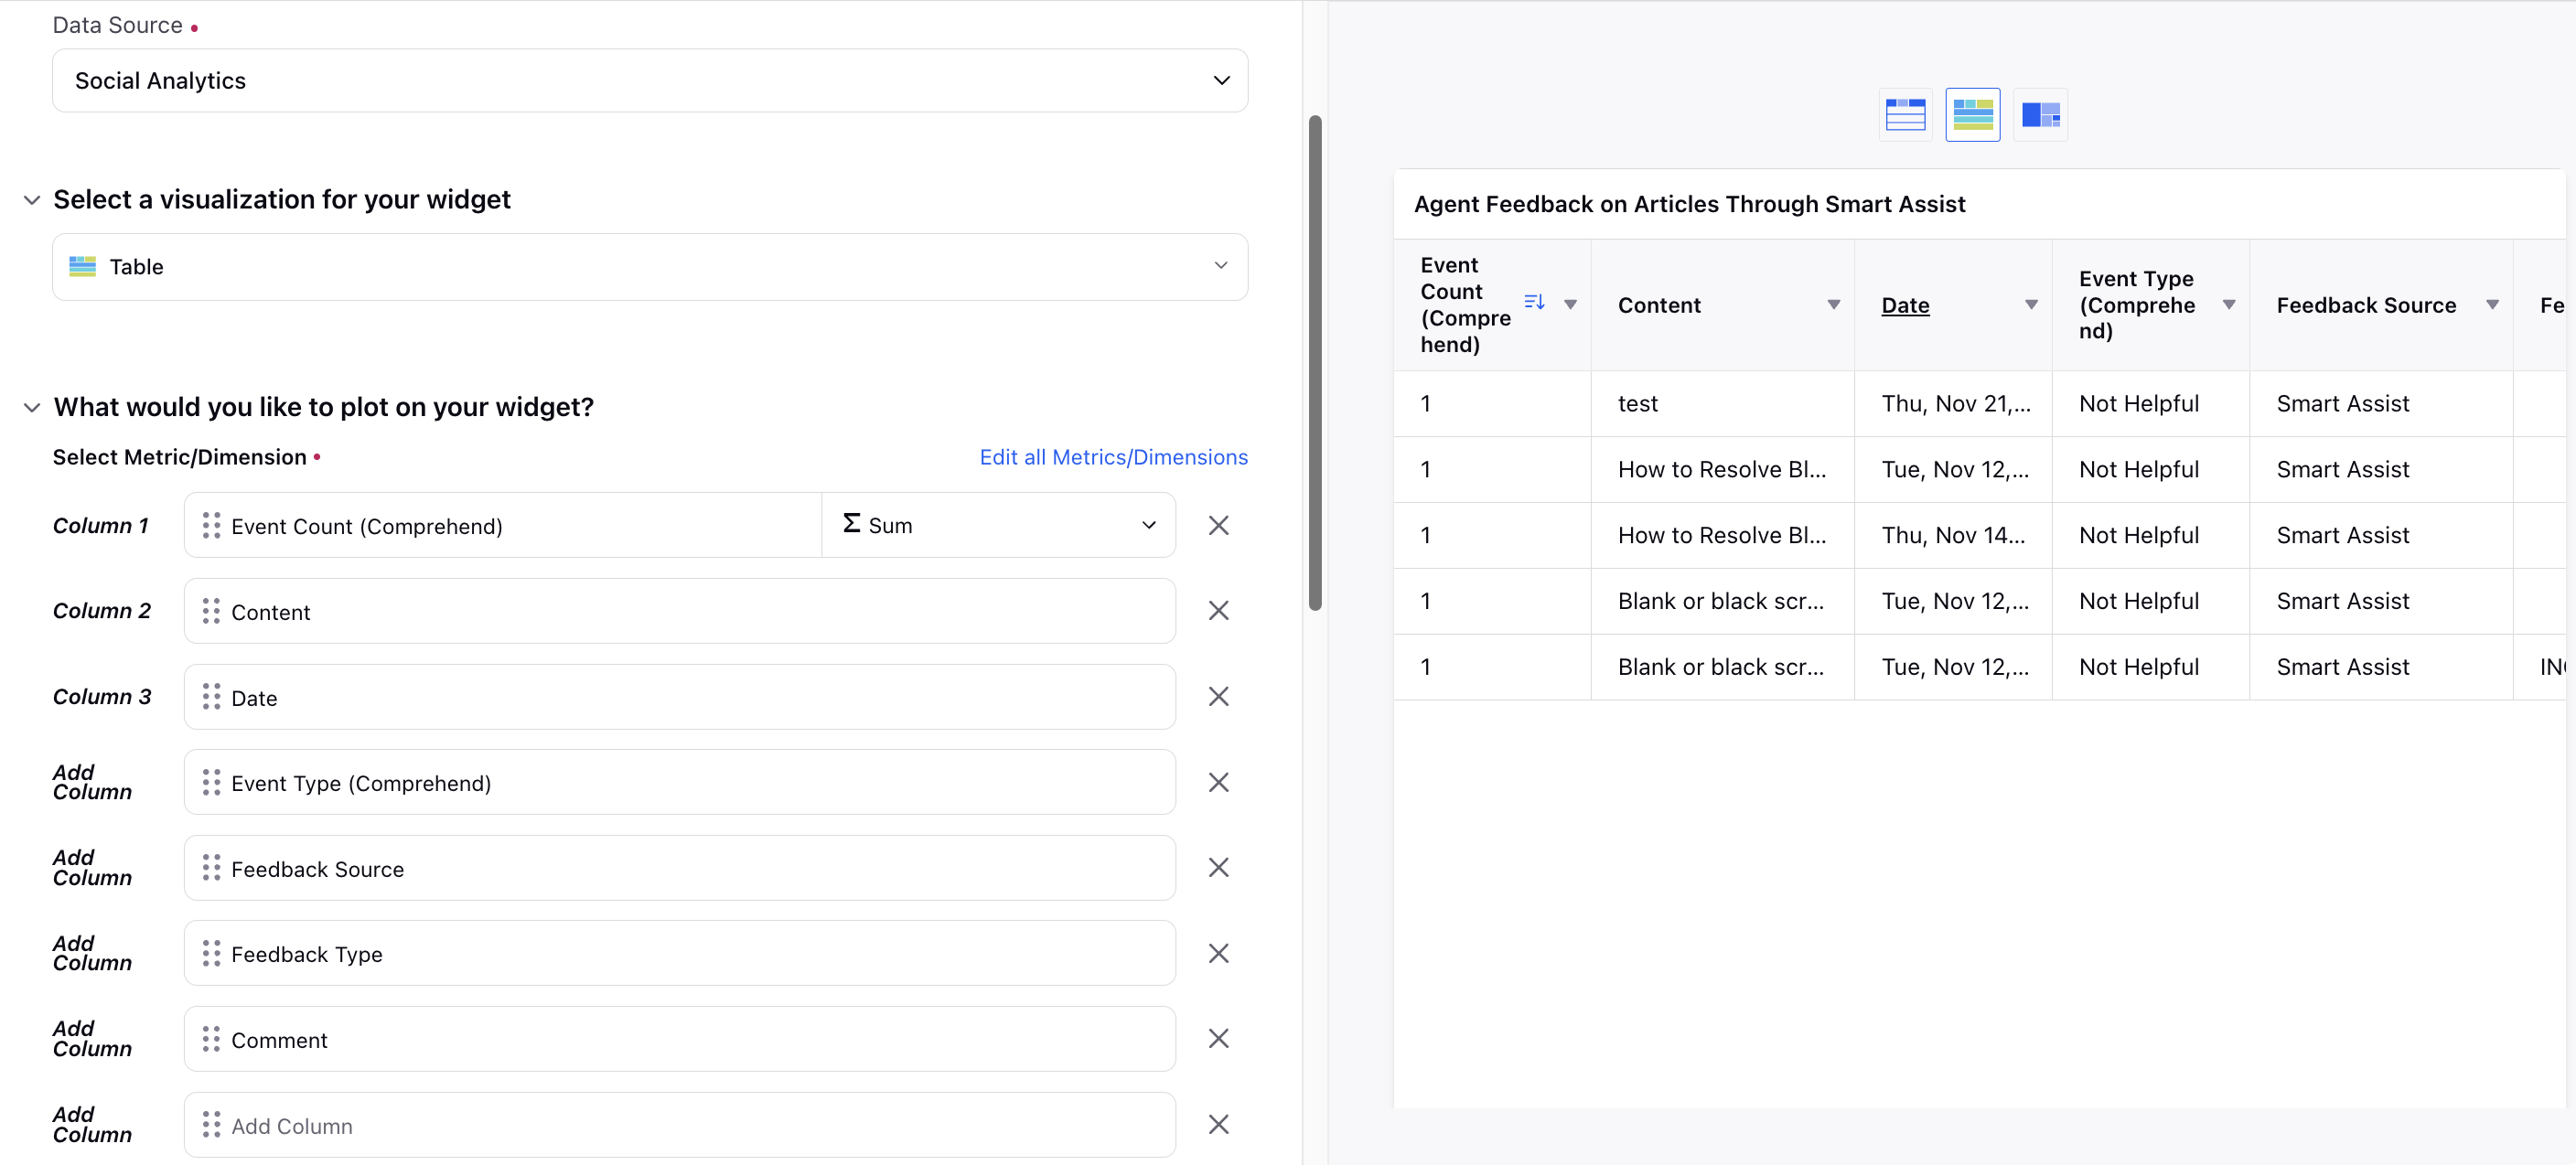
Agent Feedback on Articles Through Smart Assist
This Widget helps you categorize the feedback provided by agents on articles through Smart Assist. This section lists the required Widget configuration (including Metrics, Dimensions, and filters) to summarize agents' feedback on articles through Smart Assist.
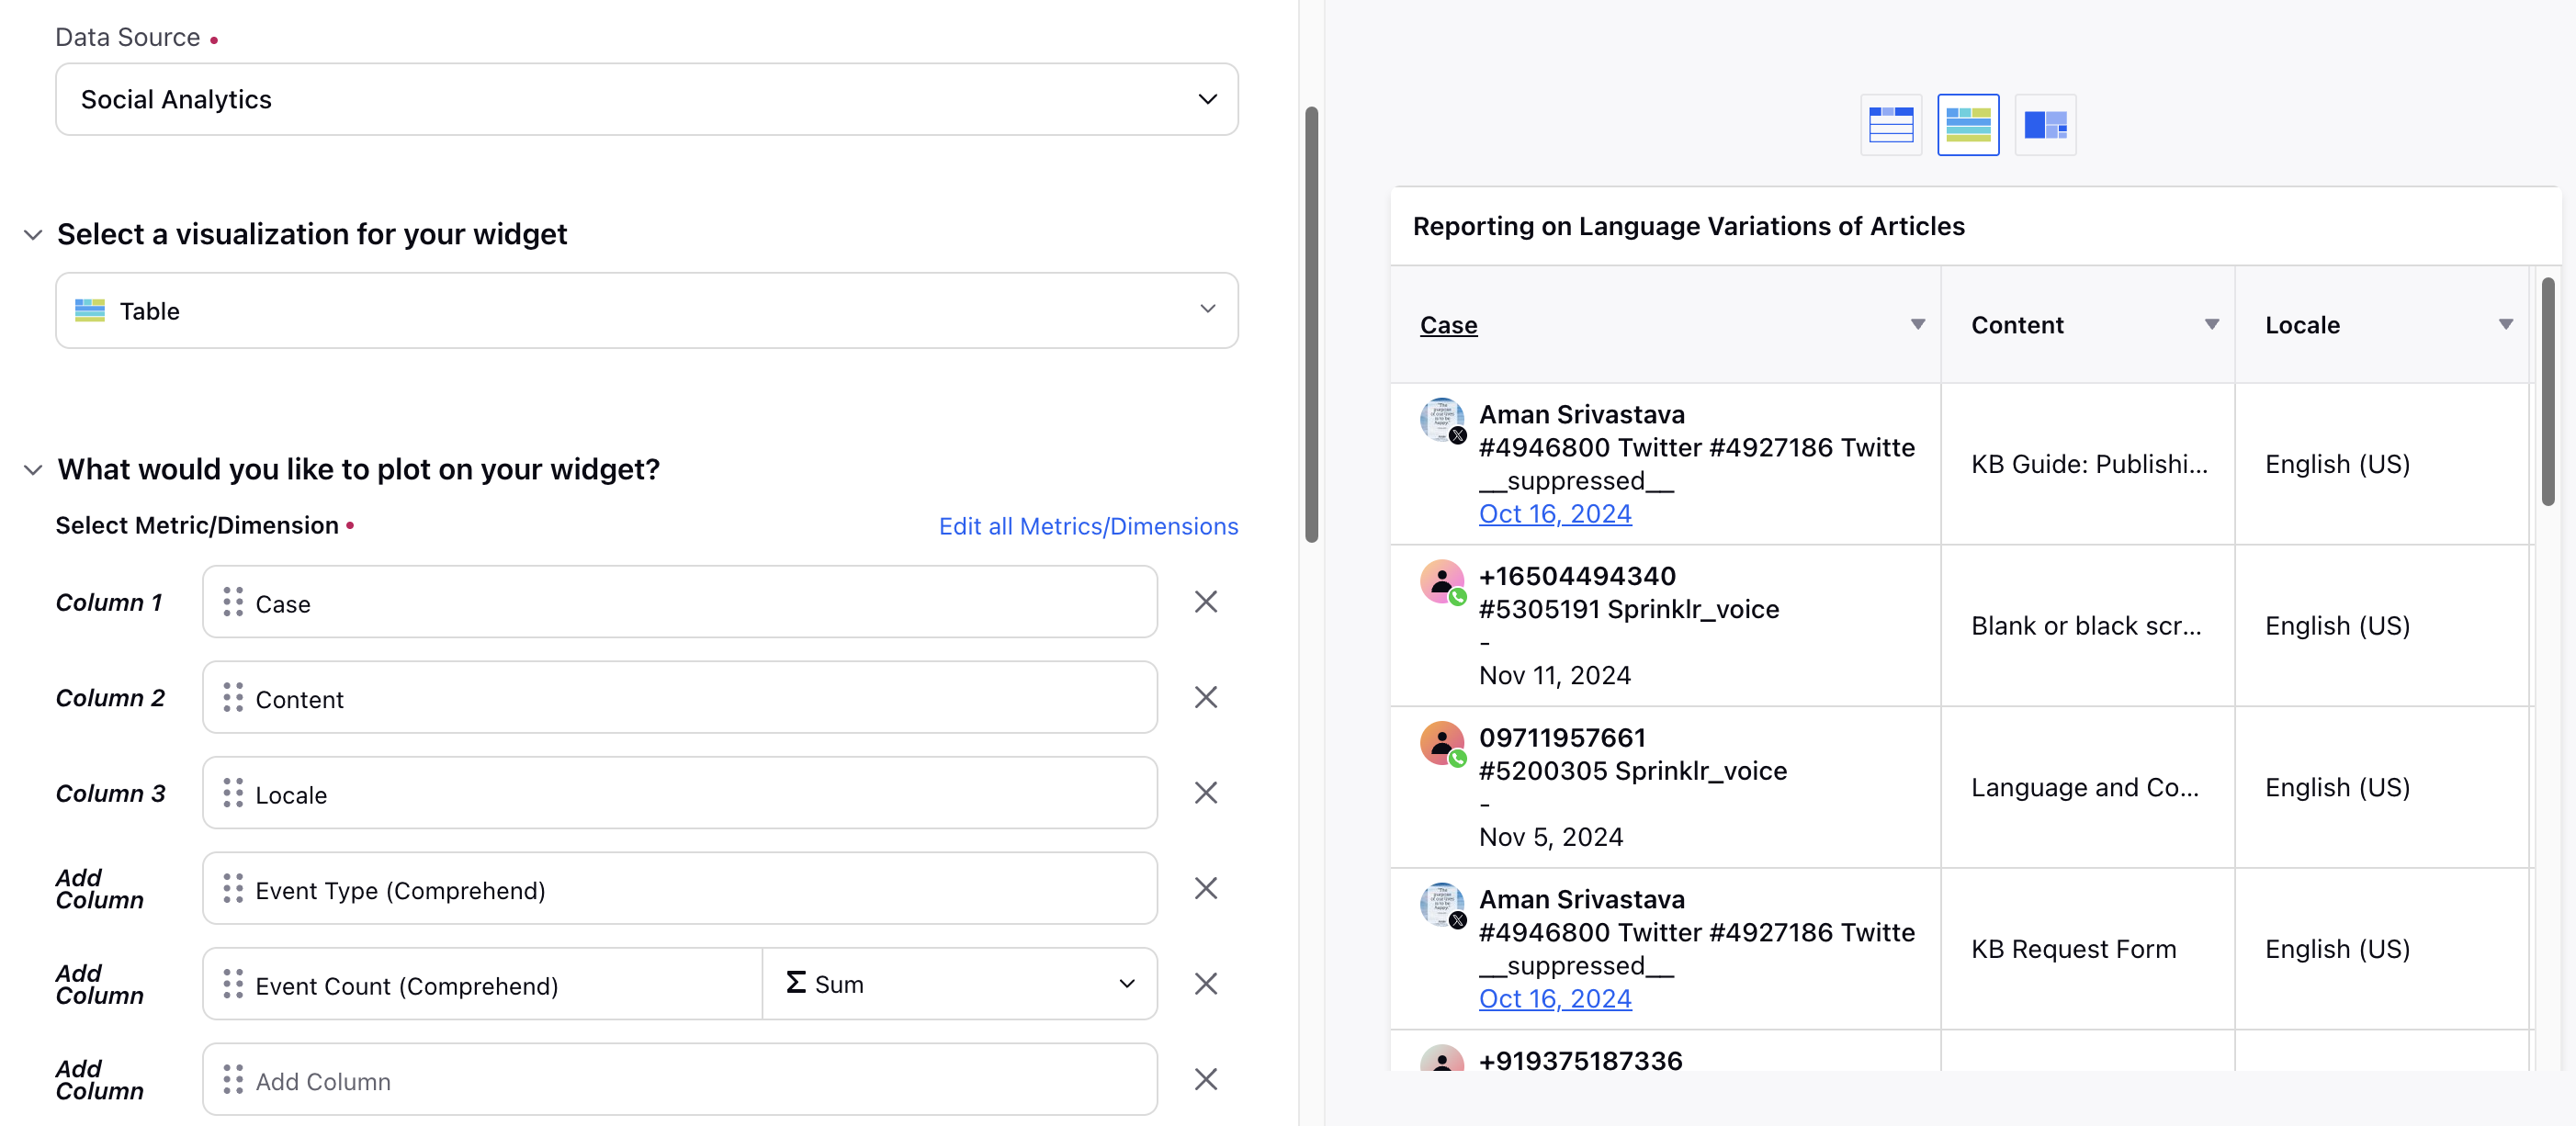
Reporting on Language Variations of Articles
Reporting on articles in various languages helps you understand the reach and effectiveness of multilingual content. This section lists the required Widget configuration (including Metrics, Dimensions, and filters) to understand how articles are accessed and utilized across different languages.
Searches in Smart Assist
This section lists the required Widget configuration (including Metrics, Dimensions, and filters) to create a Reporting Widget to track all searches made in Smart Assist by agents.
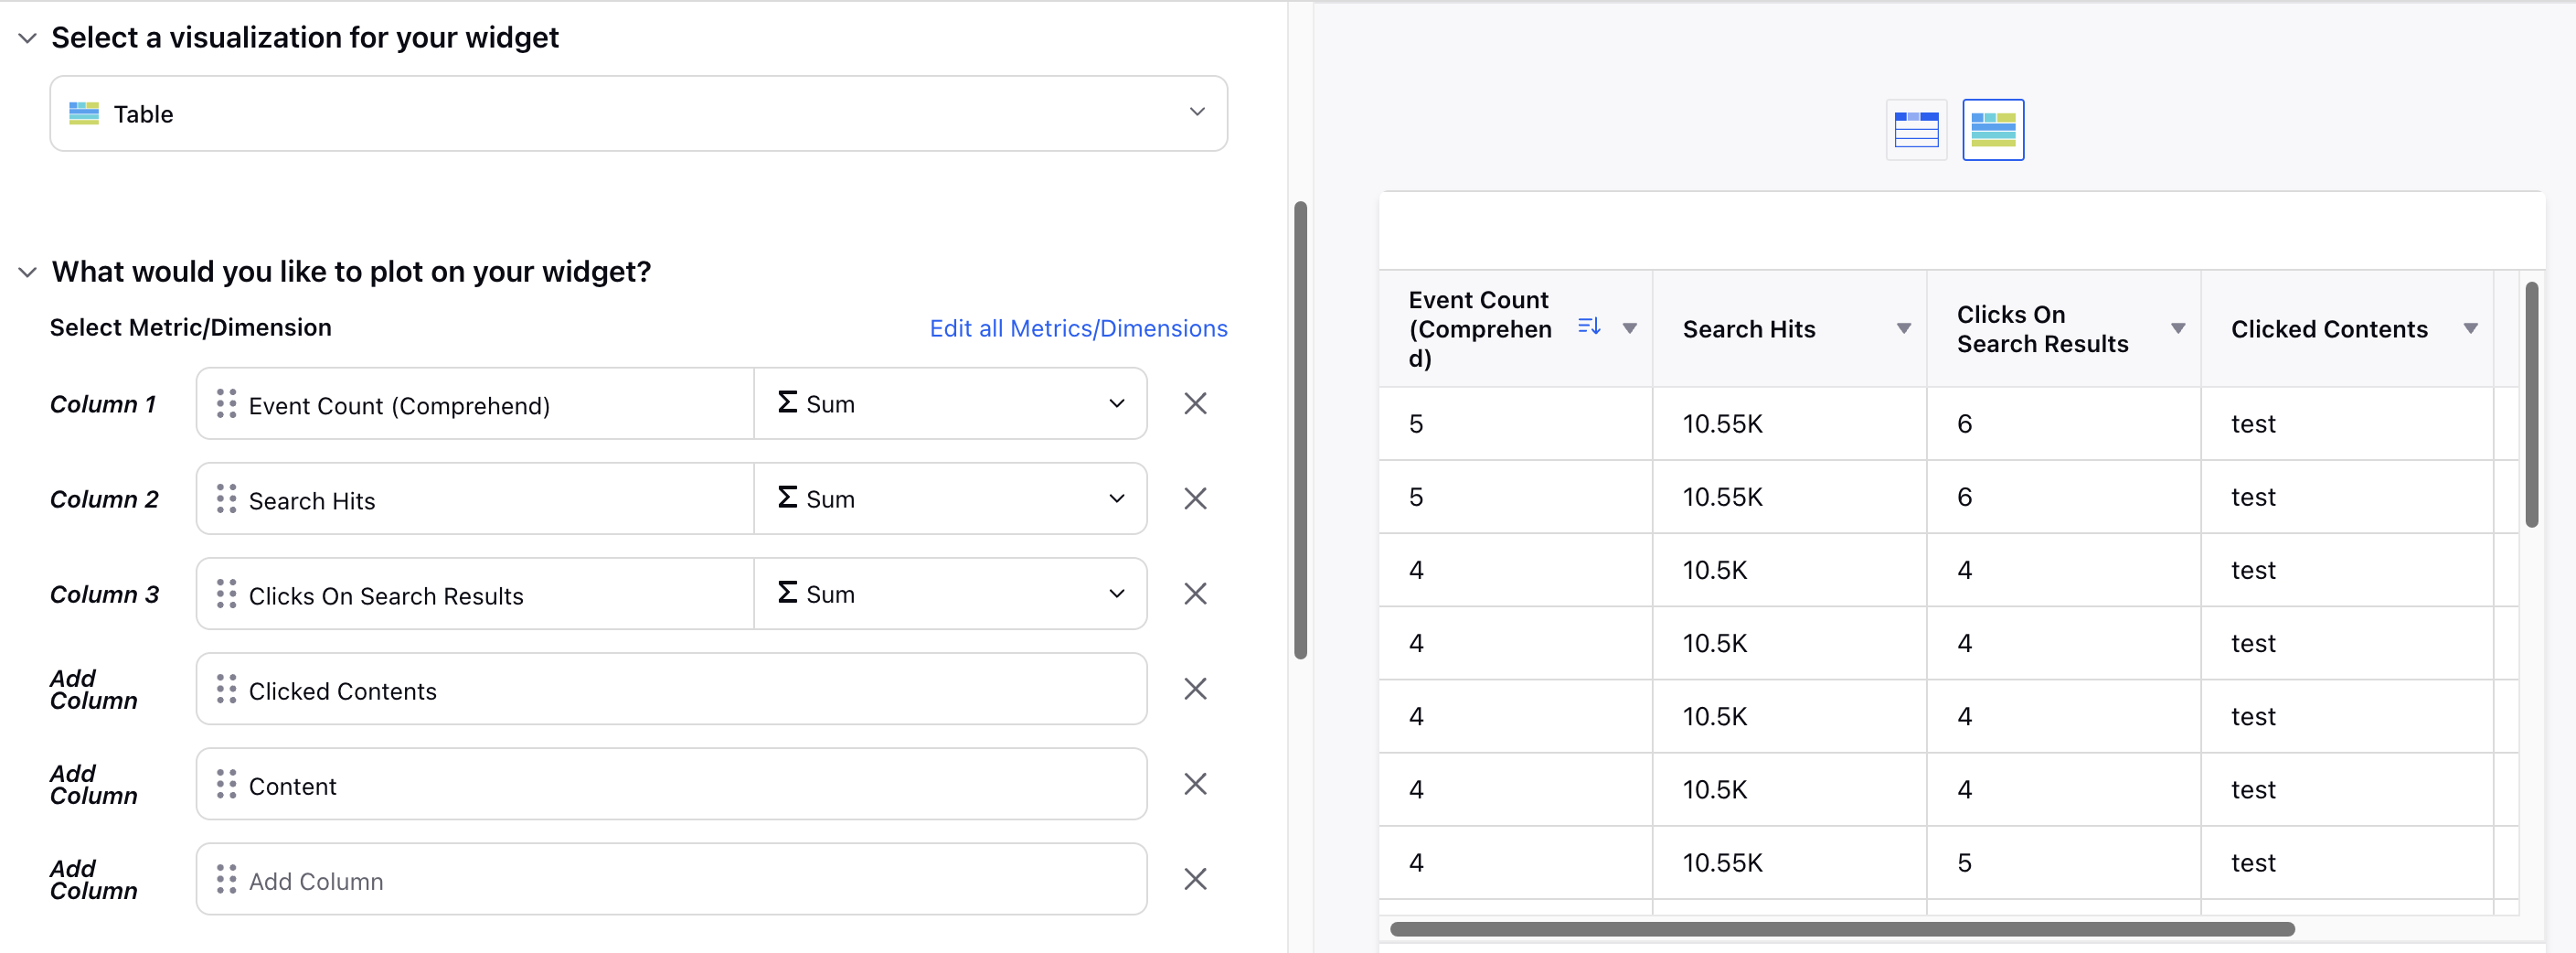
Event Count (Comprehend): This column represents the total number of times a search query was executed. For example, if agents searched for "customer support" 50 times in a day, the Event Count for "customer support" would be 50.
Search Hits: This column indicates the total number of results returned for a search query. If the search hits are 0, it means no results were found for that query. When aggregated, this metric can provide the total number of search hits or the average number of search hits per query.
Note: If agents searched for "product manual" 5 times and each search returned 10 results, the total Search Hits would be 50 when the “Sum” operator is selected.
If agents searched for "product manual" 5 times and the total Search Hits was 50, the average Search Hits per query would be 10 when the “Average” operator is selected.
Clicks On Search Results: This column tracks the number of times agents click on an article from the search results. When aggregated, this metric can provide the total or average number of clicks per search query.
Note: If agents clicked on articles 30 times after searching for "installation guide," the total Clicks on Search Result for that query would be 30 when the “Sum” operator is selected.
If agents searched for "installation guide" 10 times and the total Clicks on Search Result were 30, the average Clicks on Search Result per query would be 3 when the “Average” operator is selected.
Clicked Contents: This column provides a list of articles that were clicked on from the search results. For example, if agents searched for "troubleshooting" and clicked on three different articles titled "Troubleshooting Guide," "Common Issues," and "Fixes for Errors," the Clicked Content would list these three articles.
Content: This dimension provides the list of articles that were clicked on from the search result.