Website Analytics
Updated
Website analytics enables you to understand how users interact with your Knowledge Base. This helps you to optimize content and improve user experience. This section provides detailed insights into user behavior, including page views, session durations, and navigation patterns. By analyzing these parameters, you can identify popular articles, detect areas needing improvement, and make data-driven decisions to enhance the overall effectiveness of your Knowledge Base.
Traffic Analytics
Traffic analytics is essential for understanding the flow of visitors to your website and identifying trends in user behavior. You can make informed decisions to enhance your site's performance and user experience by analyzing traffic patterns.
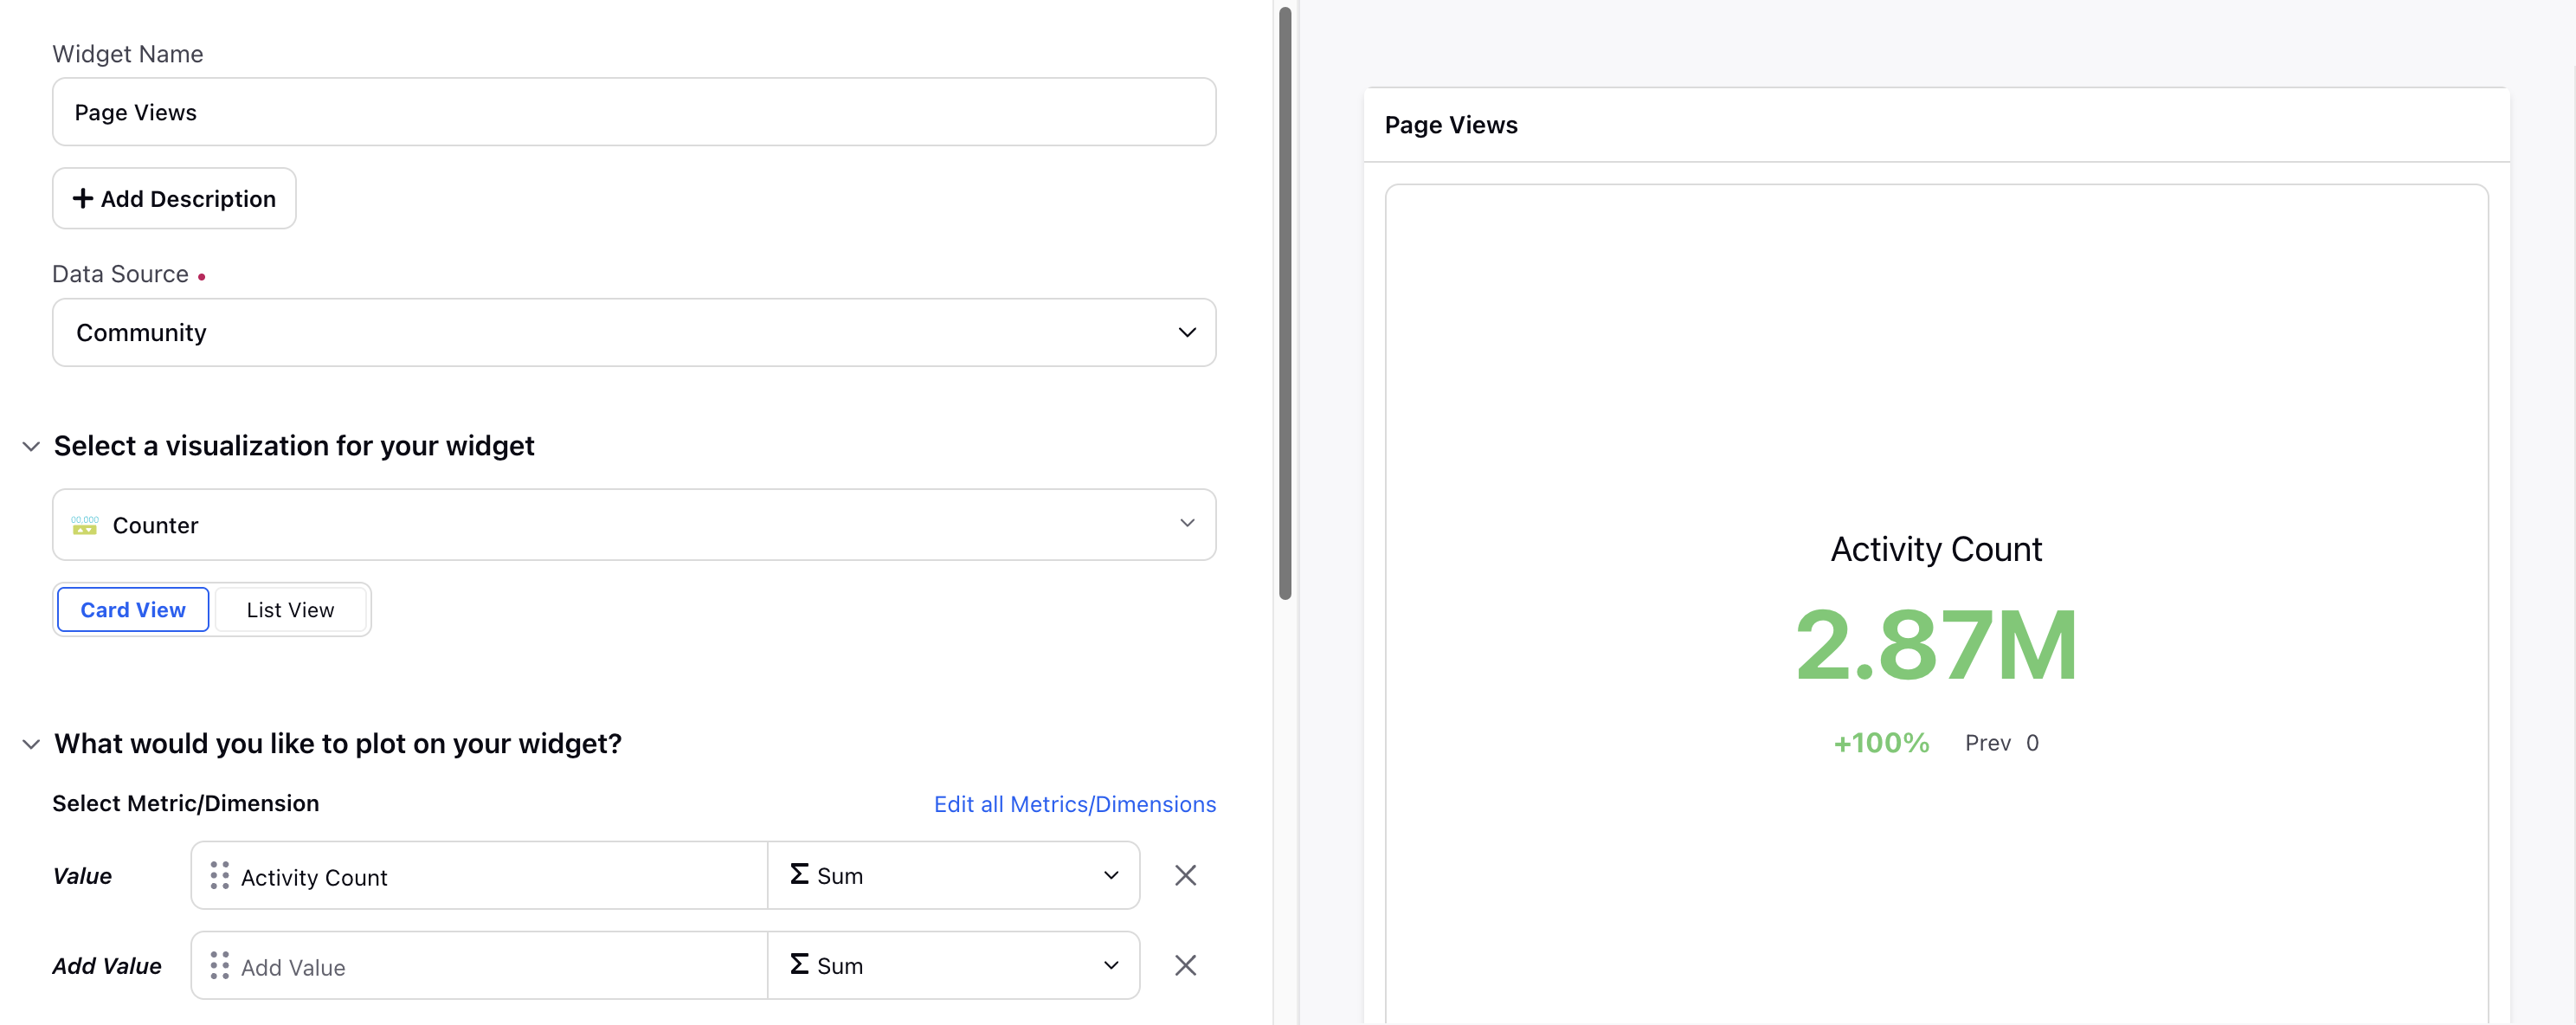
Page Views
Tracking page views is essential for understanding user engagement with your help center. This section lists the required Widget configuration (including Metrics, Dimensions, and filters) to track the number of users who visit your help center.
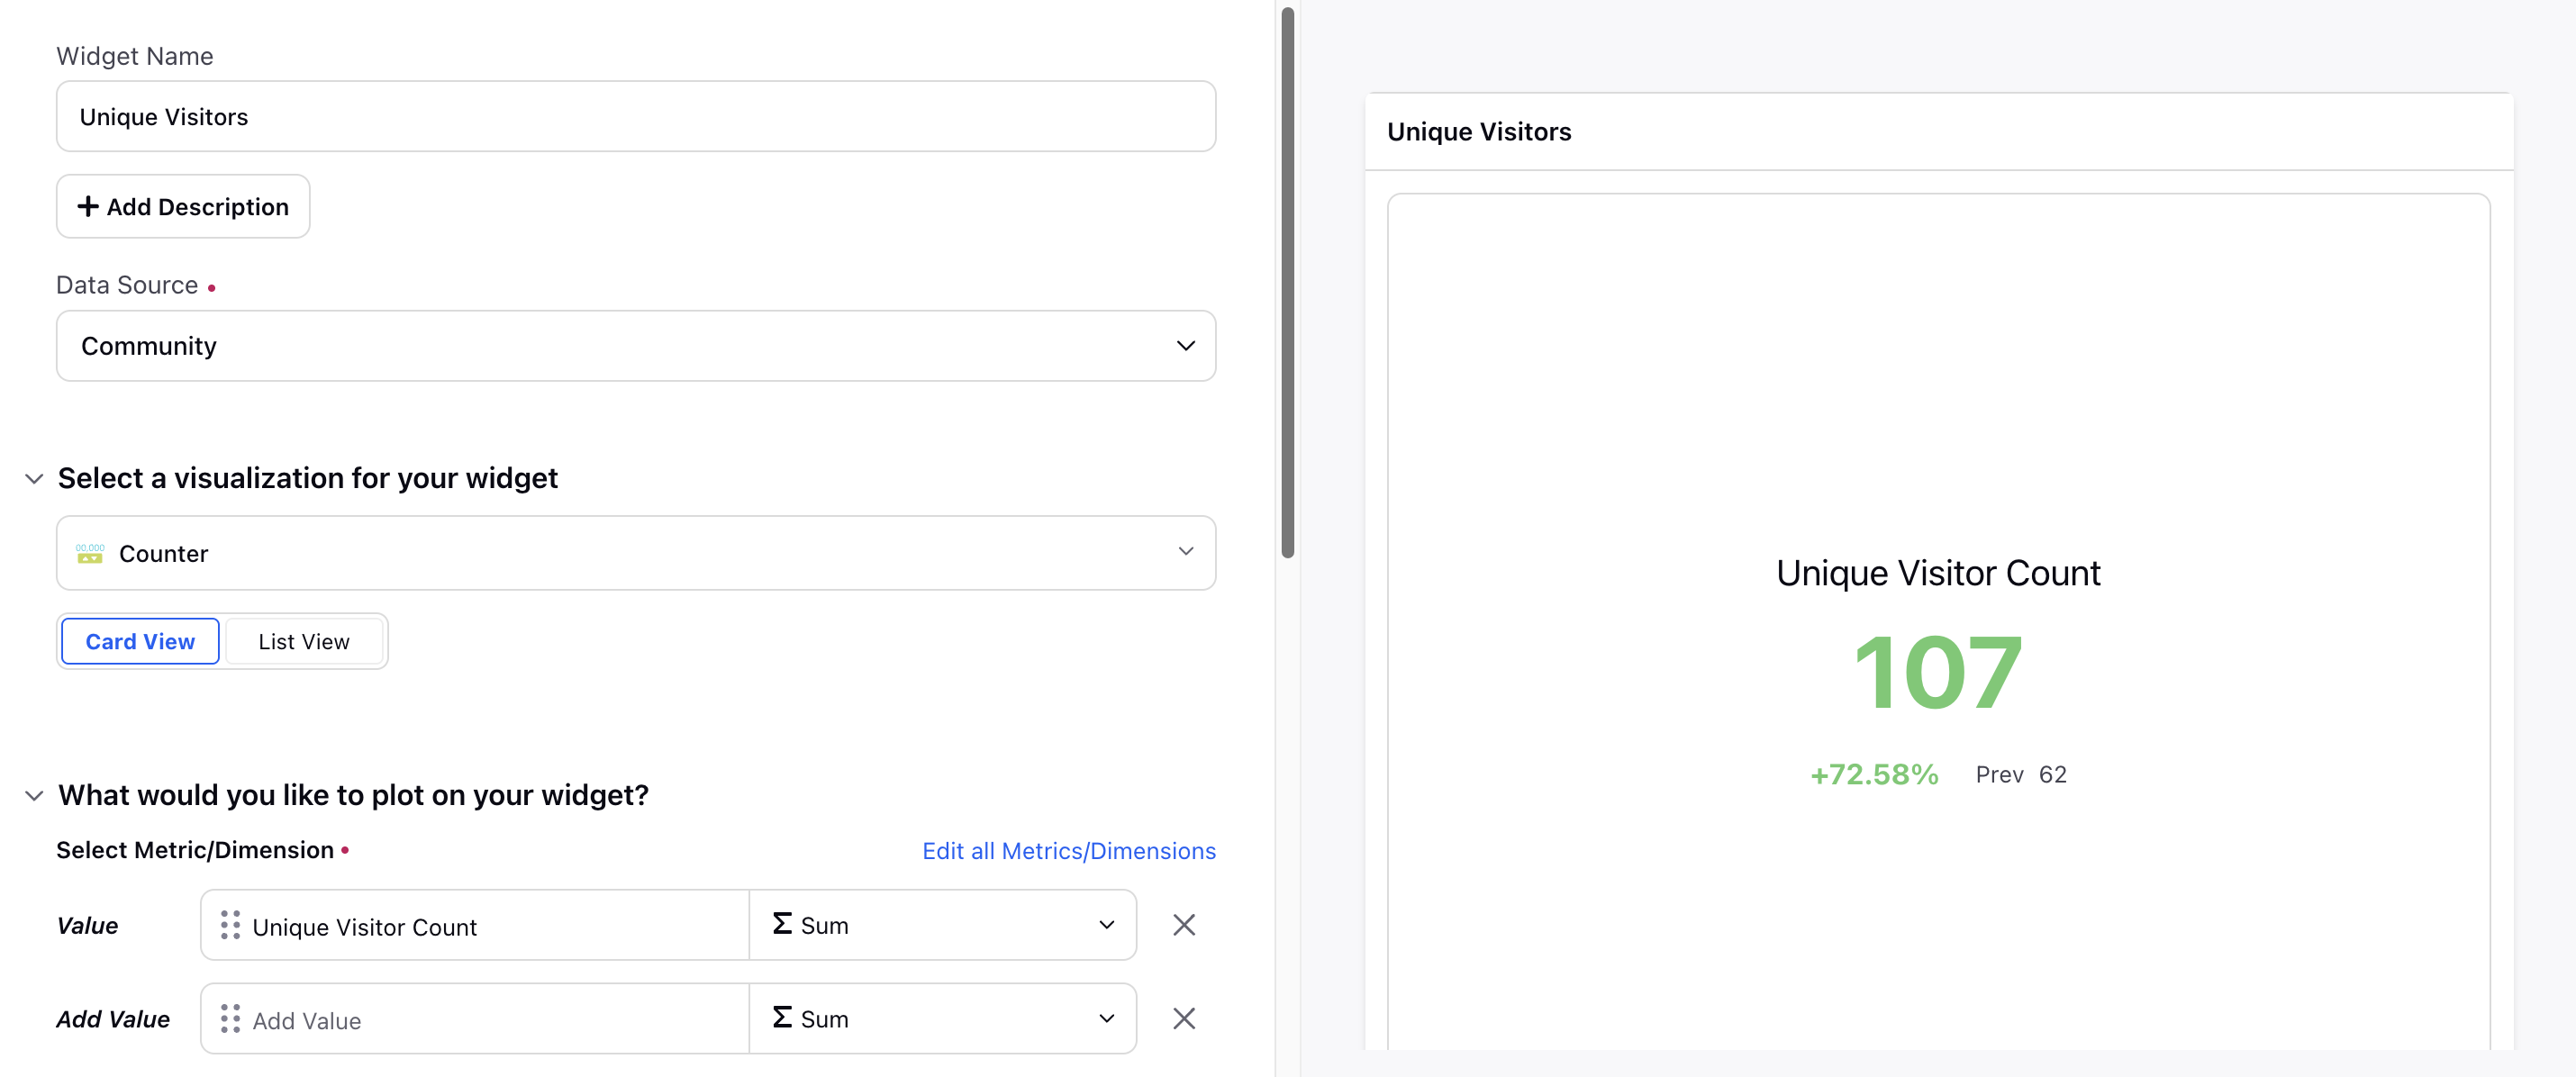
Unique Visitors
Understanding the number of unique visitors helps understand the reach and engagement of your help center. This section provides insights into the distinct users accessing your content.
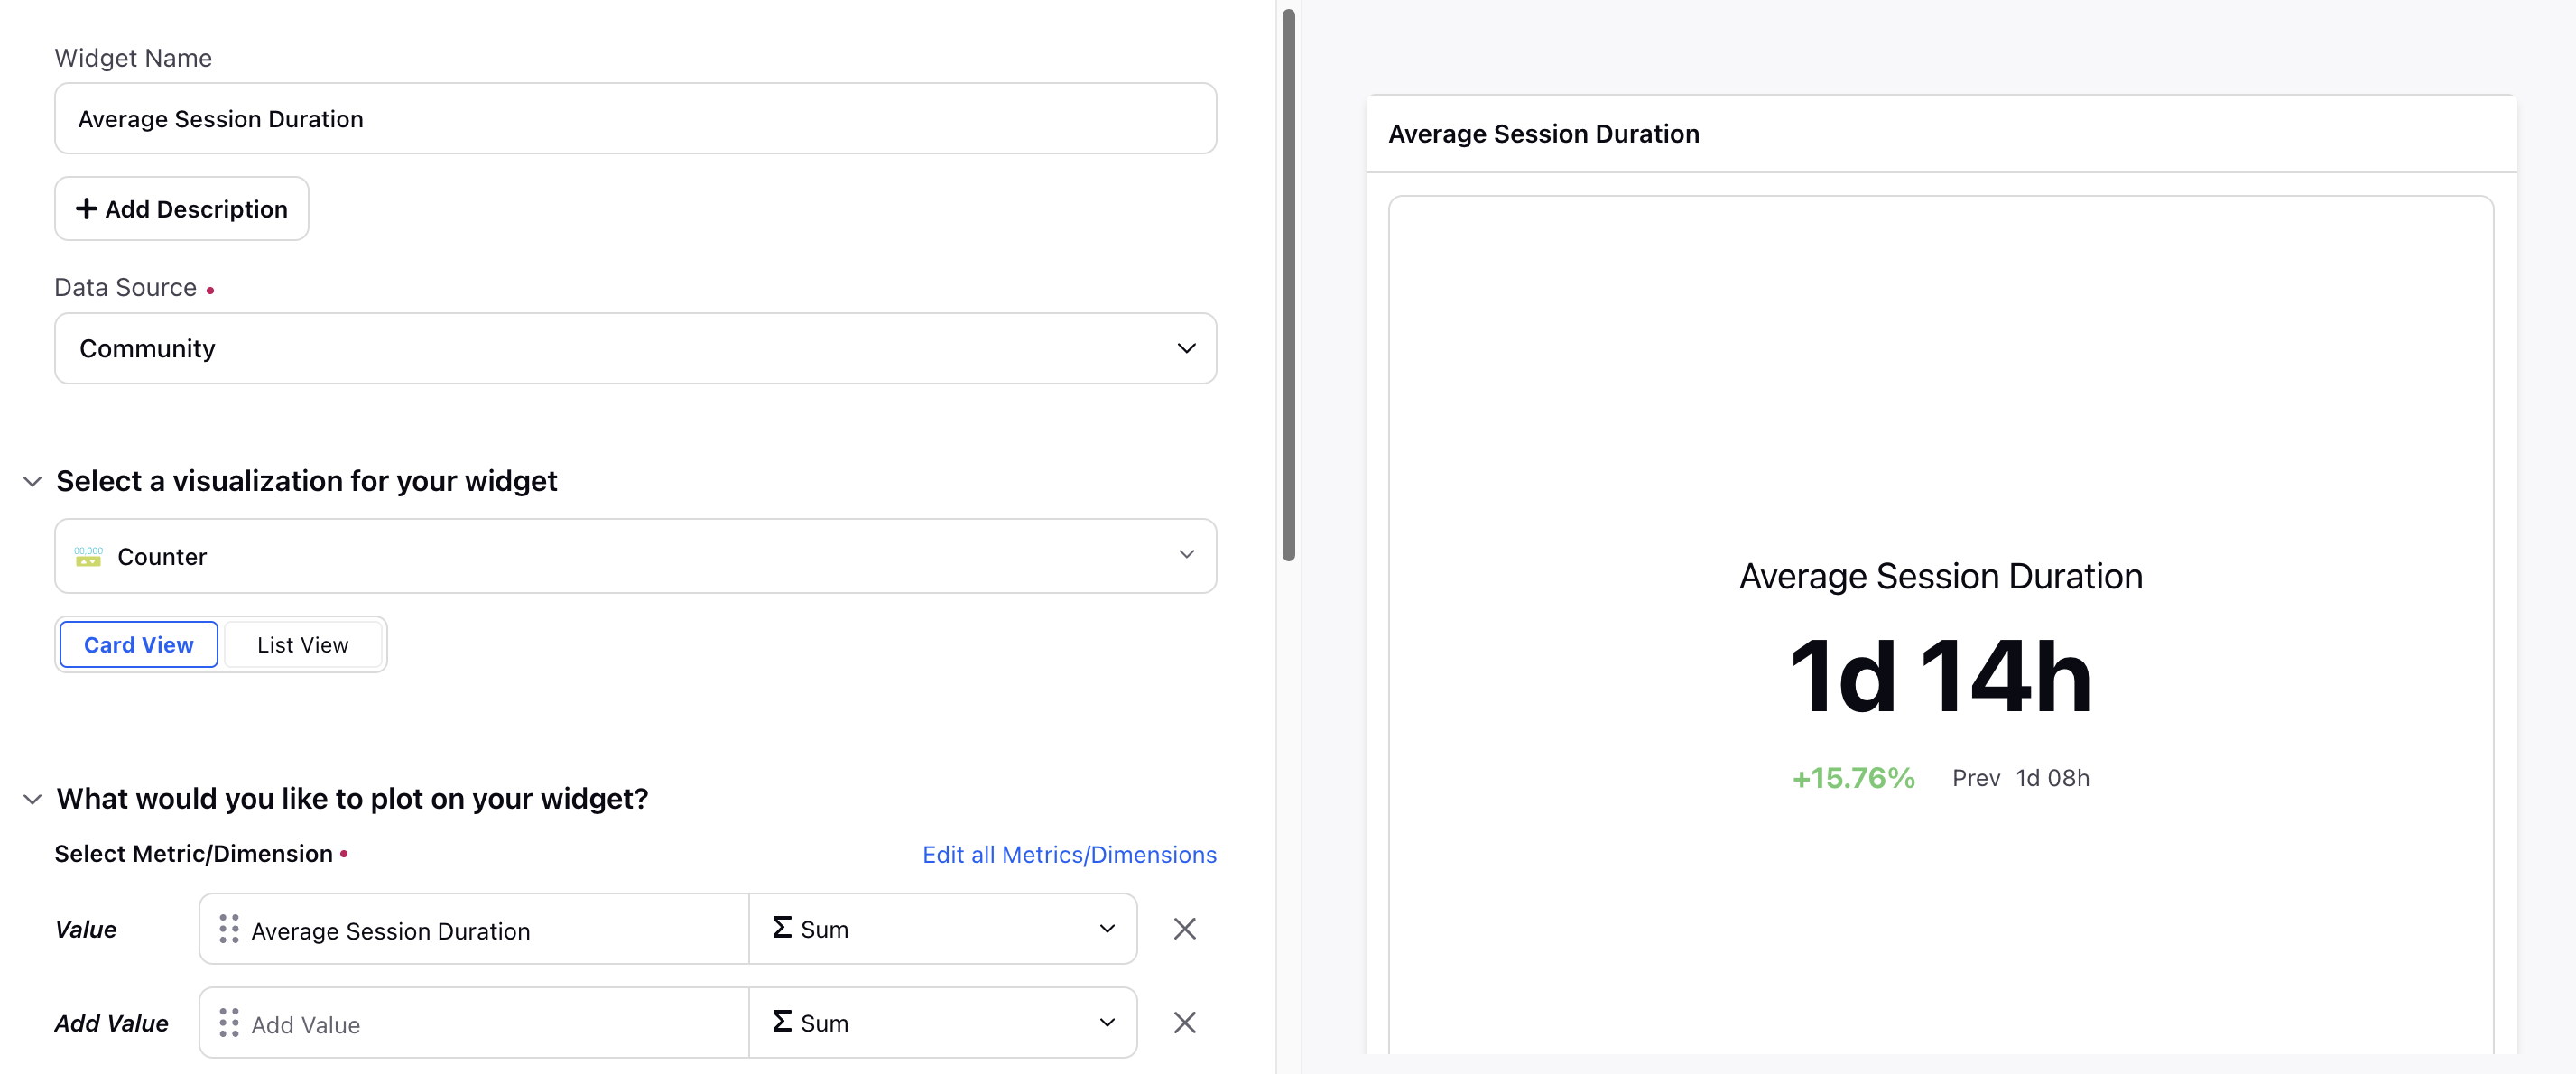
Average Session Duration
The average session duration indicates how long users spend at your help center. This section lists the required Widget configuration (including Metrics, Dimensions, and filters) to track the time users engage with your content, helping identify areas for improvement.
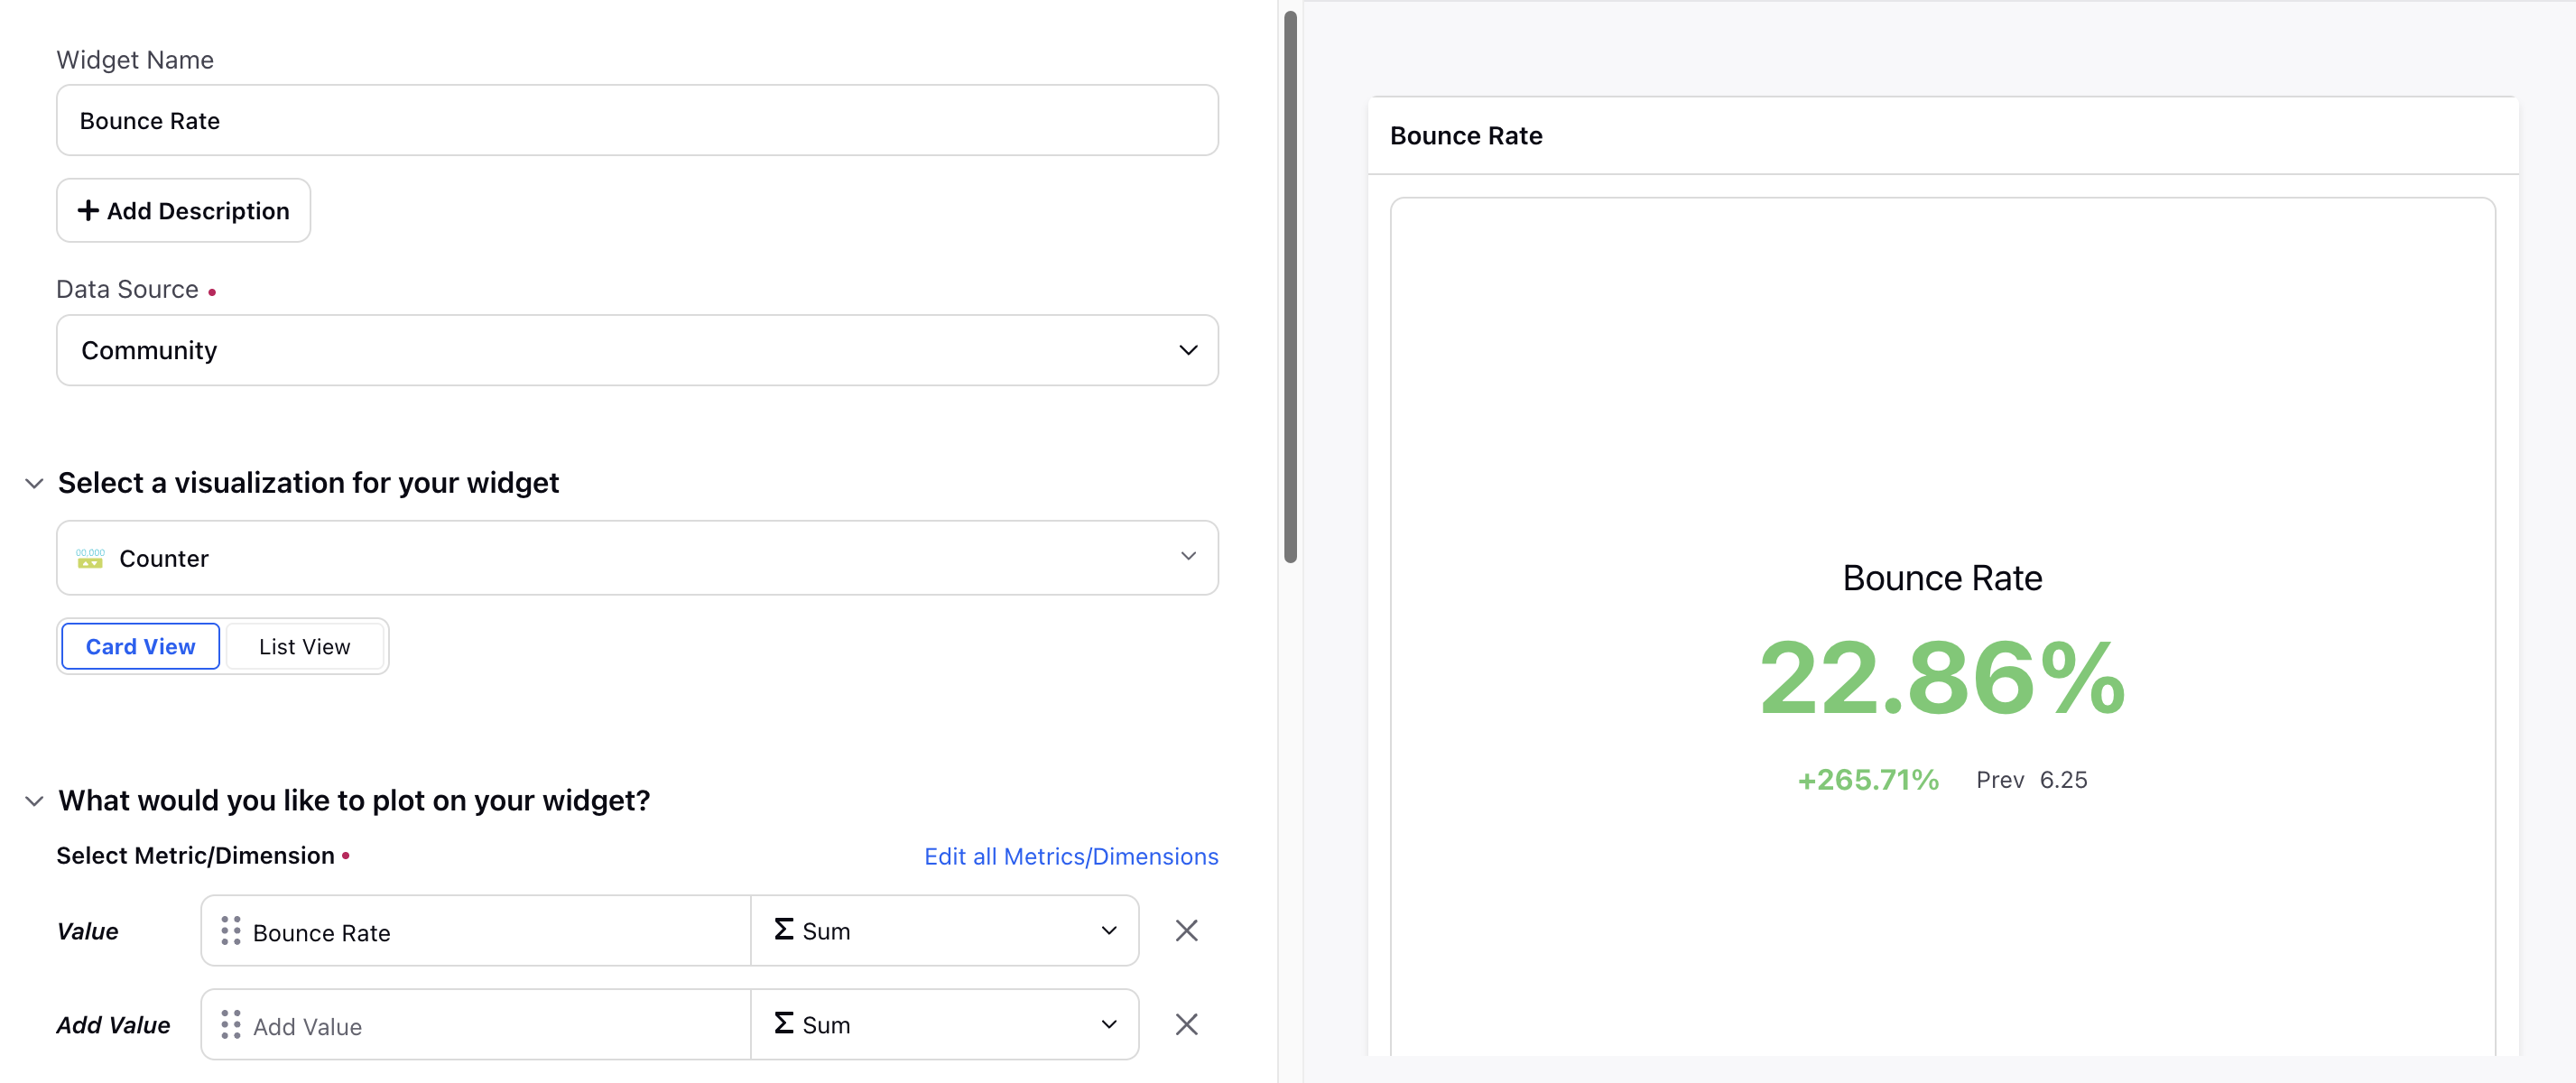
Bounce Rate
Bounce rate measures the percentage of visitors who leave your site after viewing only one page. A bounce rate of 40% or lower is considered optimal. This section lists the required Widget configuration (including Metrics, Dimensions, and filters) to analyze bounce rates to help improve user retention and content effectiveness.
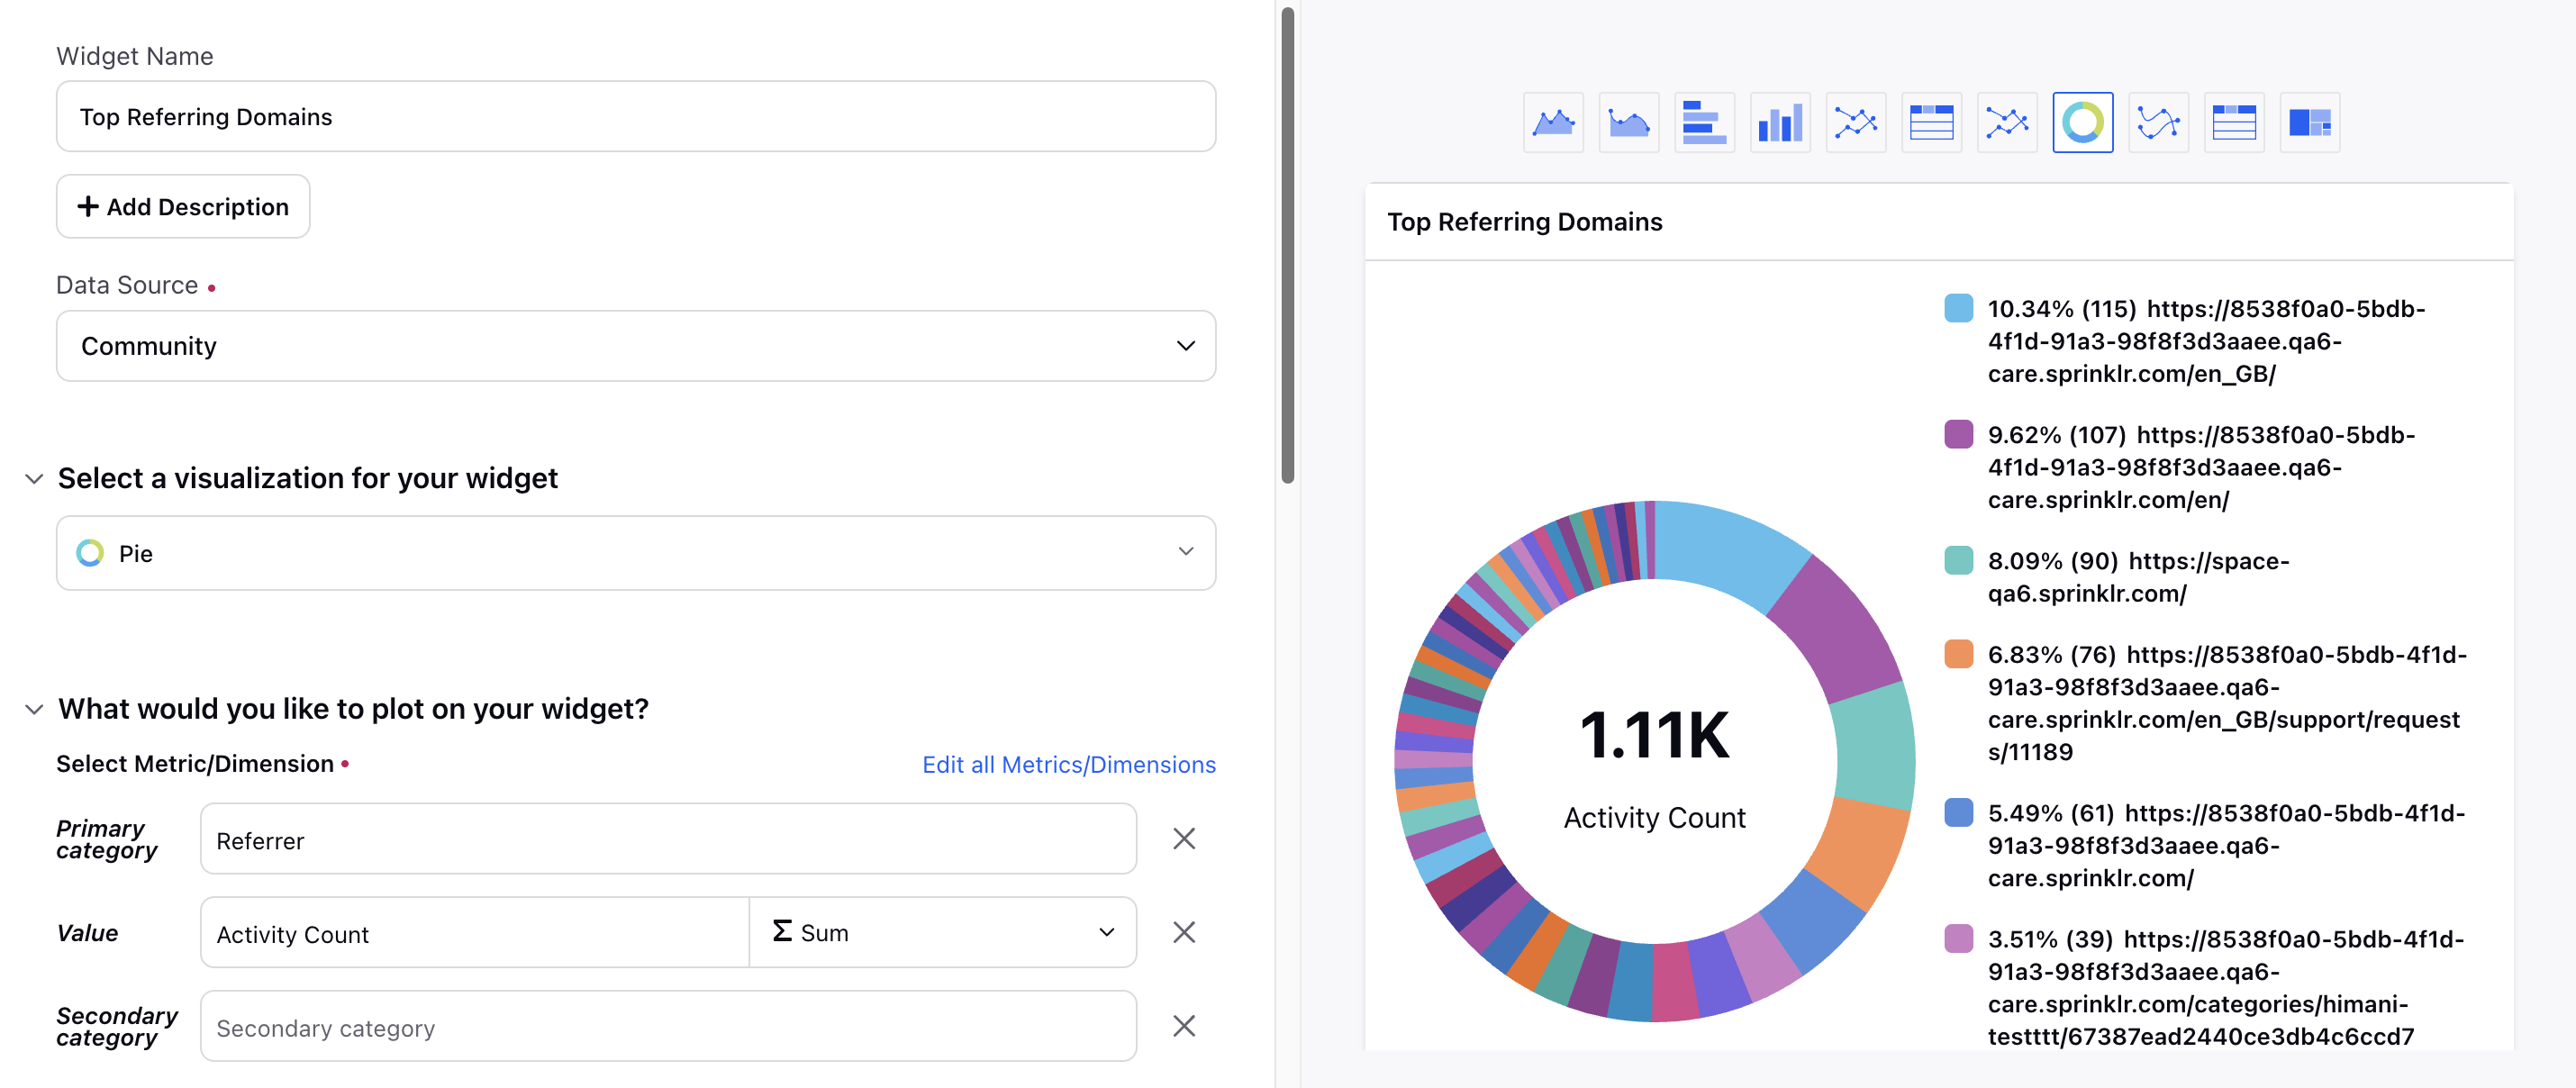
Top Referring Domains
Identifying top referring domains reveals where your traffic is coming from. This section lists the required Widget configuration (including Metrics, Dimensions, and filters) to highlight the external sources driving visitors to your help center.
Compare Website Visits and Page Views
Comparing website visits and page views helps understand user engagement and navigation patterns. This section lists the required Widget configuration (including Metrics, Dimensions, and filters) to examine the relationship between overall visits and page views.

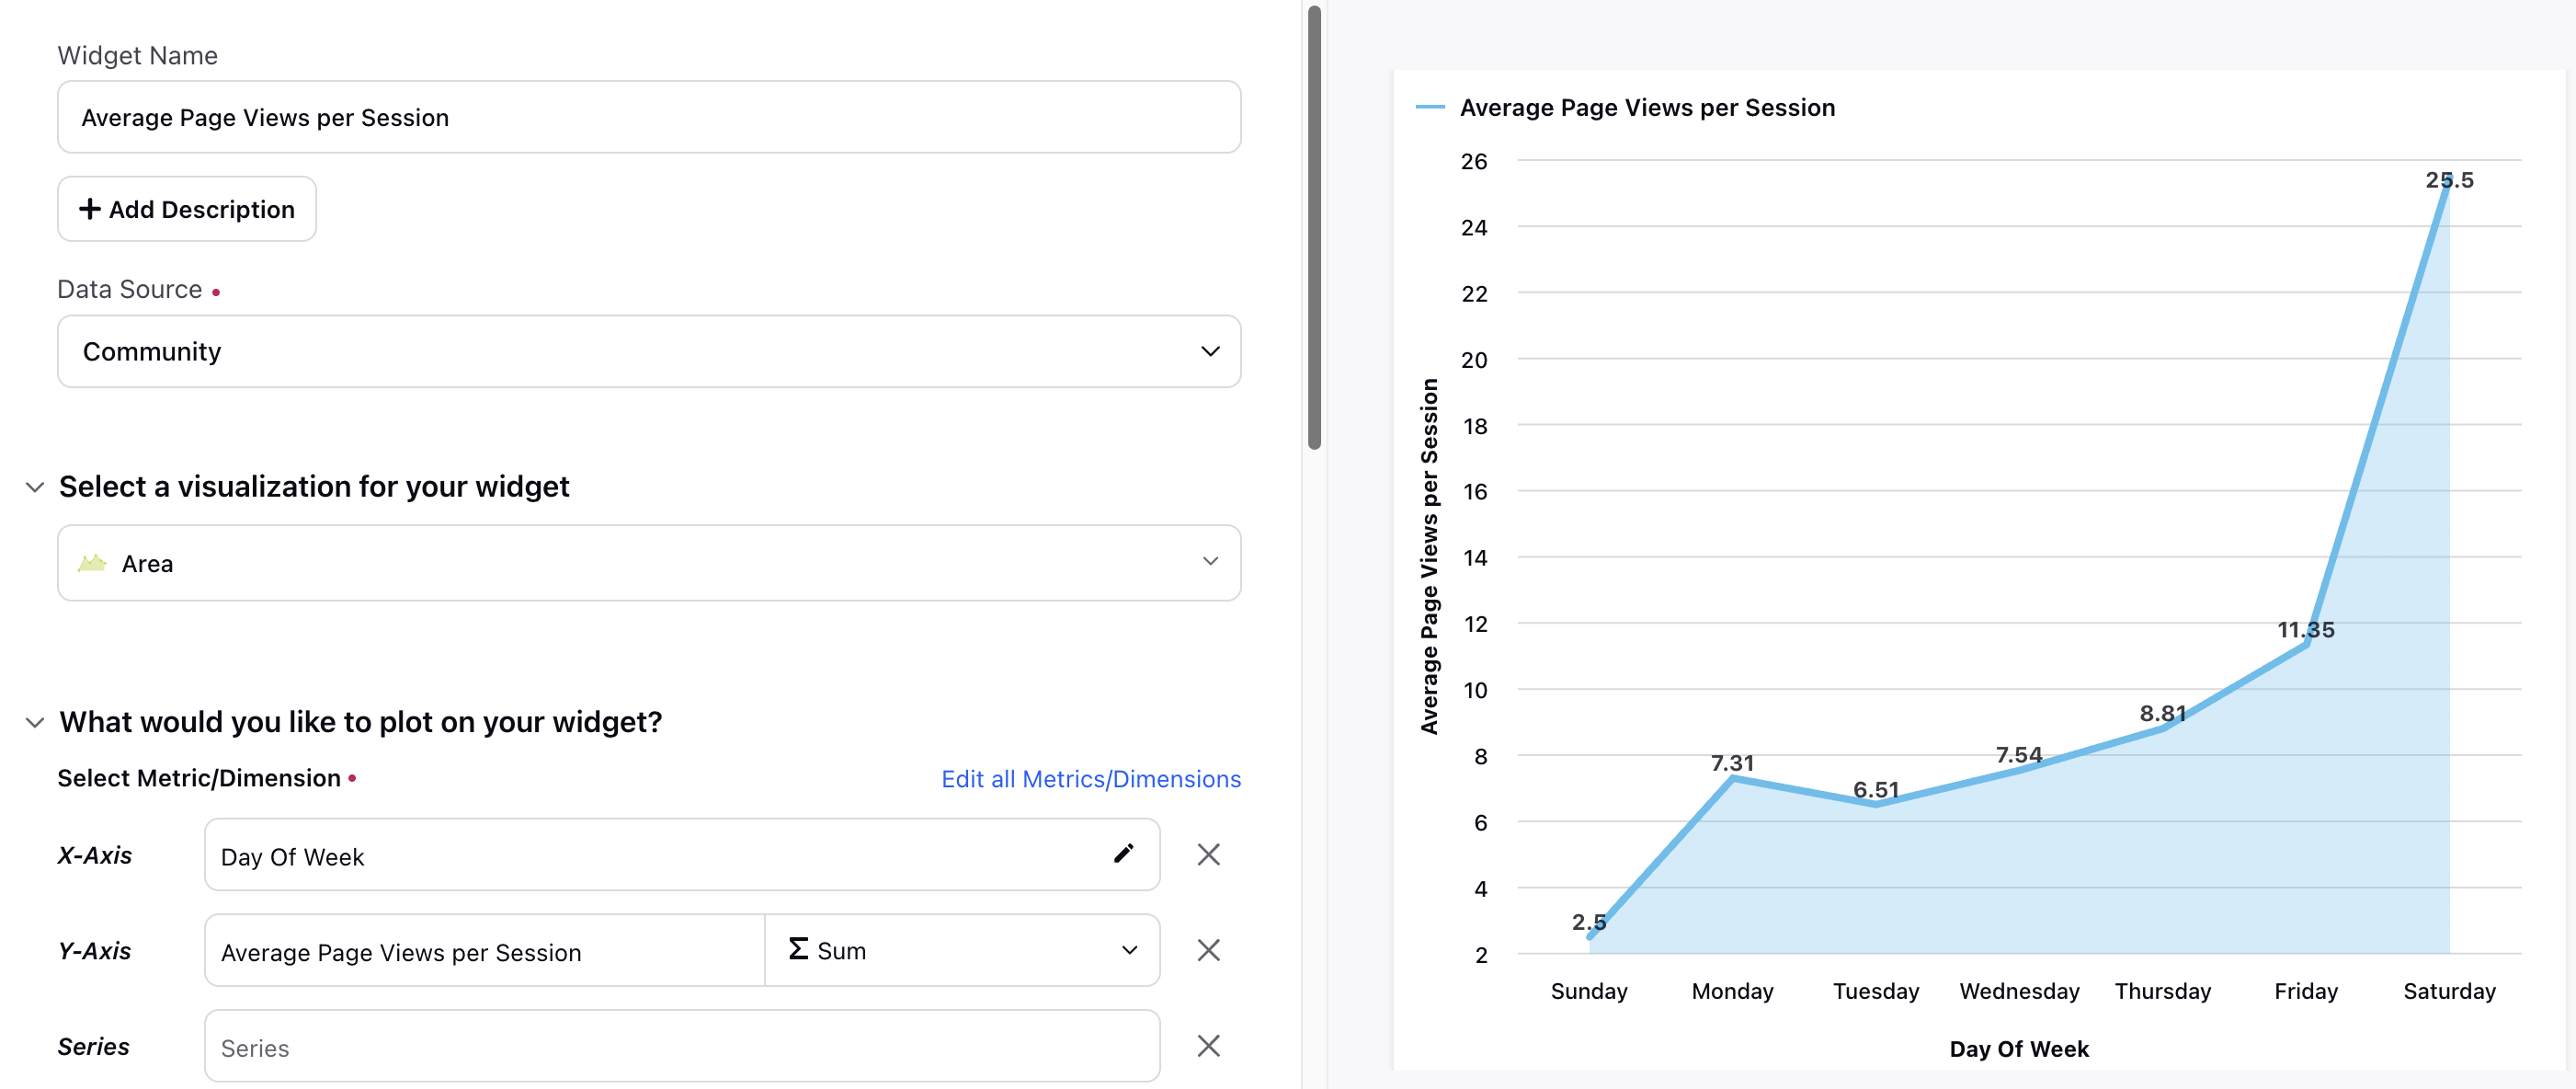
Average Page Views per Session
Average page views per session indicate how many pages a user typically views during a visit. This section lists the required Widget configuration (including Metrics, Dimensions, and filters) to provide insights into user engagement and content interest.
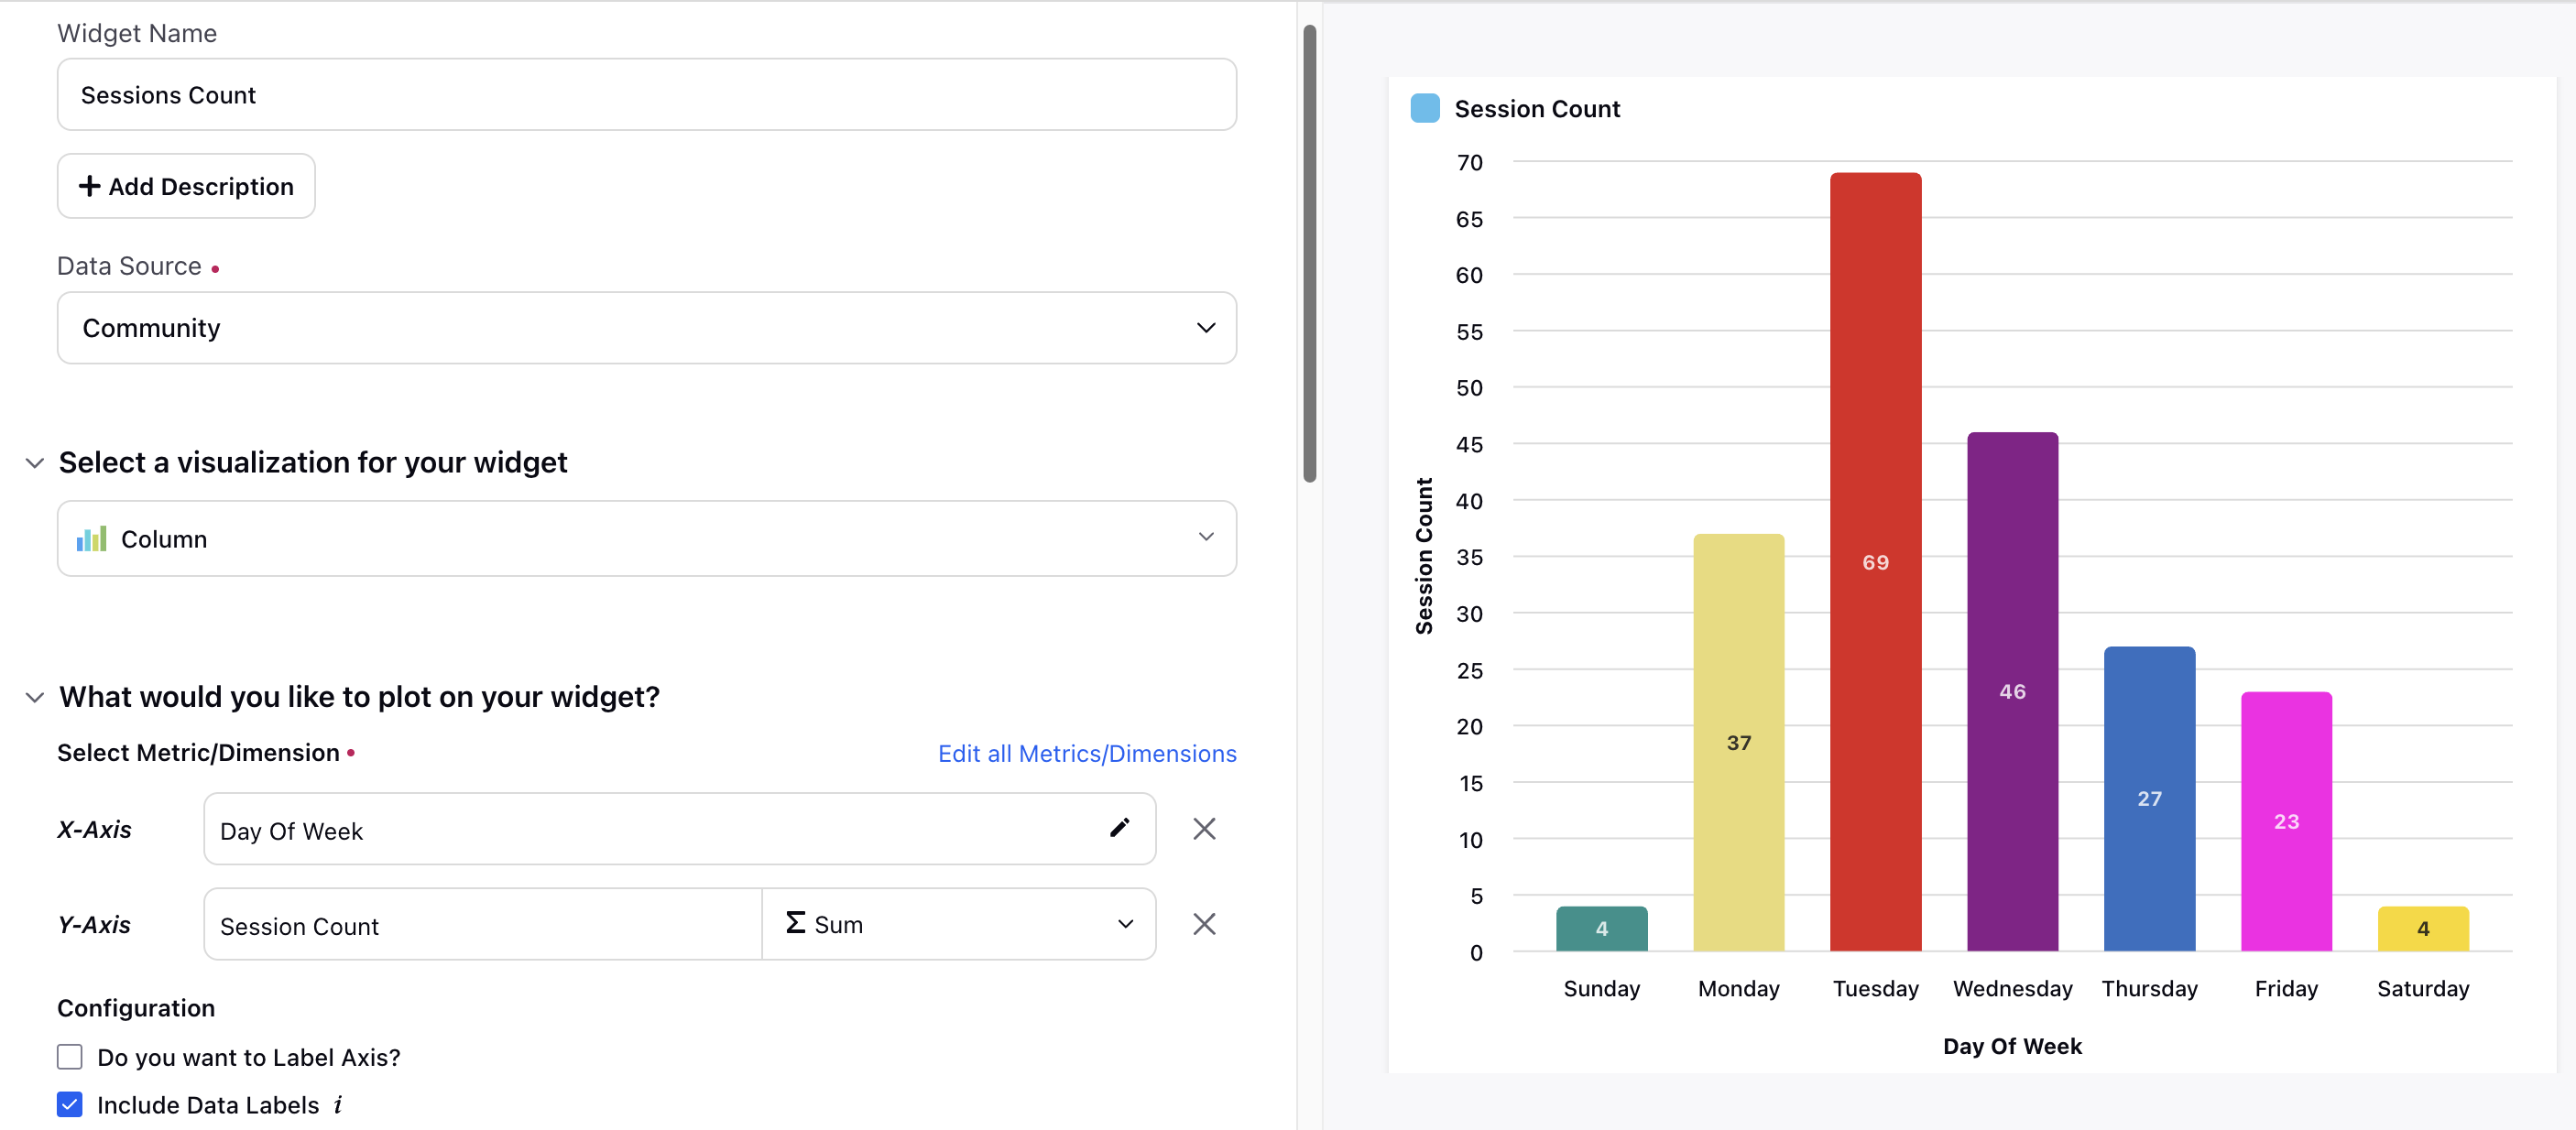
Session Count
Tracking the number of sessions helps measure overall user activity. This section lists the required Widget configuration (including Metrics, Dimensions, and filters) for details on total sessions to understand user engagement trends.
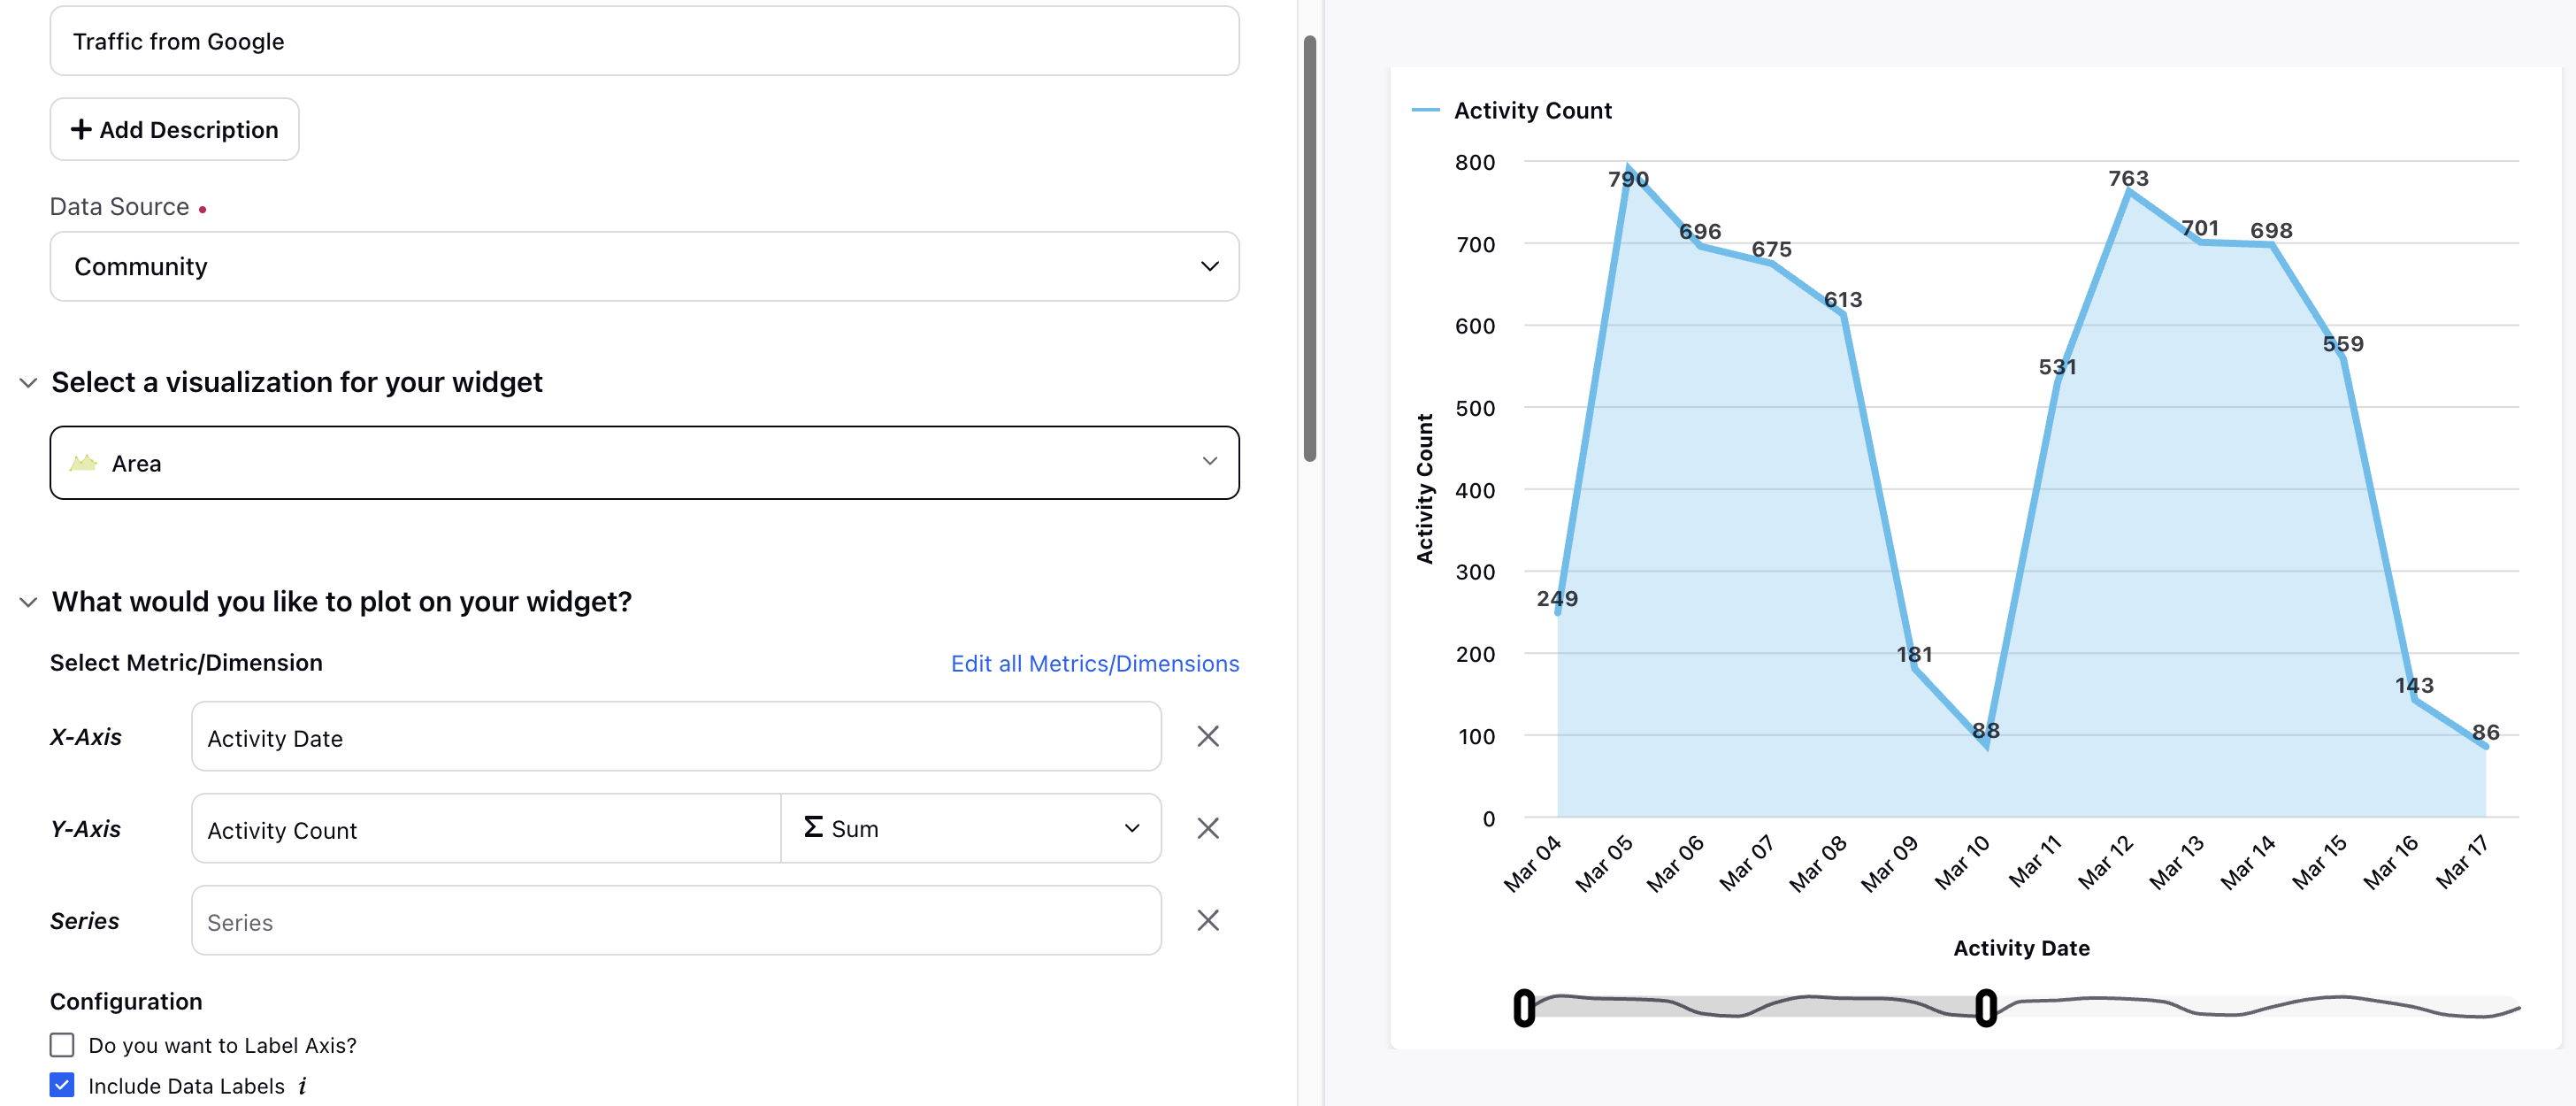
Traffic from Google
Understanding traffic from Google helps optimize your search engine visibility. This section lists the required Widget configuration (including Metrics, Dimensions, and filters) to analyze the volume and quality of traffic originating from Google searches.
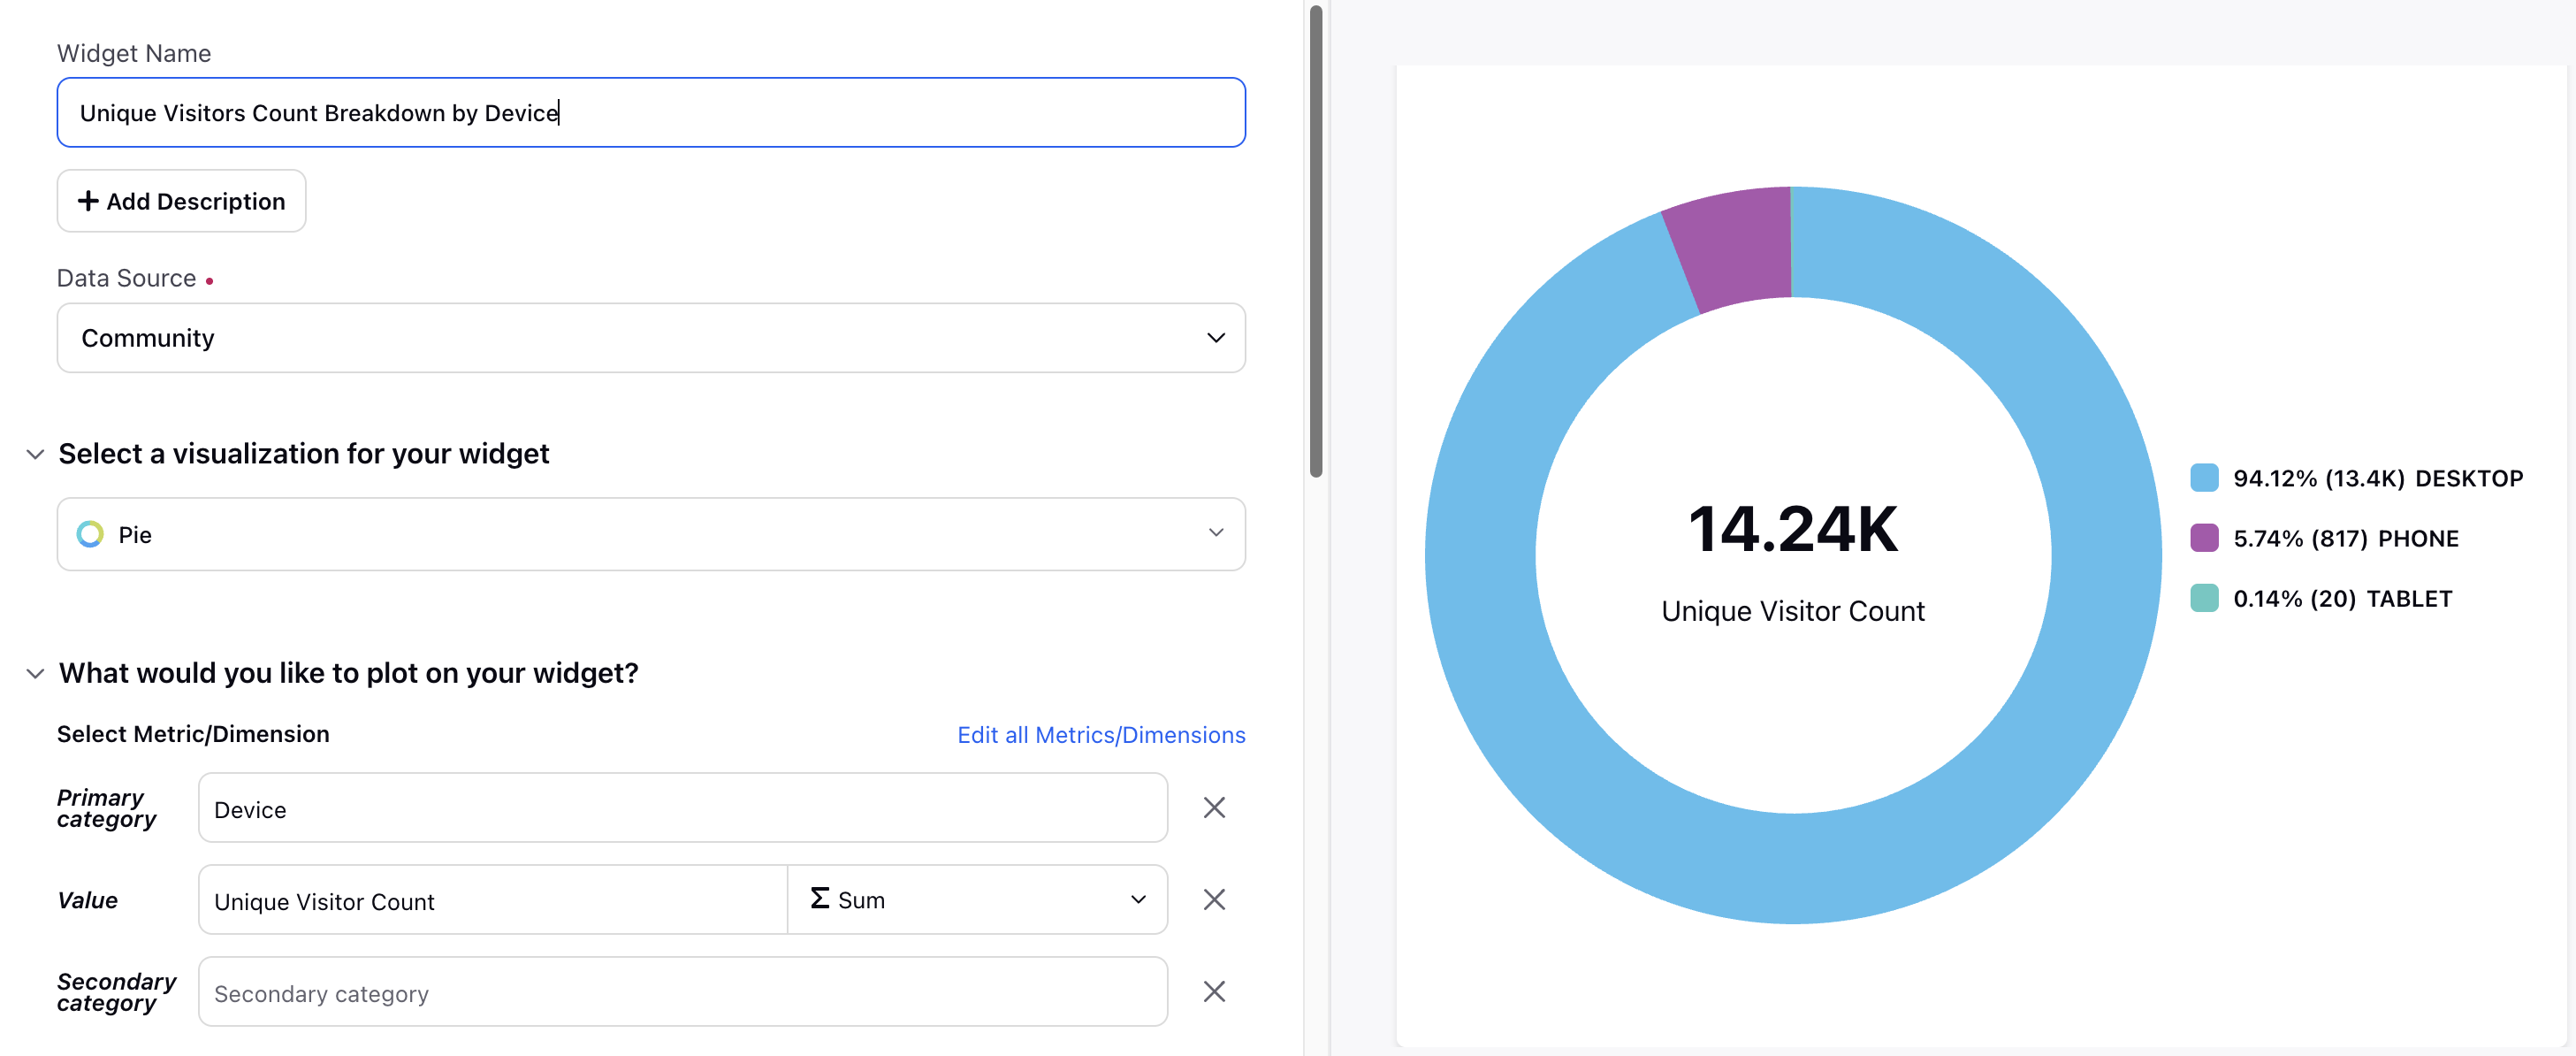
Unique Visitors Breakdown by Device
Analyzing unique visitors by device type helps tailor content for different platforms. This section lists the required Widget configuration (including Metrics, Dimensions, and filters) to break down visitor counts by desktop, mobile, and tablet.
Top Articles and Most Searched Queries
Identifying top articles and most searched queries helps understand user interests and content effectiveness. This section highlights popular articles and common search terms.
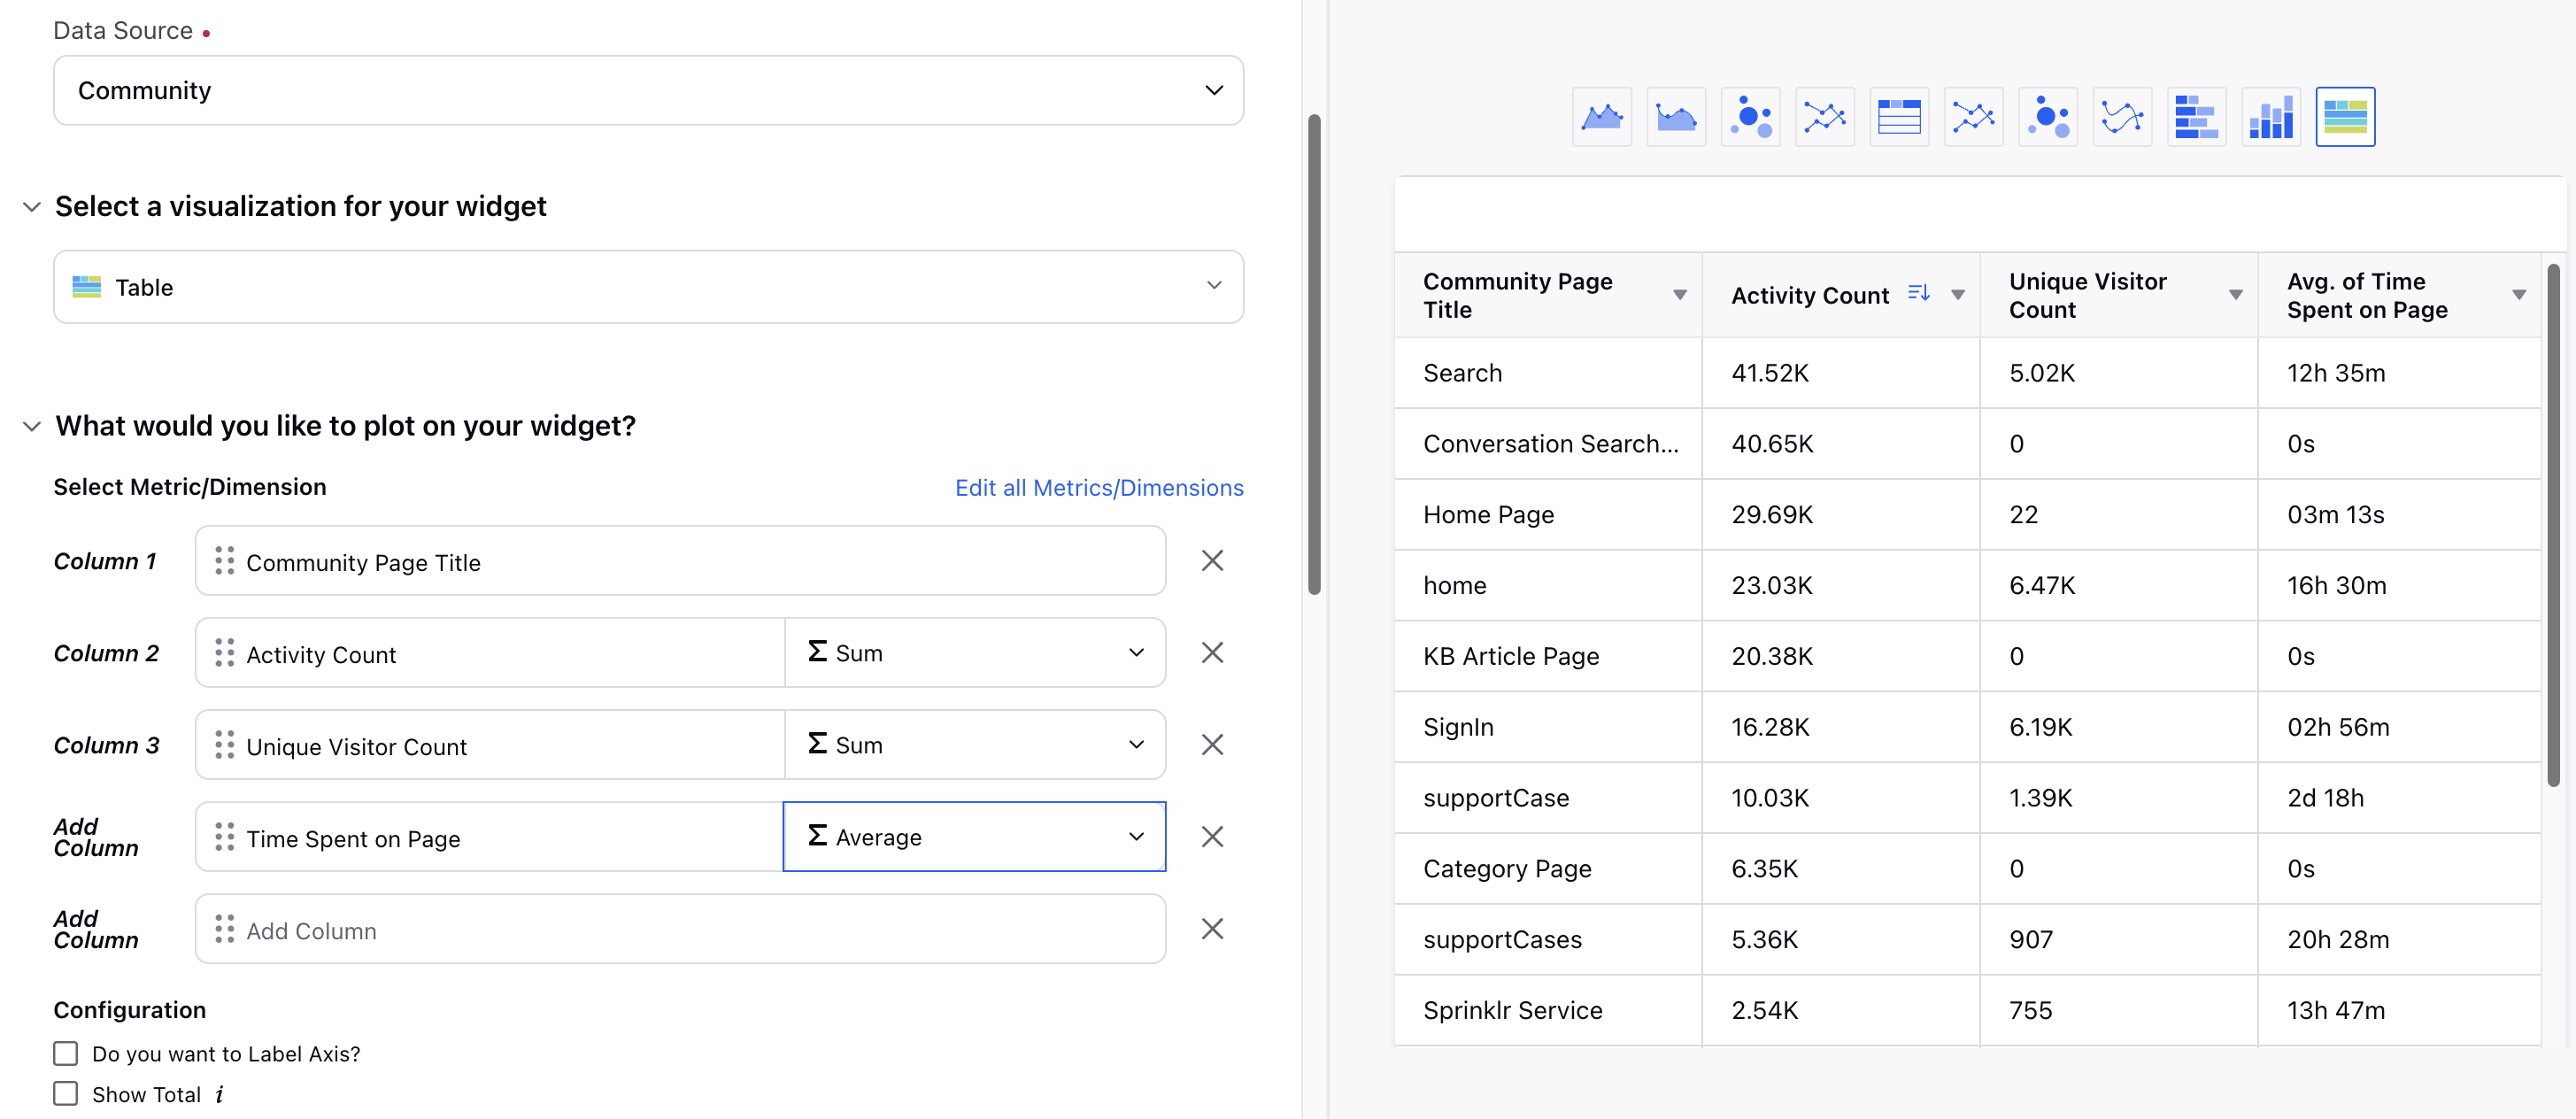
Top Pages
Tracking top URLs reveals the most visited pages on your help center. This section lists the required Widget configuration (including Metrics, Dimensions, and filters) to gather insights into user preferences and high-traffic content.
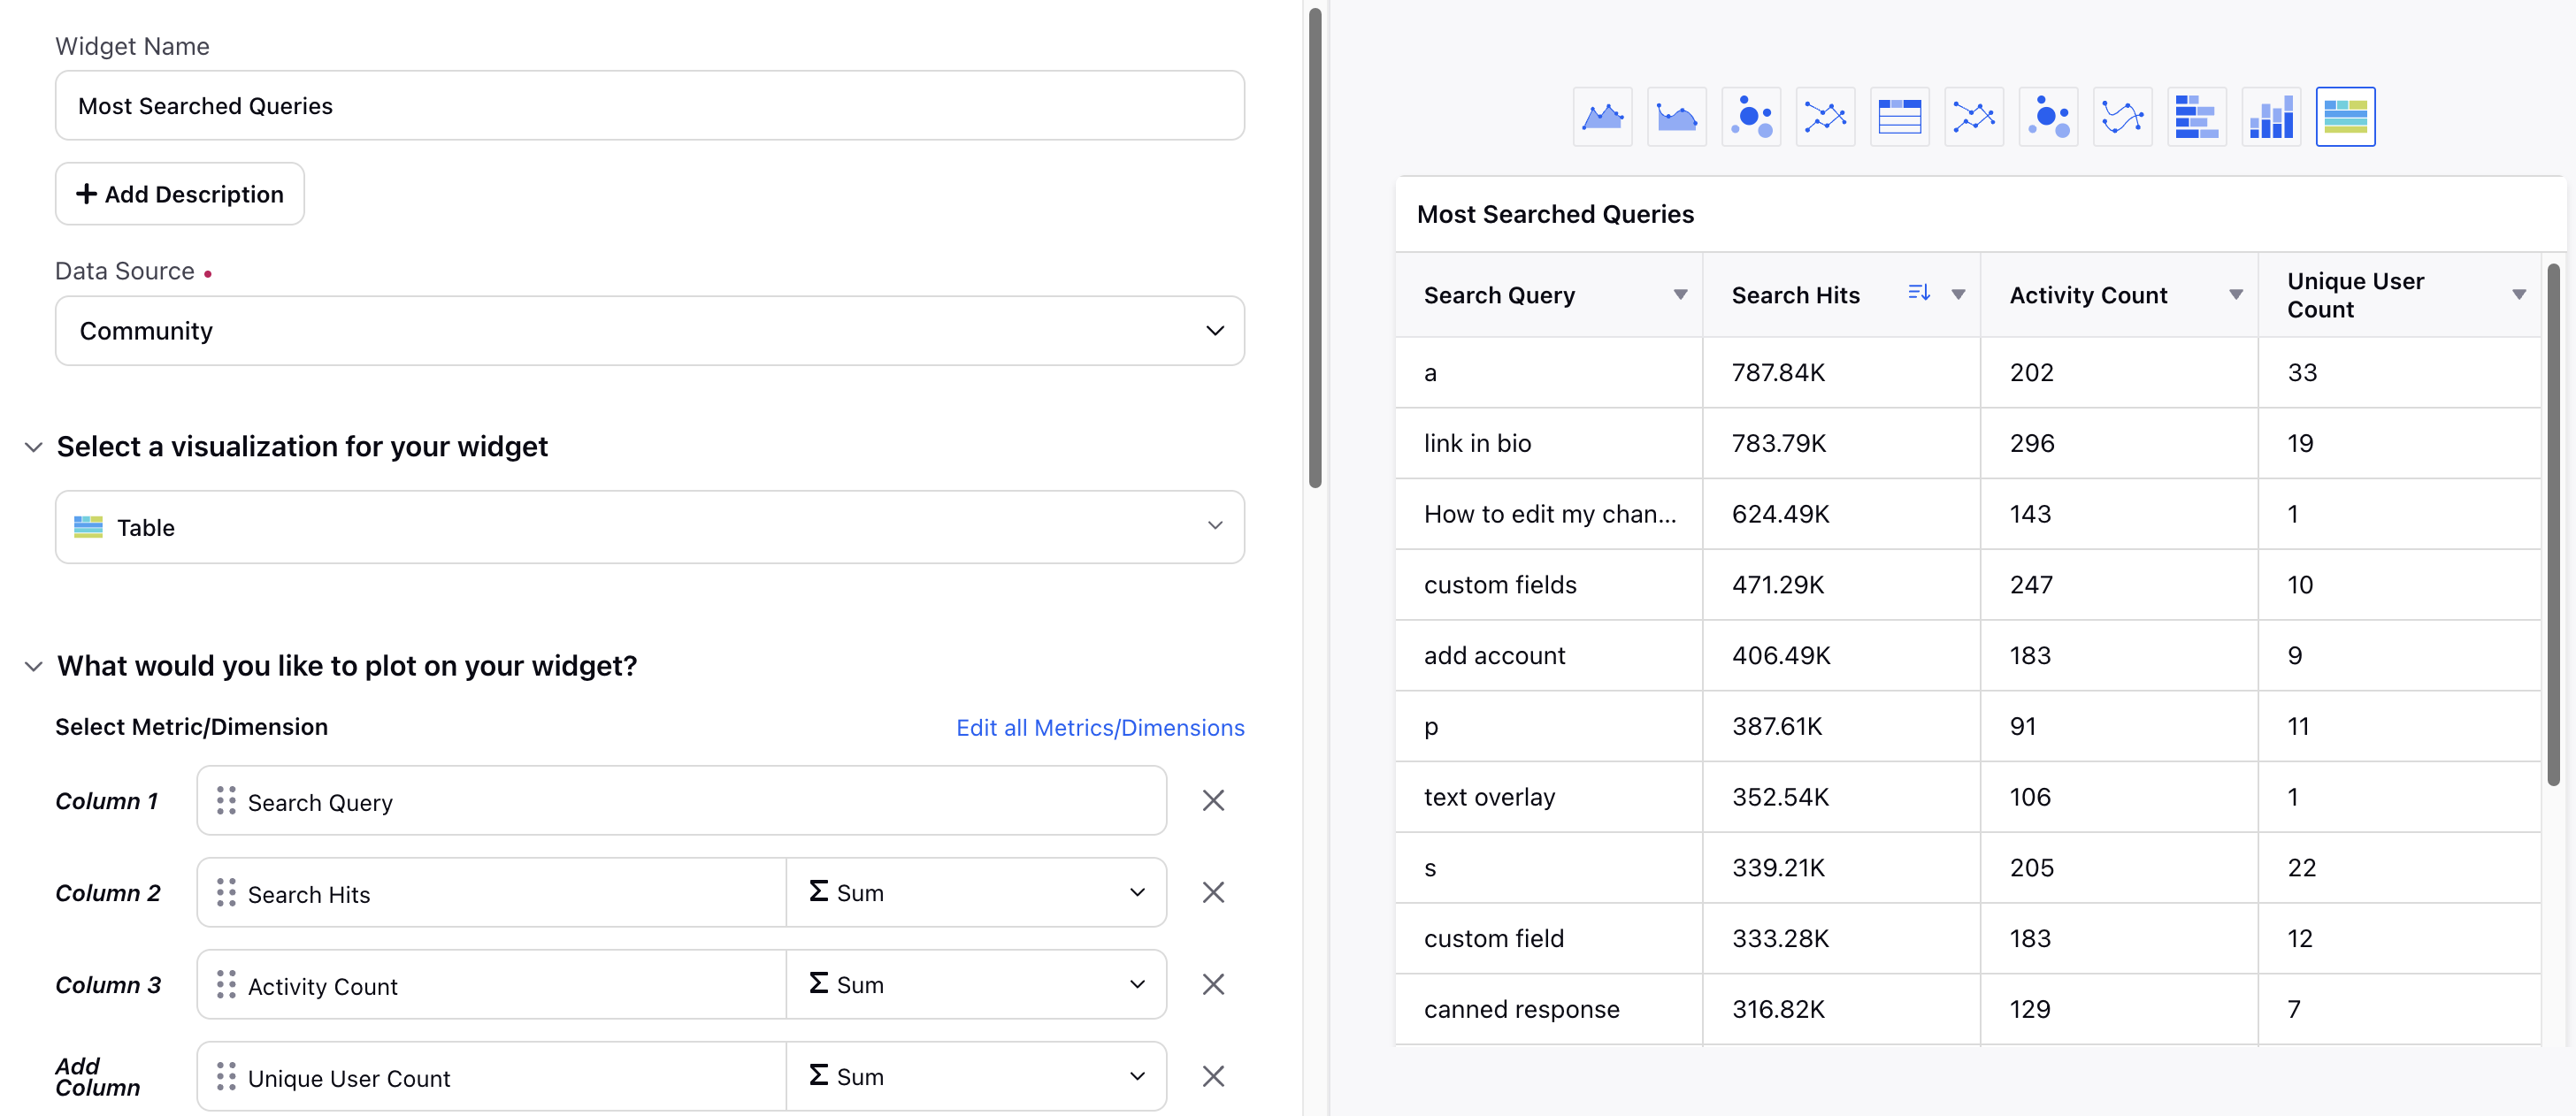
Most Searched Queries
Understanding the most searched queries helps optimize content for user needs. This section lists the required Widget configuration (including Metrics, Dimensions, and filters) to analyze common search terms to improve content relevance.
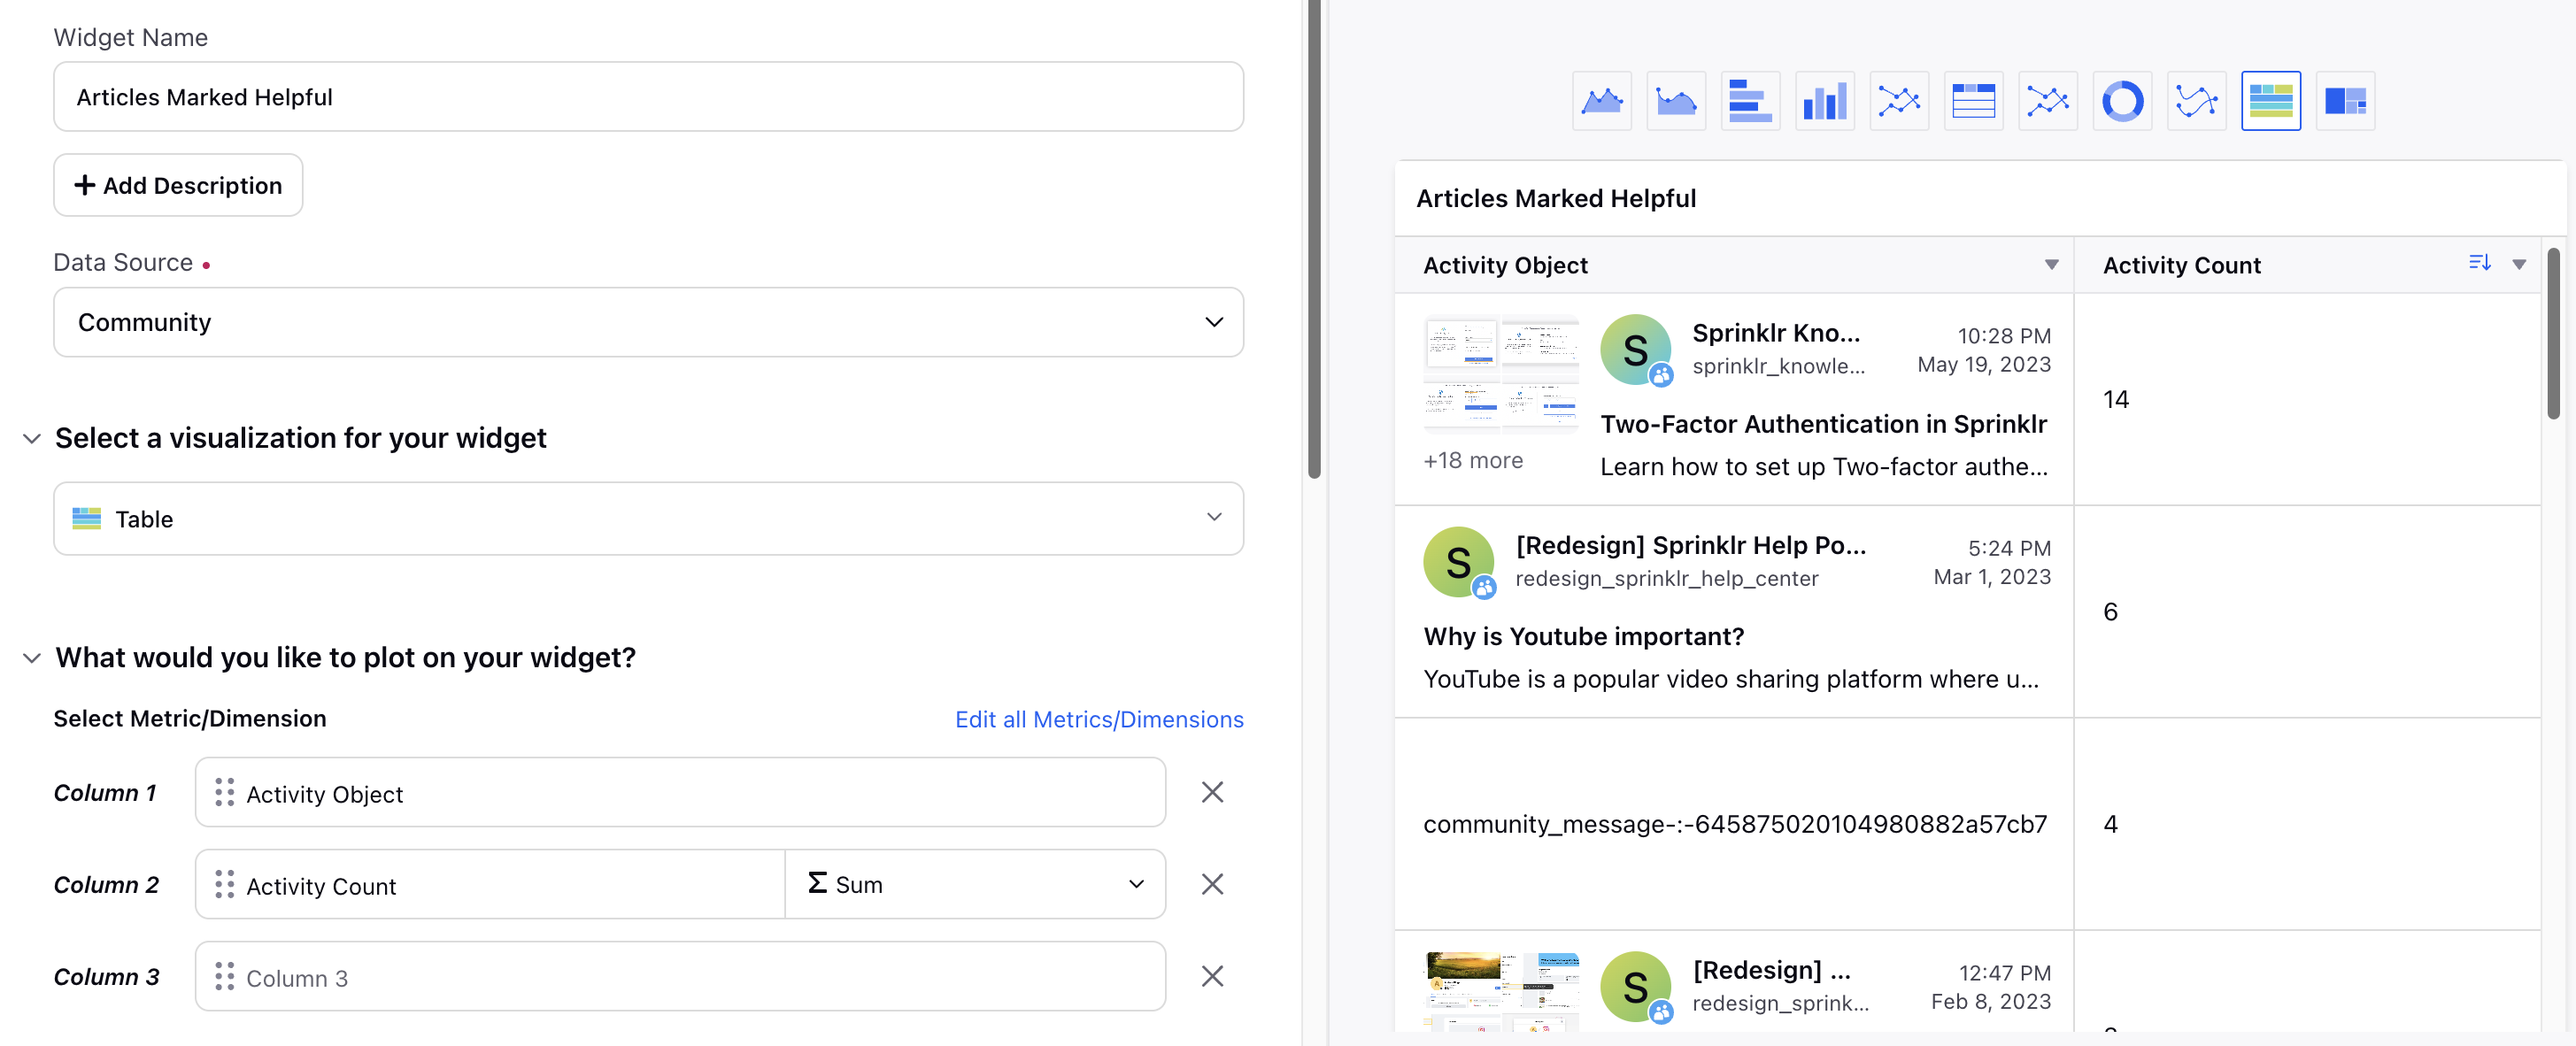
Articles Marked Helpful
Tracking articles marked as helpful provides feedback on content quality. This section lists the required Widget configuration (including Metrics, Dimensions, and filters) to highlight articles that users find valuable and informative.
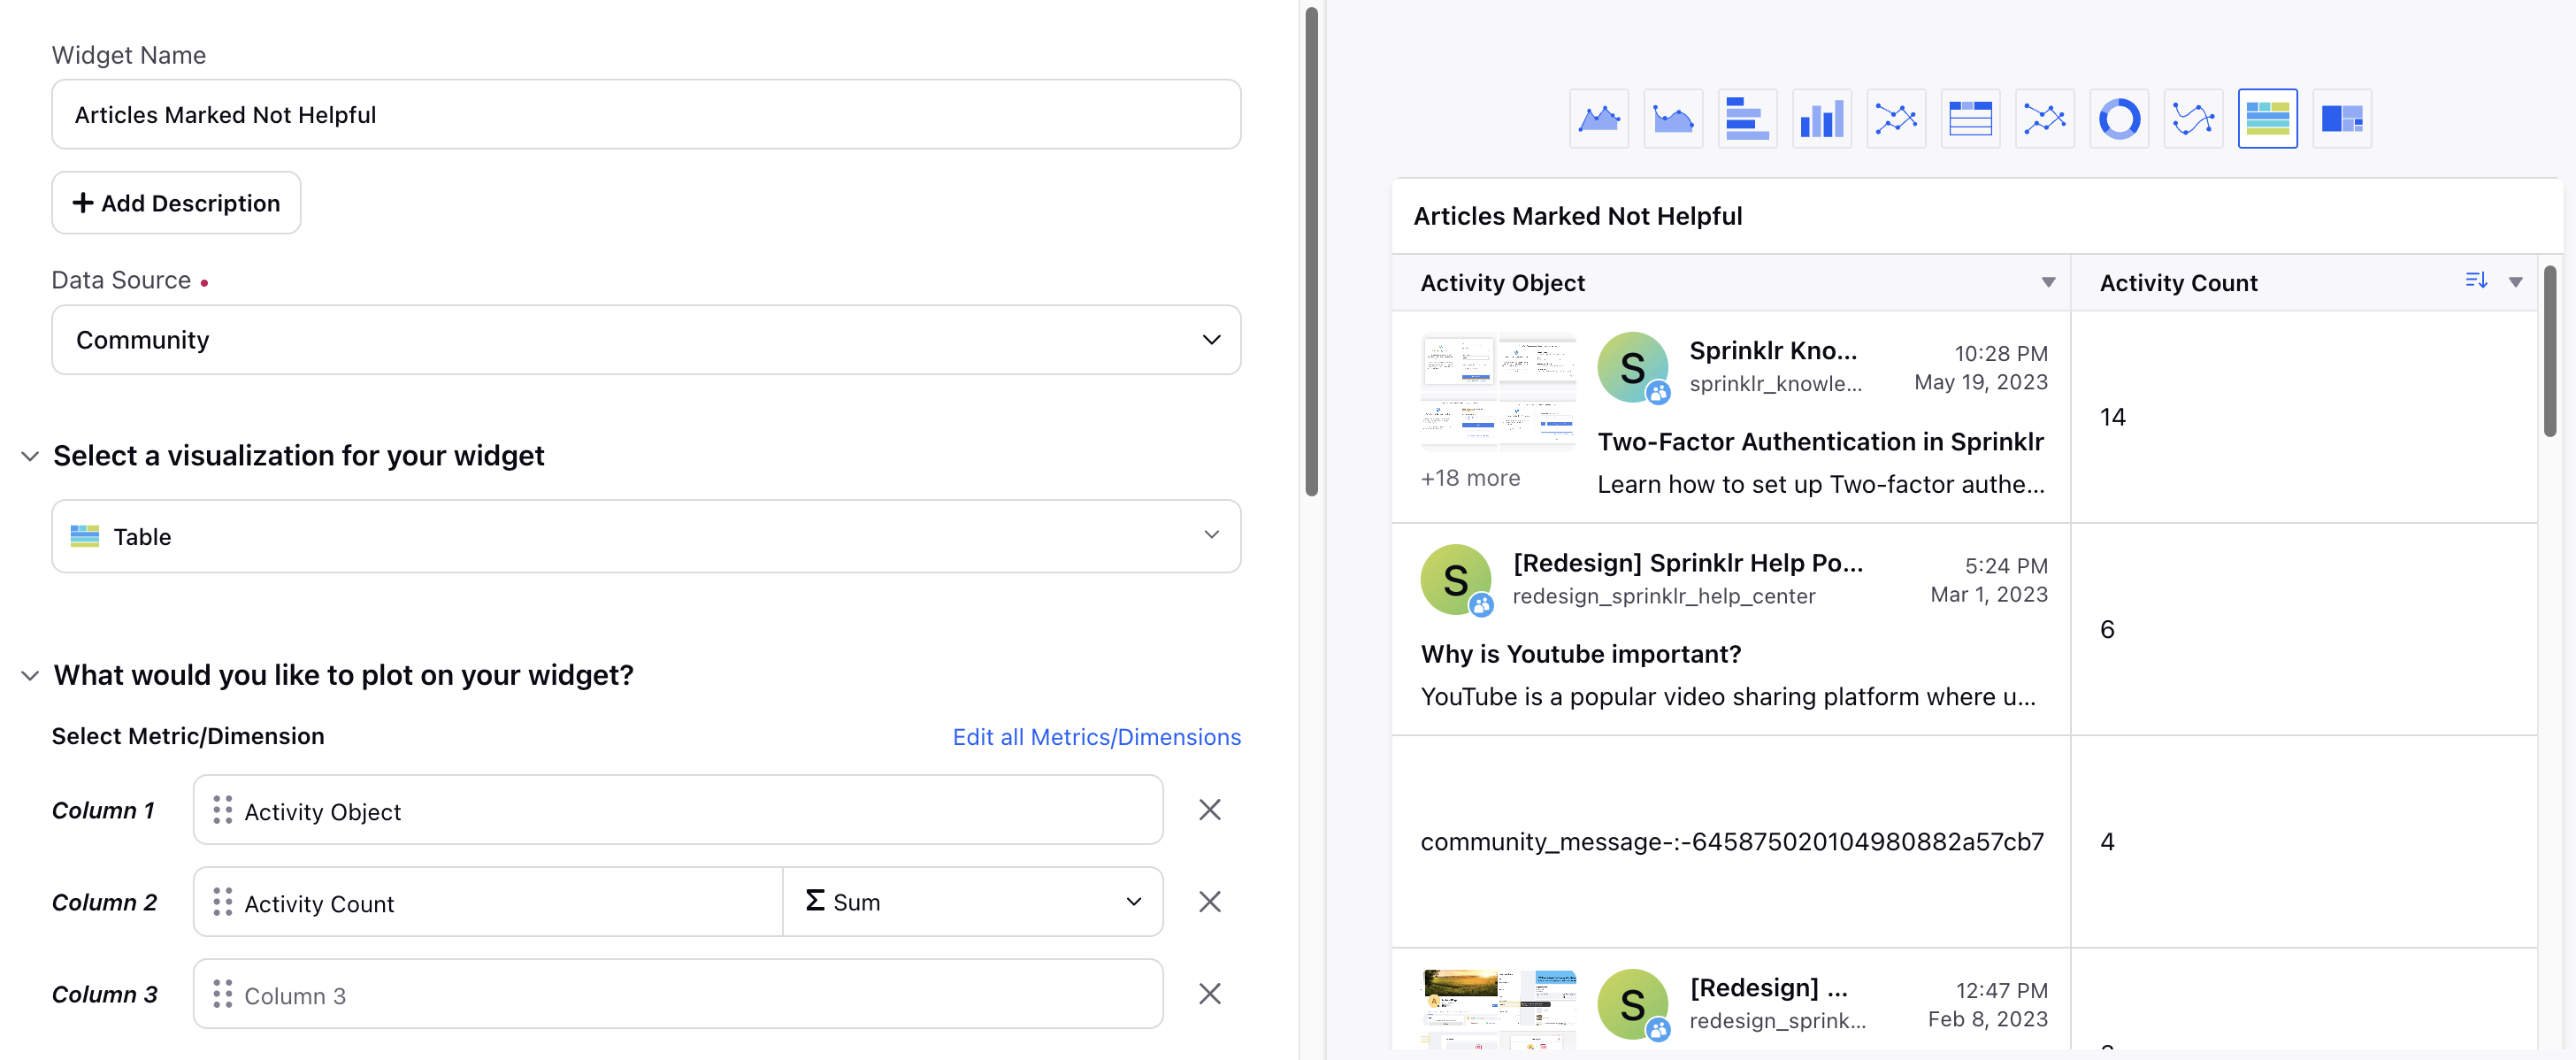
Articles Marked Not Helpful
Identifying articles marked as not helpful helps pinpoint areas for improvement. This section lists the required Widget configuration (including Metrics, Dimensions, and filters) to examine content that may need revision or enhancement.
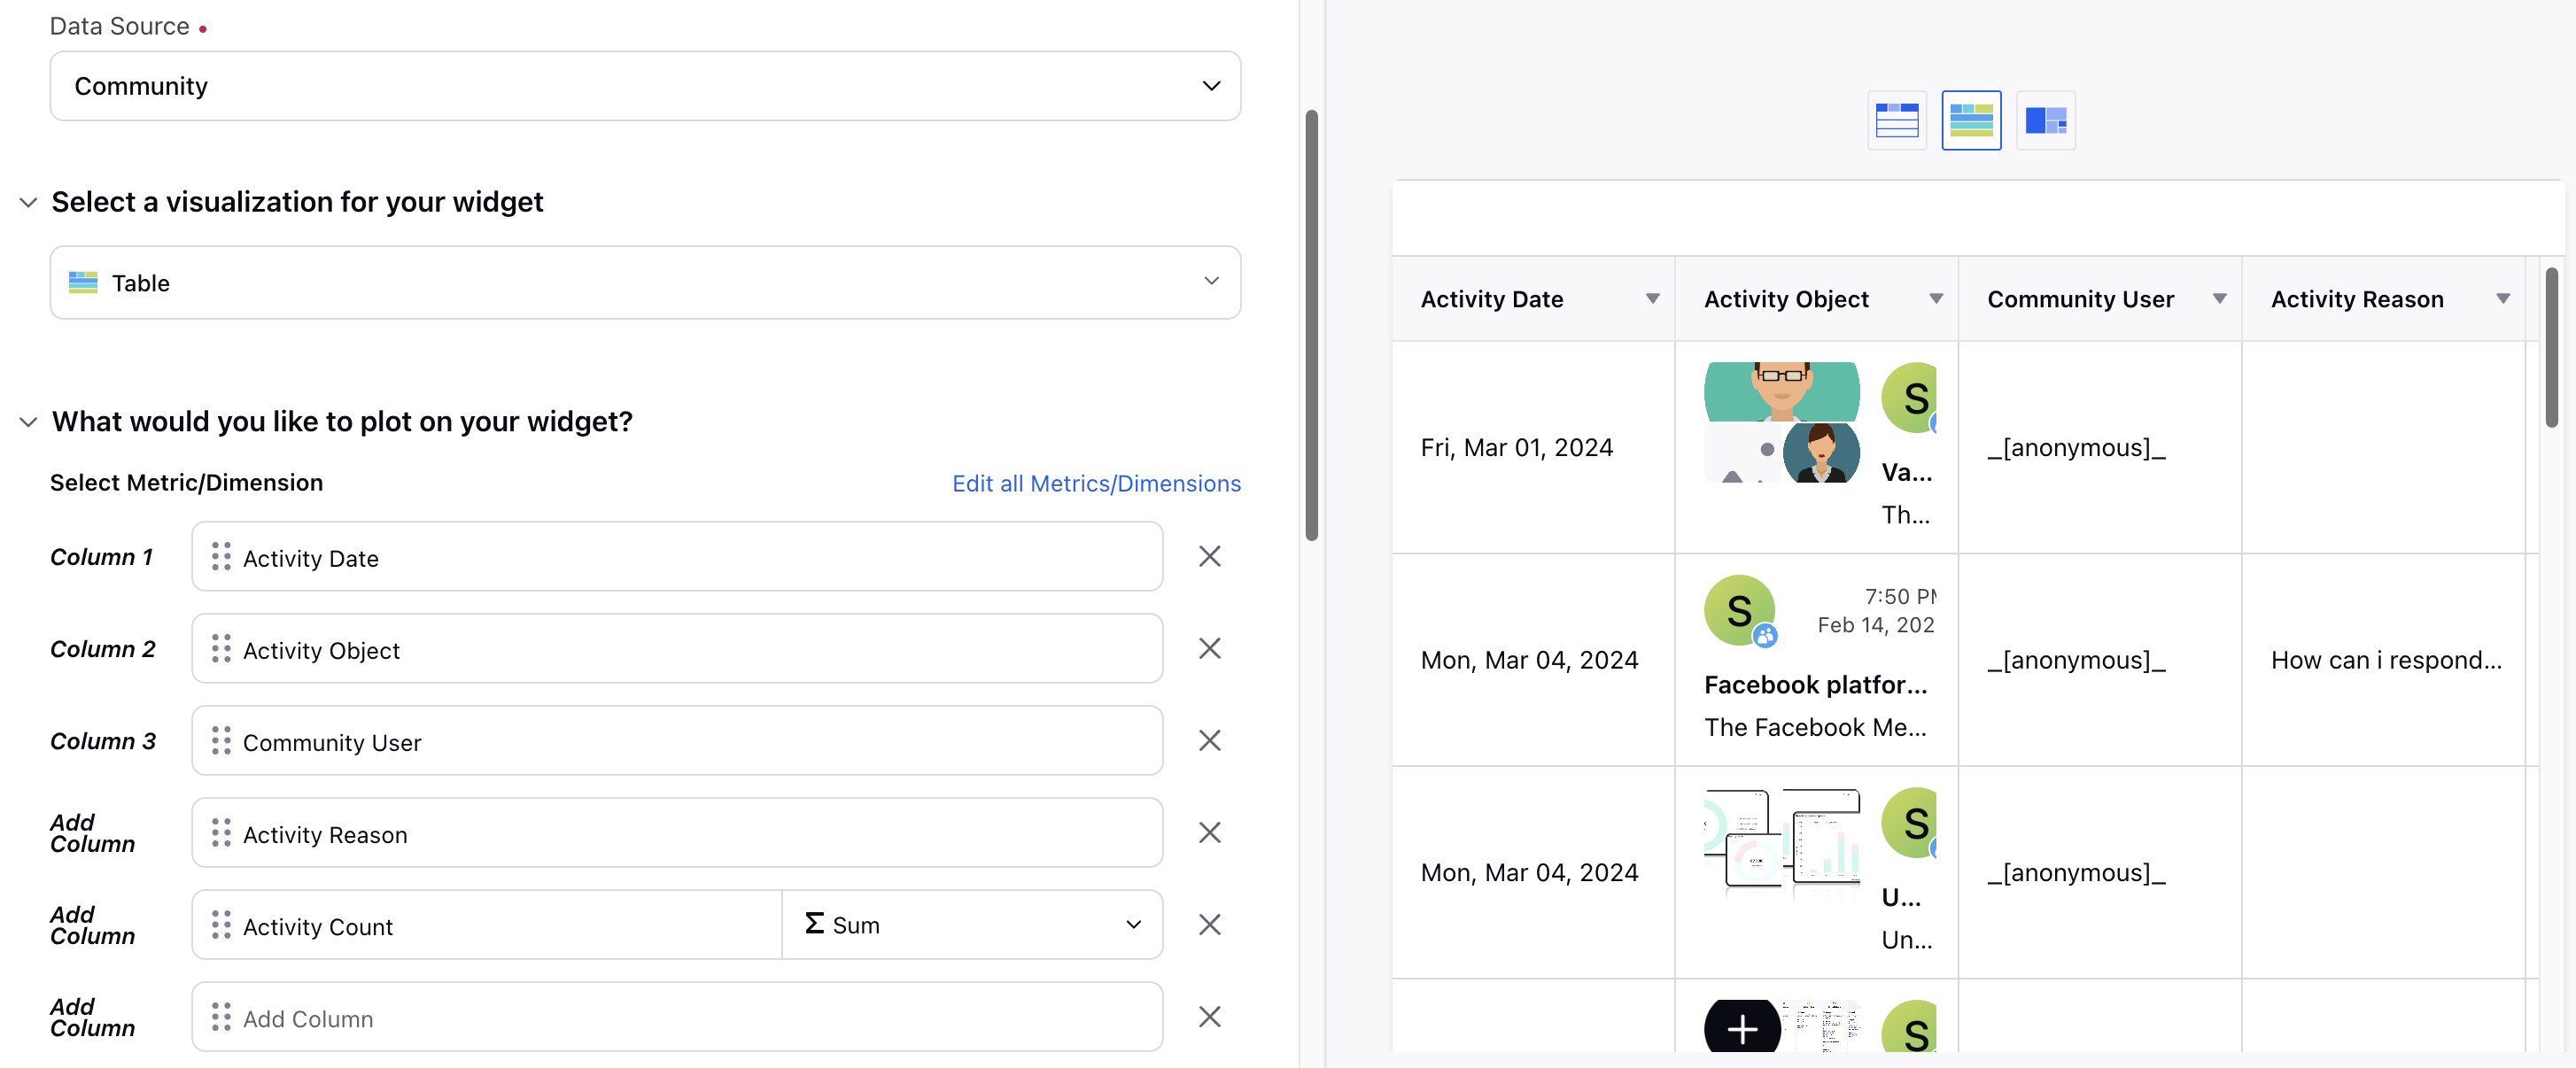
Feedback Received on Articles Marked Not Helpful
Analyzing feedback on articles marked as not helpful provides actionable insights for content improvement. This section reviews user comments to enhance article quality.
Reporting on Translated Articles
You can separately track article-level events, such as helpful count and modified date, for each translated version of the parent article. These details can be tracked using Knowledge Base Reporting. The following article-level details can be tracked for each translated version:
Helpful Count
Article Feedback
Created on
Modified Date
Published Date
External URL
Event Count.