Understanding Trend Metrics
Updated
Reporting involves plotting of dimensions (which are attributes of the data) and metrics (which are measurements of the data). While creating a widget with Data Source as Social Analytics, you can plot either a lifetime metric or a trend metric. These are very different from each other, this article covers the caveats around trends metrics and how they are calculated in Sprinklr.
Trend Metrics: How are they different from Lifetime Metrics?
In Social Analytics, Post level insights have two versions of Metrics Lifetime Metrics (e.g. Total Engagements) and Trend Metrics (e.g. Total Engagements Trend). Lifetime Metrics (such as Total Engagements) report cumulative data of your post from the date the post was published till date. In other words, if a post is published on January 25 2020, Total Engagements will be the sum of all the post engagements(as in Likes, Comments & Shares) from January 25 till date.
In this example, lets try configuring a reporting widget with below configuration and Time Range = 25th Jan 2020 - 1st Feb 2020:
Outbound Post — Dimension
Total Engagements — Metric( Lifetime)
Date — Date will refer to Published Date( which is also a dimension available in addition)
It would enlist all the posts which were published between 25th Jan 2020 to 1st Feb 2020, with Total Engagement Value as on the present day.
Trend Metrics (such as Total Engagements Trend) on the other hand report total engagements(activity in general) based on the date on which engagement occurred.
If you configure a reporting widget with below configuration, and Time Range = 25th Jan 2020 - 1st Feb 2020:
Outbound Post — Dimension
Total Engagements Trend — Metric( Trend)
Date — Date refers not to the Published Date, however date of engagement.
It would enlist all the posts which got engagement during 25th Jan 2020 - 1st Feb 2020, irrespective of when the post was published.
If you use the Date dimension, it is possible that a single date appears multiple times in a widget as seen below, that is because the same post got engagement on a different date.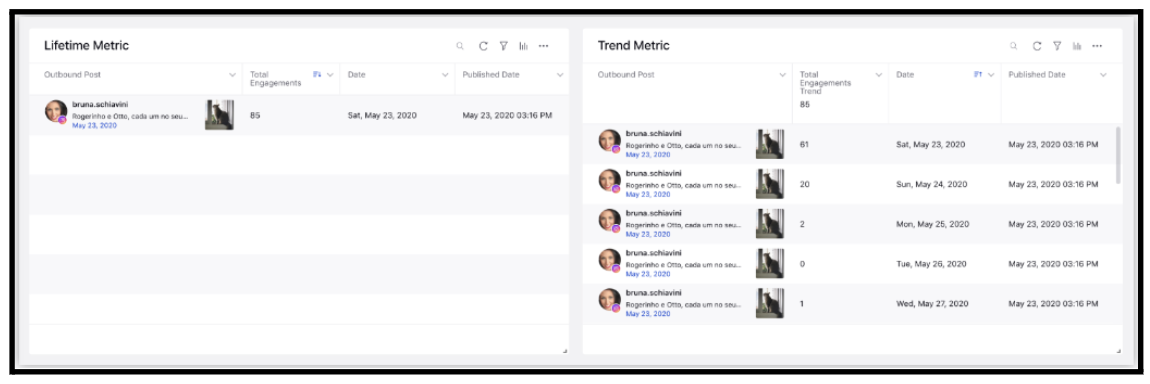
Note:
|
Best Practises: Use separate widgets for lifetime and Trend Metrics.