Dashboard & Widget Exports
Updated
Effortlessly Export Data from Reporting Dashboards and Widgets for Rapid Insights
With Sprinklr's Exports feature, exporting data from Care Reporting Dashboards to gain rapid insights has never been easier. You have the flexibility to tailor your export to your preferences by choosing the file format and layout that suits you best. Sprinklr's Exports supports a range of file formats including PDF, Excel, PNG, and CSV. In this article will alk you through the ways you can manually export data from the reporting dashboards.
Note
|
To Export Reporting Dashboards
1.Click the New Tab icon. Under the Sprinklr Service tab, click Reporting within Analyze.
2.Select the desired dashboard from the Dashboards Home window.
3.Click the Options icon in the top right corner of the Reporting Dashboard, and select Export.
4.On the Export Dashboard pop-up Select the Dashboard Sections to Export from the given options.
5.Under File Format, select the file format you want to export. Note that the PDF is preselected. You can select from the following options:
PDF - For this file format, you can select the PDF Layout (Portrait or Landscape) and Number of PDFs (One PDF per tab or Single PDF for all tabs).
EXCEL - For this file format, you can select the Excel Structure (Every widget in separate sheet or All widgets in a single sheet).
PNG
PPT
6.Click Export in the bottom-right corner.
Note
|
To Export Individual Widgets:
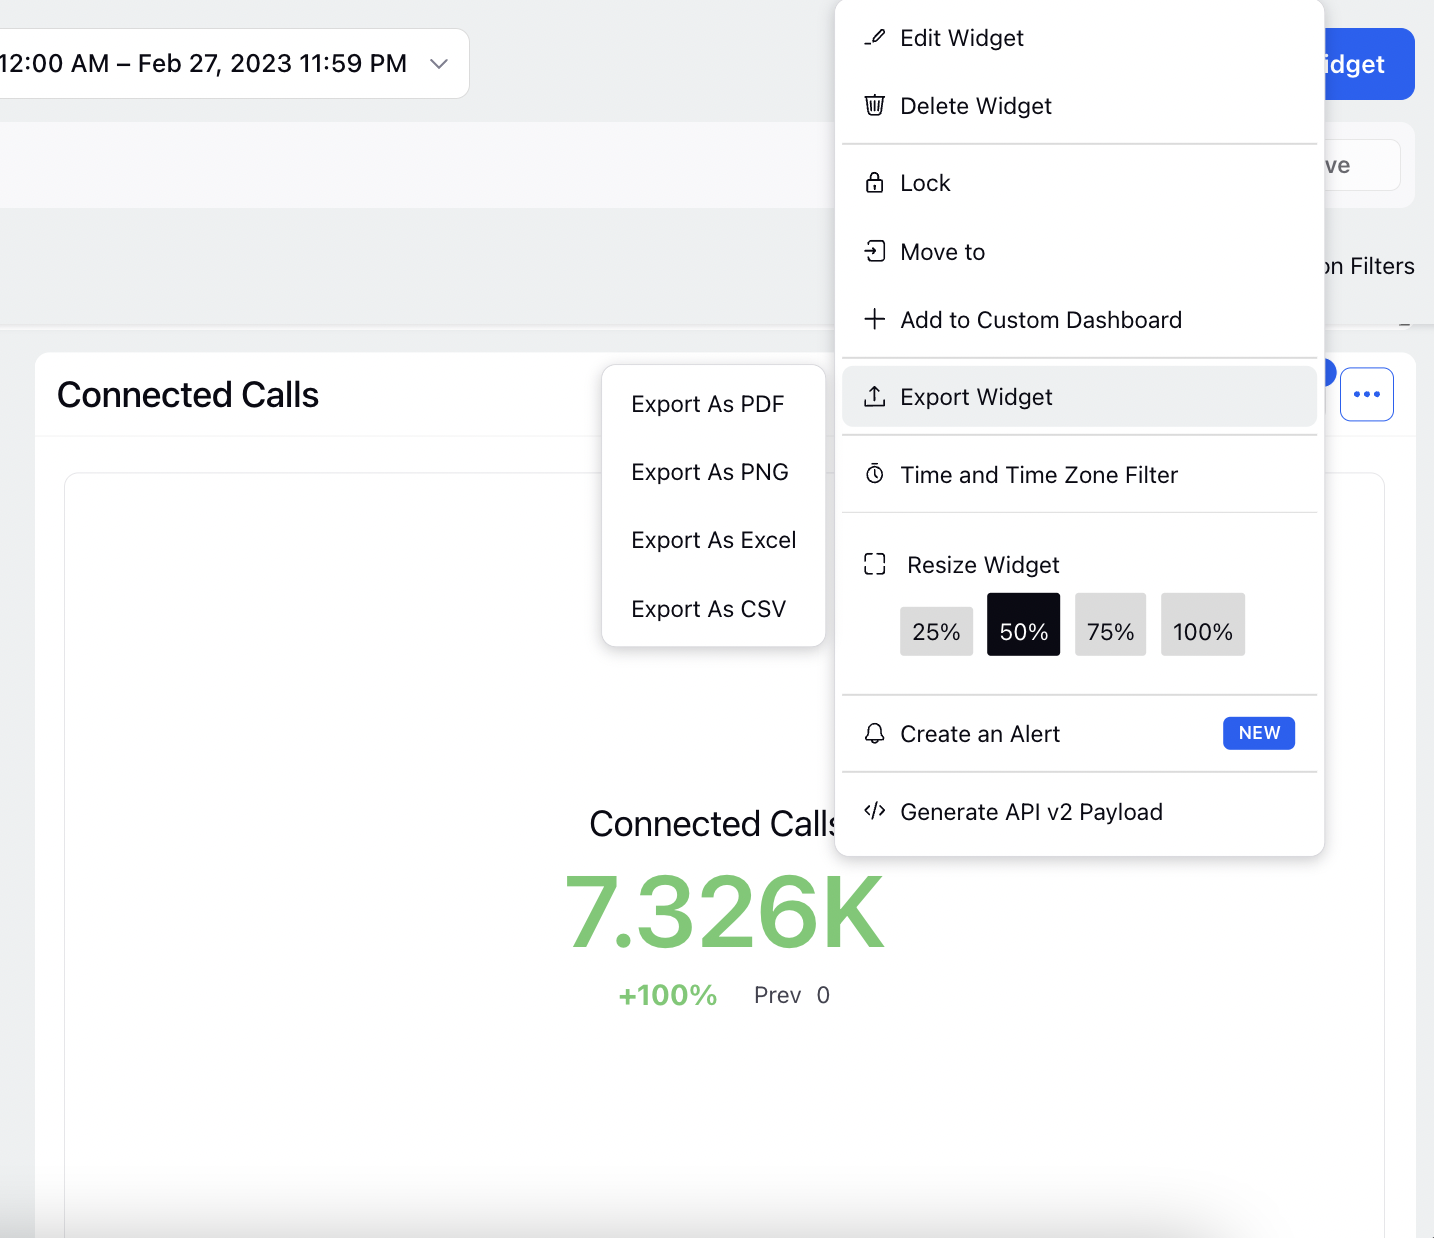
Click the Options icon in the top right corner of the desired Widget, and select Export.

To Perform Advanced Export
On the Export pop-up window, click View Advanced & Scheduled Export Settings.
On the Export Dashboard window, you can customize your export by selecting the file format, layout and scheduling details.
Click Export in the bottom right corner.
Note: While trying to export reporting data in XLS, Sprinklr shows you notification, in case the data to be exported is more than the export limit defined for you. |
Advanced Export Dashboard — Field Descriptions
Dashboard | Name of the dashboard you are exporting. |
Date Range | Select the date range of the data you want to export. Note that different date range options like Yesterday, This Week, Last Week, Last 7 Days, Dynamic Range, etc. will roll as time goes by. Whereas, a Custom Range selection will be static and will not change as time goes by. For Dynamic Range, enter the value in for Duration (hours or days or week or months) and the end time for the duration from the given dropdowns. |
Filters | Apply dashboard filters - Select to export dashboard with already applied filters. Apply new set of filters - Select to apply the desired filters to the dashboard you are exporting. |
Select the Dashboard Sections to Export | Select the Dashboard Section(s) you wish to export. |
Add Image | Add an image for the cover page of your exported file. You can preview the changes on the right. Export Cover: Toggle to enable/disable the export of your dashboard cover. |
Export Type | Select export as Excel, PDF or PNG format.
|
Export Name | Choose title on the cover of Exported File and of the Scheduled report. |
Format Your Export | Select the format of your export file as desired. |
Widget View in Export | It applies to widgets with Range Slider on either Y or X-axis for a PDF or PNG or PPT export type. You can select the following options:
|
Storage options | Select a storage option for your export file:
|
|
