Activity Dashboards
Updated
On the Community Reporting Dashboard, you can customize, expand, and filter into metrics to develop data-based strategies to continuously improve your content performance on the community.
Use Cases
To View Reporting on Community Activity
You can classify the activities of the community members by Activity Date, Activity Count, Activity Object Type, and Activity Object to analyze the number of activities performed.
Under the Define Advanced Options section, you can add the filter for the desired Activity such as Comment, Block, Reply, Share, Like, Login, etc. You can also filter the data by Activity Object Type, Community Topics, Categories, and Top Categories.
To Track the Number of Views on Any Community Activity
Create a custom metric where select Data Source as Community and Metric Type as Numeric.
Select Metric as Activity Count.
Within Filters, select Activity containing Read. For more information, see Create a Custom Metric.
Now, within the What would you like to plot on your widget section, plot Custom Metric that you have created along with the Activity Object and Activity dimensions. Under Define Advanced Options, filter it as ActivitycontainingRead.
To View Trending Topics with the Number of Users Who Replied on the Respective Topics
Within the What would you like to plot on your widget section, plot Community Topic dimension along with the Total User Replies metric.
To View Total Number of Posts Marked as Accepted Solution by Brand, Likes Count, Posts Count, etc.
To View Case Summary Across Social Channels
You can plot cases across all channels and compare the Reply Rate, Average Messages per Cases, and Duration, etc. Select Social Analytics as the Data Source. Plot Social Network dimension along with Case Count, Reply Rate, Brand Message per Case, Fan Message per Case, and Case Duration metrics to have a collective view of cases across all the social channels.
You can also view the Final Case Sentiment for all the social channels along with Community.
To View Reporting on IP Addresses
You can also view reporting on the IP addresses of users. You can create widgets to view the activities performed by the users through their IP Addresses.
To View Reporting on Not Helpful Feedback
You can create a widget to view the reasons provided for not helpful posts on the community.

To View Reporting on Tags Used in Posts
You can create a widget to view the tags added/removed in community posts, the count of tags, and the users who added/removed the tags.

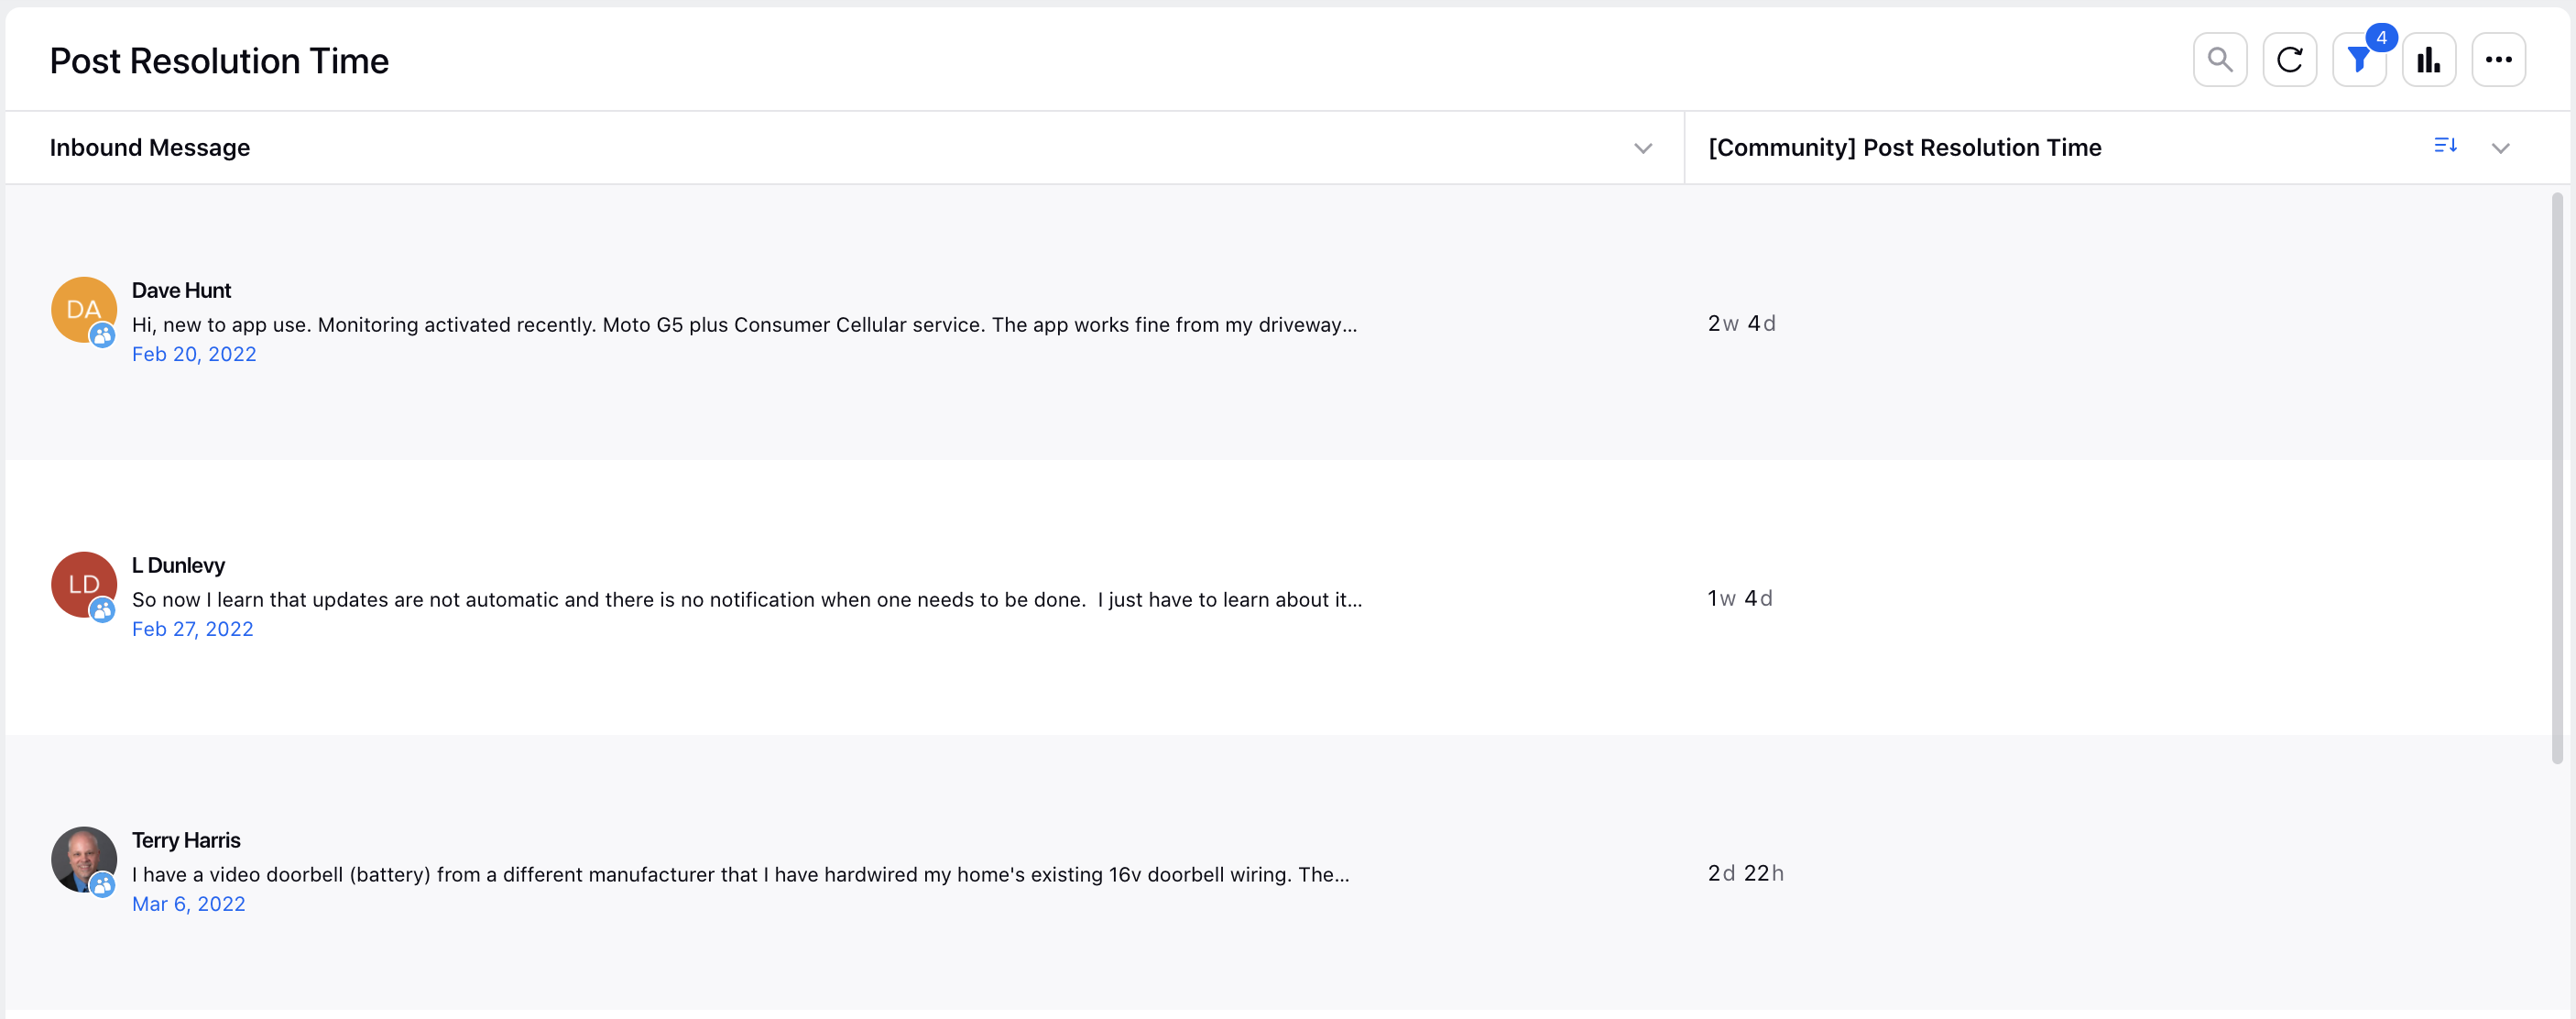
To View Post Resolution Time/Percentage
You can also view the resolution percentage and resolution time for community posts. Post resolution time is the duration between the post creation time and the time when the post was either closed or a comment was marked accepted or official. To enable this capability, raise a support ticket at tickets@sprinklr.com.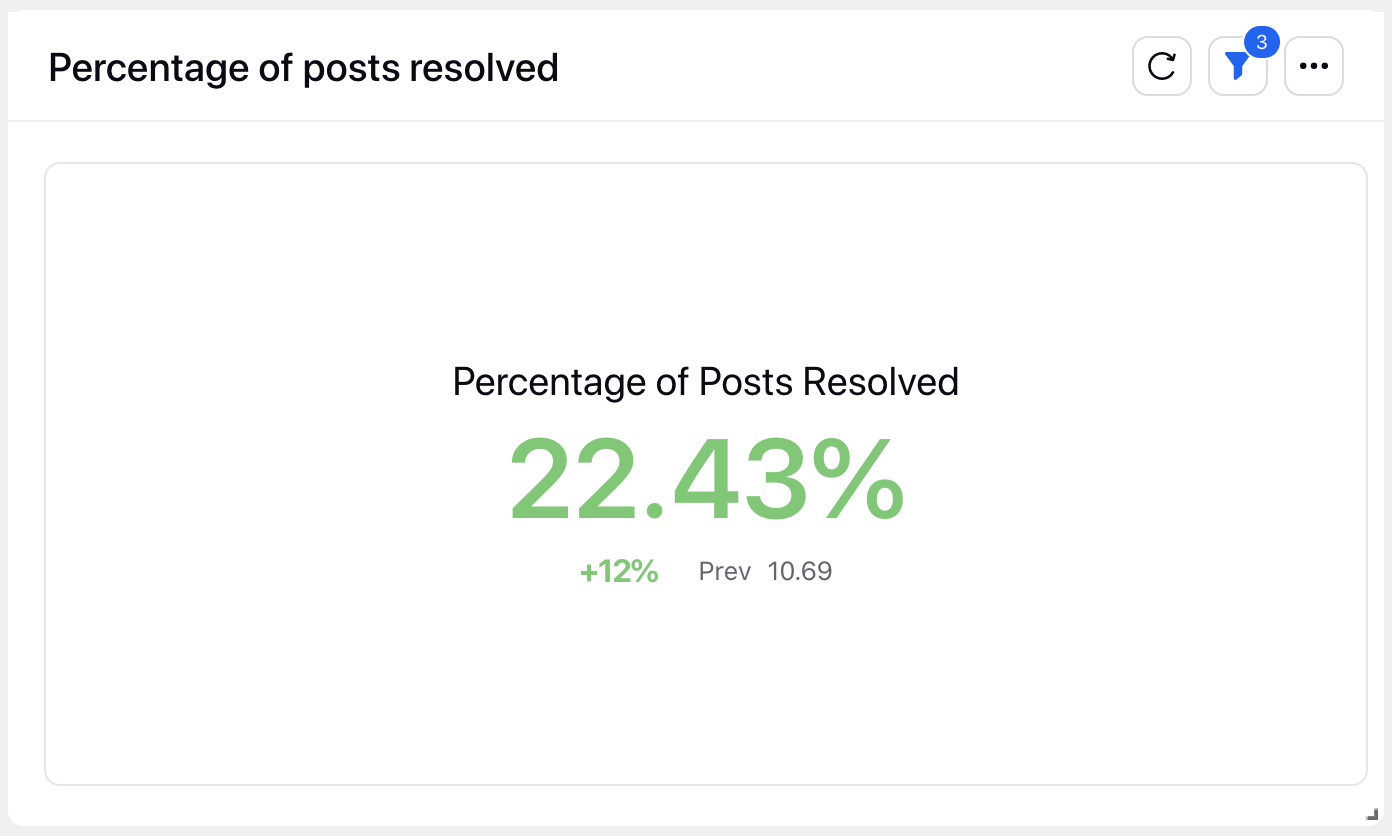
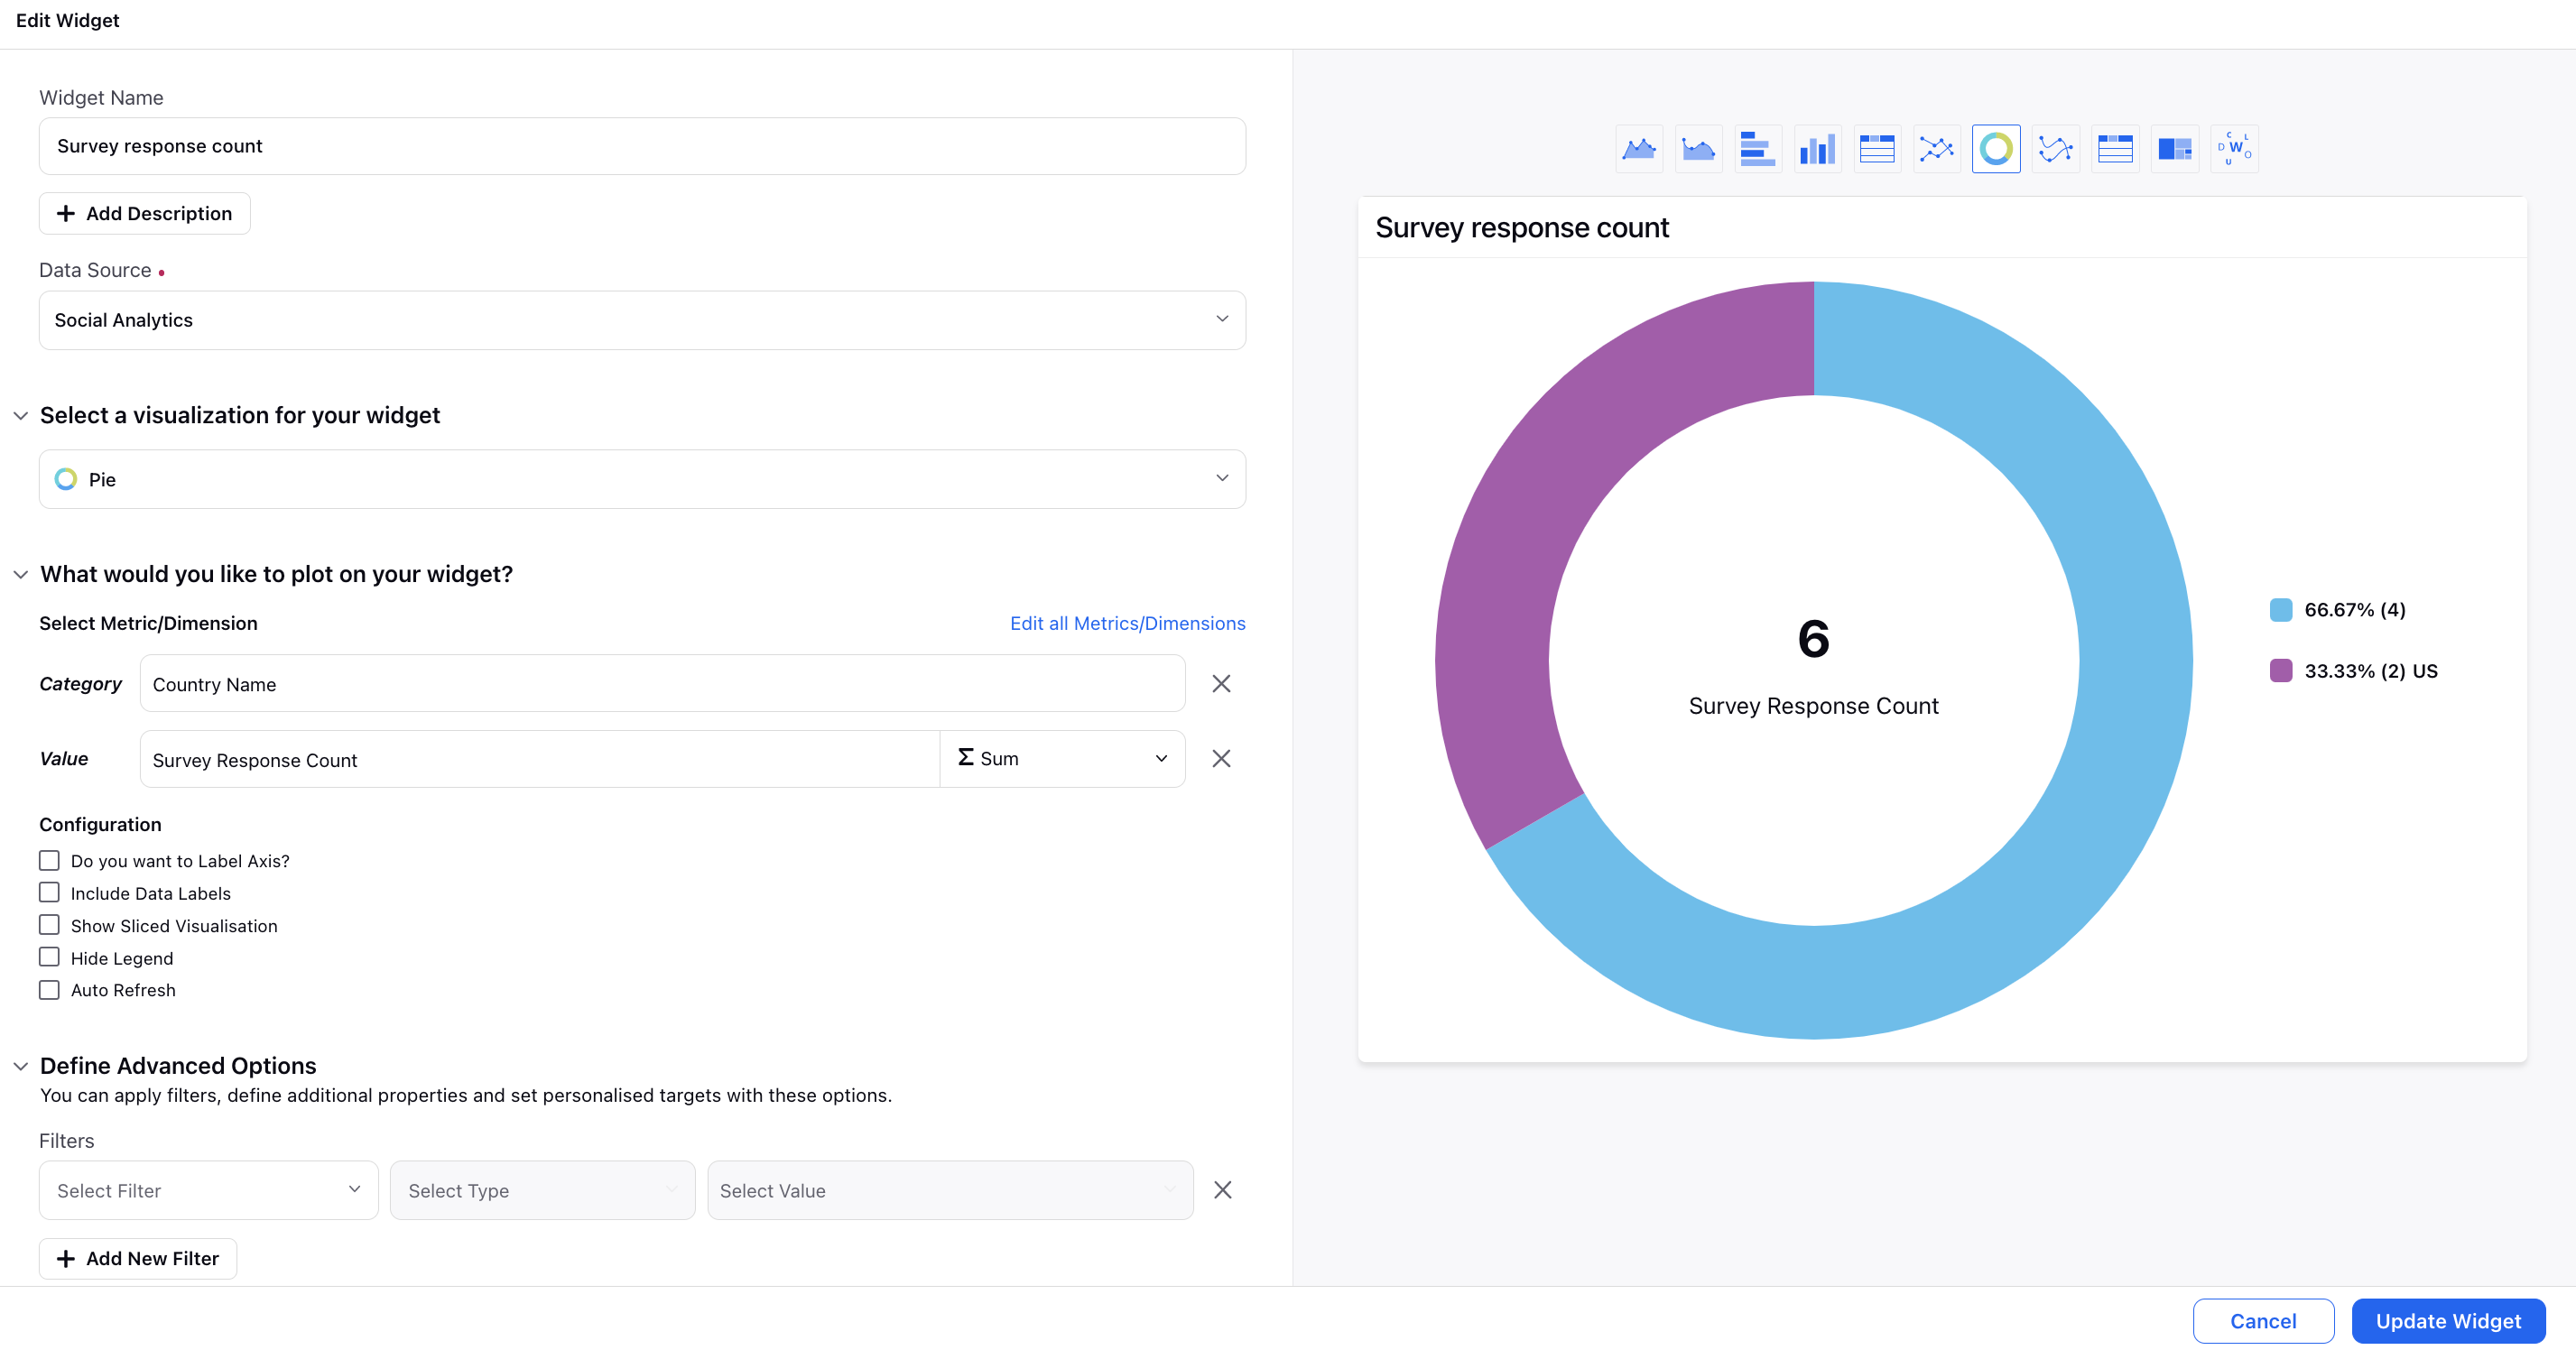
To View Country-Wise Survey Response Count
Plot the Country Name dimension with Survey Response Count metric. This will allow you to analyze the distribution of survey responses across different countries and identify any patterns or trends.
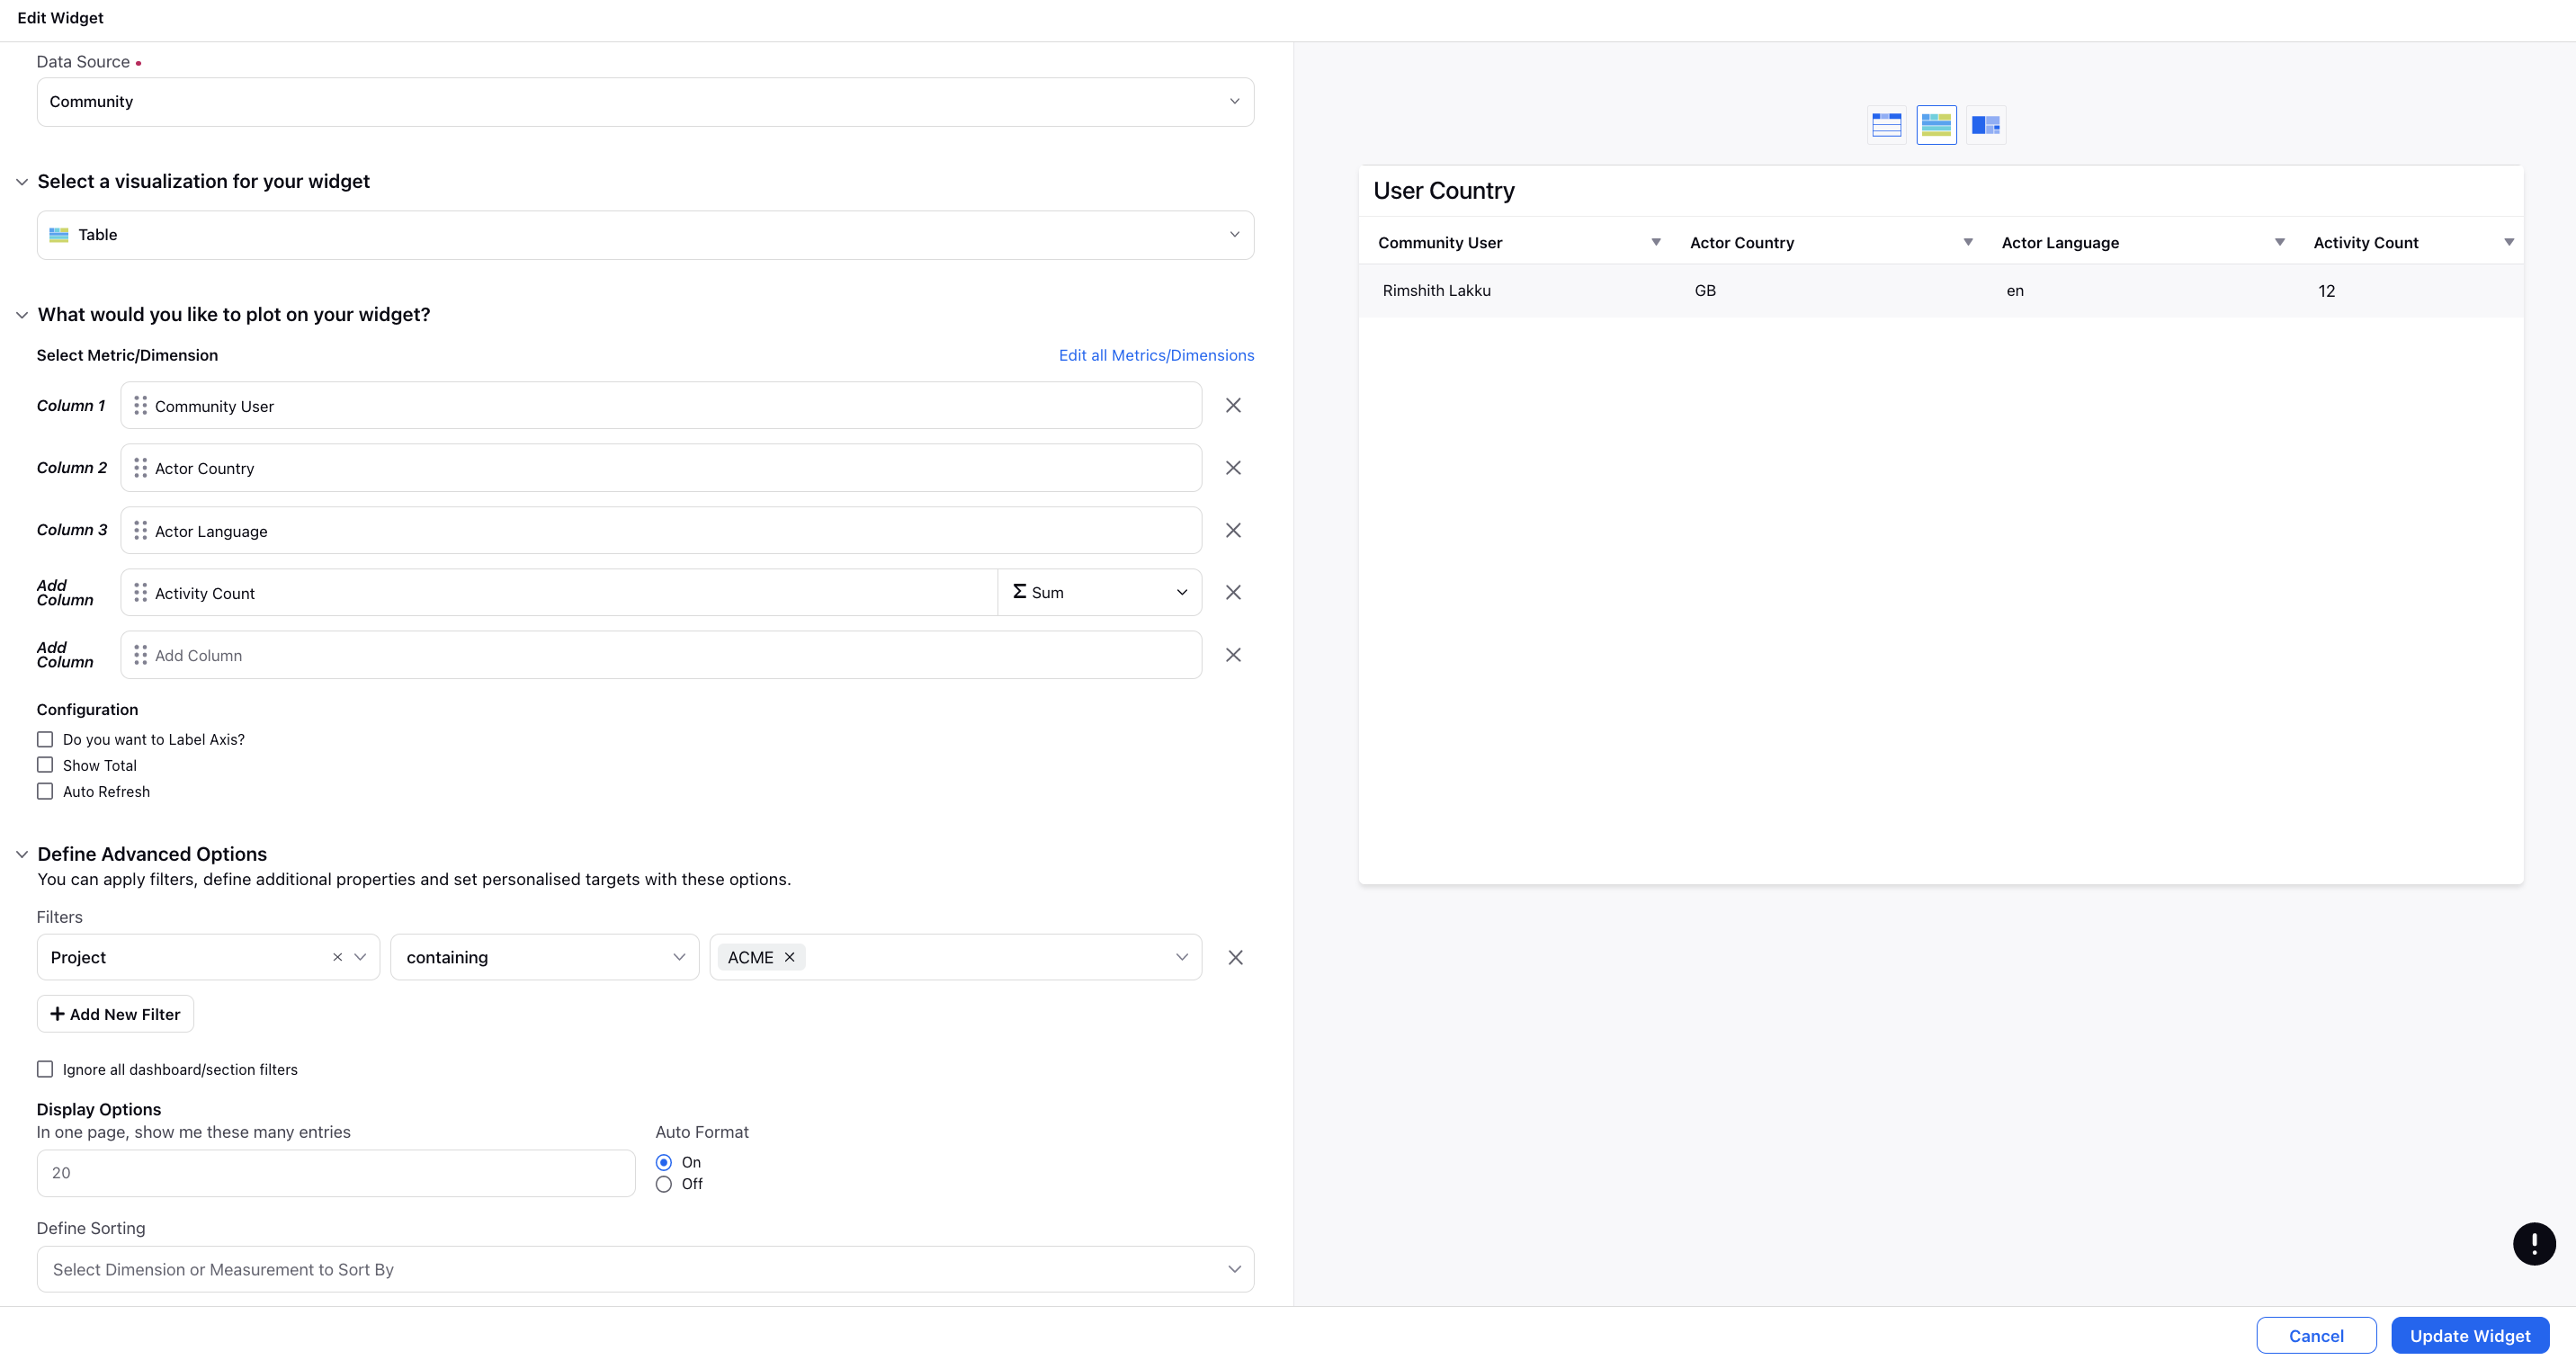
To View User Country and Language
To view the country and language of users logging into the community, you can plot the dimensions Actor Country and Actor Language. This will provide insights into the geographic distribution and language preferences of community users.
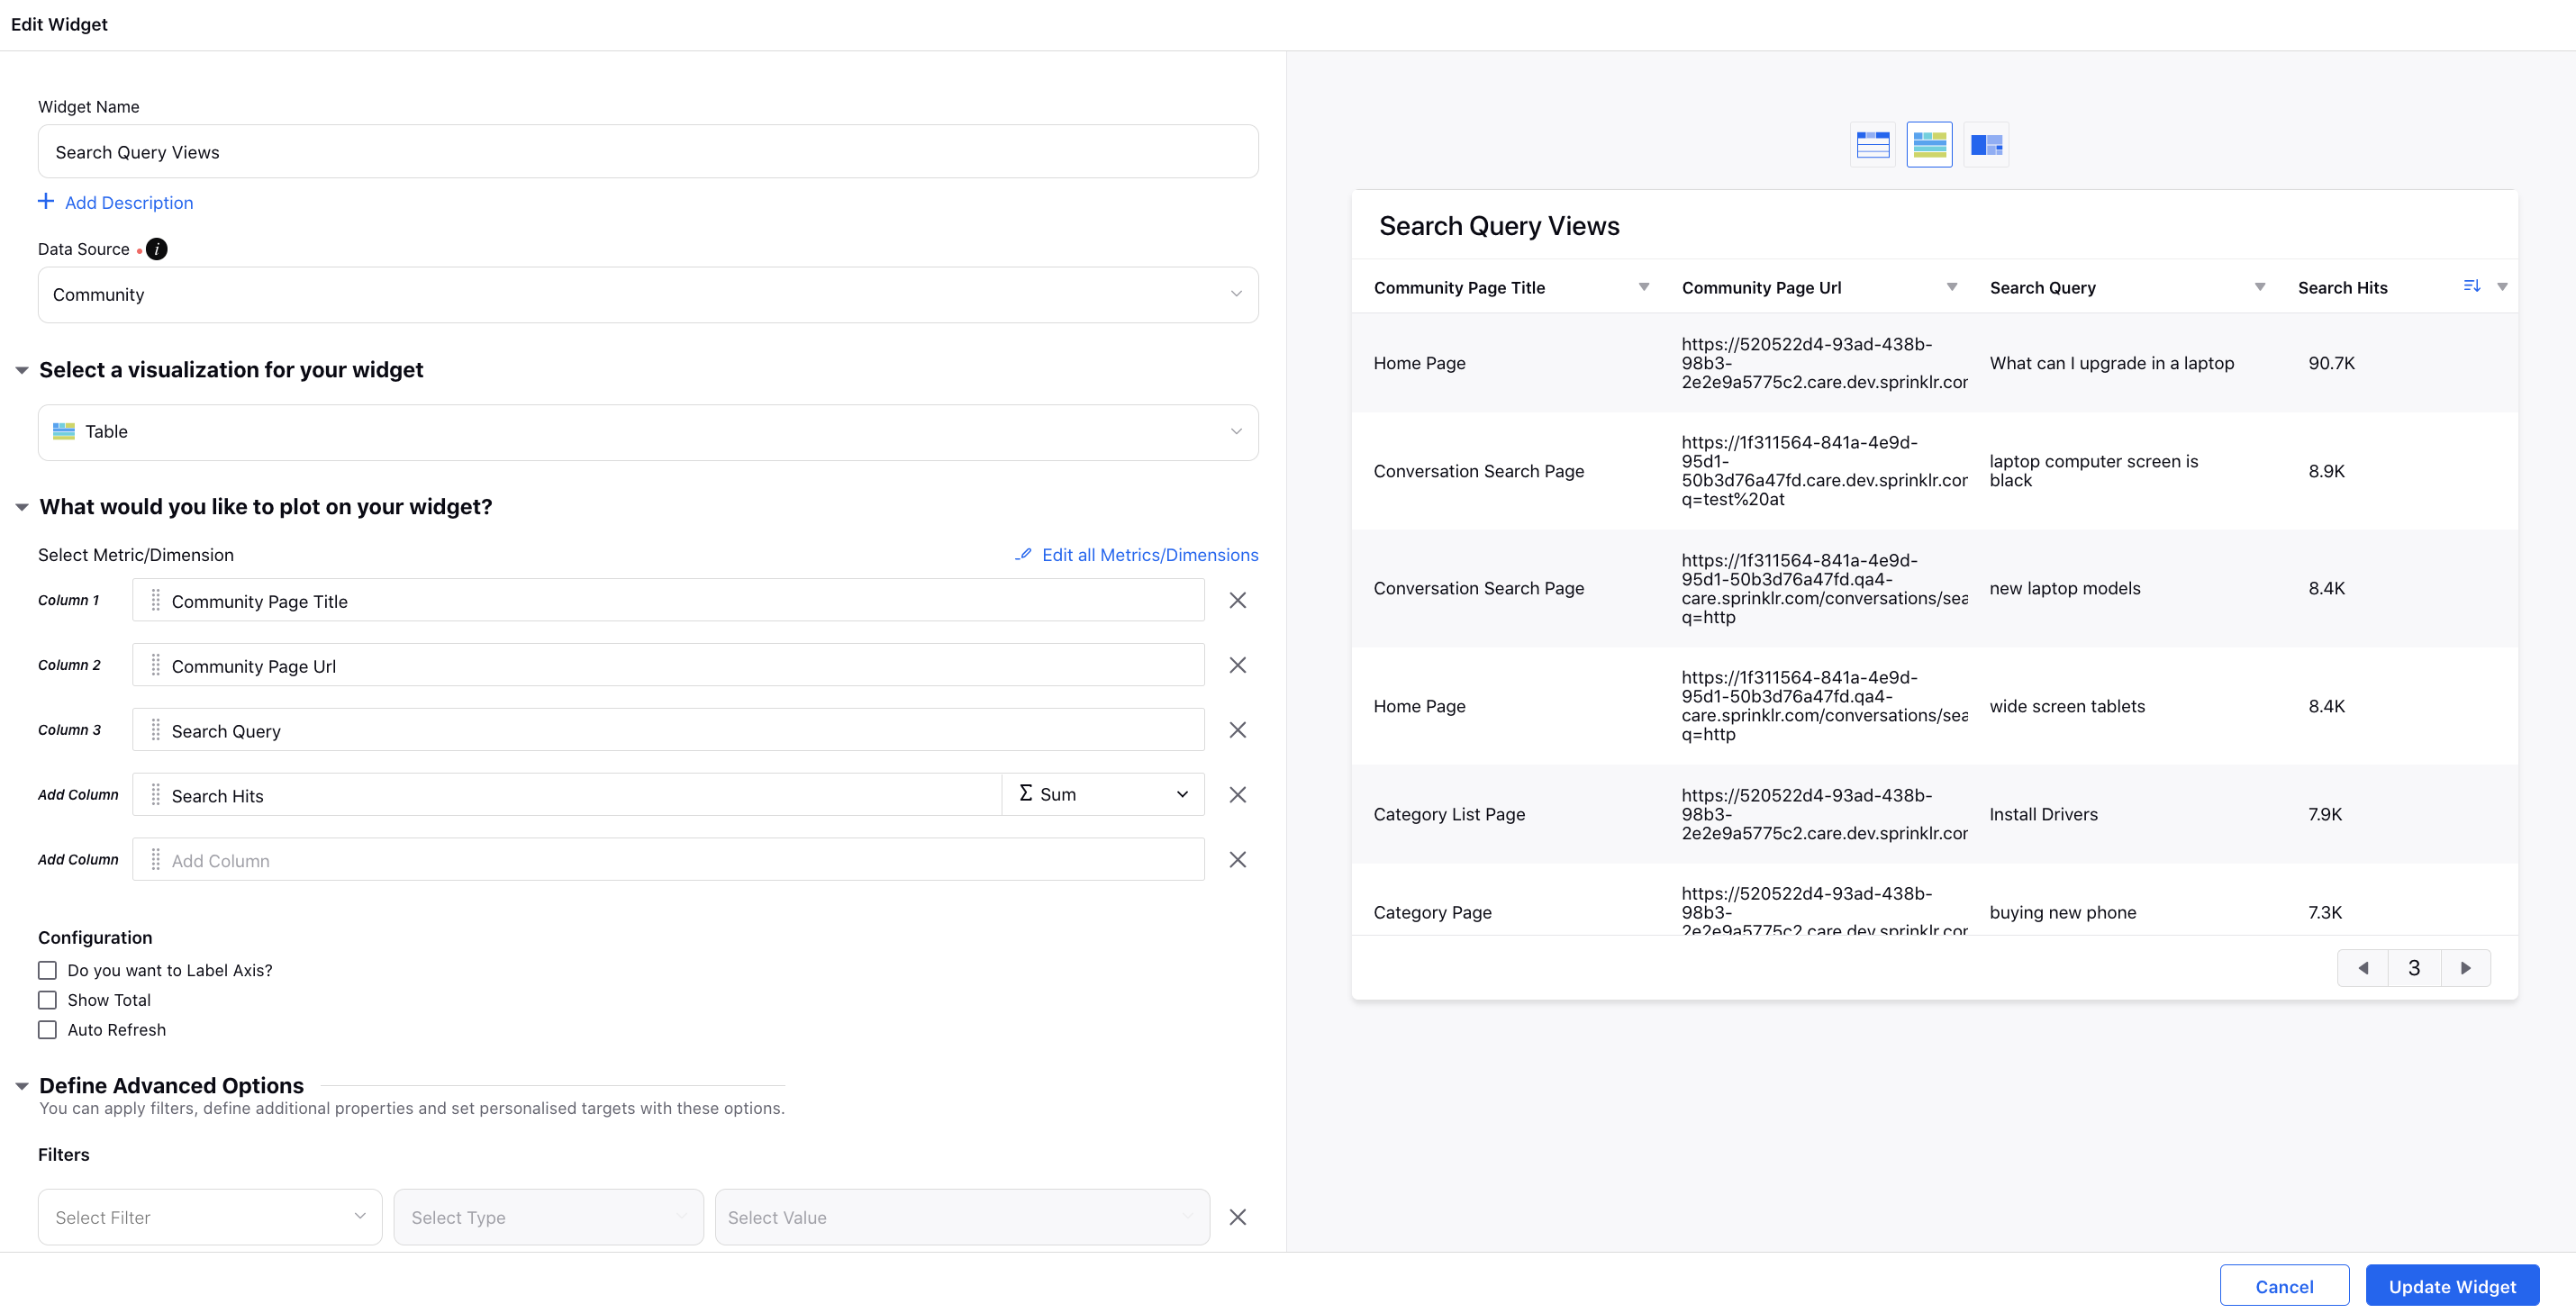
To View Community Pages Where Specific Queries were Searched
Plot Community Page Url and Community Page Title dimensions along with Search Query dimension and Search Hits metric to track the community pages from where the users are searching for the queries. This can help you identify the gaps in the content on specific pages.
