Knowledge Base Reporting
Updated
Reporting on Knowledge Base
How brands can leverage Sprinklr reporting to analyze their knowledge base articles' performance basis the user activities.
You can create comprehensive custom reports with the help of various Knowledge Base metrics and dimensions to gain actionable insights into content performance based on user activity (views, traffic, feedback, etc.). You can also measure agent productivity by tracking case SLA when articles were used during a conversation.
Snapshot Reporting for Custom Fields in Articles
Snapshot reporting of Custom Fields is essential in reporting because it provides valuable insights into trends and patterns over time. Historical data tracking supports compliance and auditing requirements by ensuring a transparent and traceable record of changes.
Note: Snapshot reporting for Custom Fields in articles is Dynamic Property (DP) controlled. Please contact your Success Manager to enable this feature in your environment, contact your Success Manager. Alternatively, you can submit a request at tickets@sprinklr.com.
Open Article from the Third Pane in the Reporting Dashboard
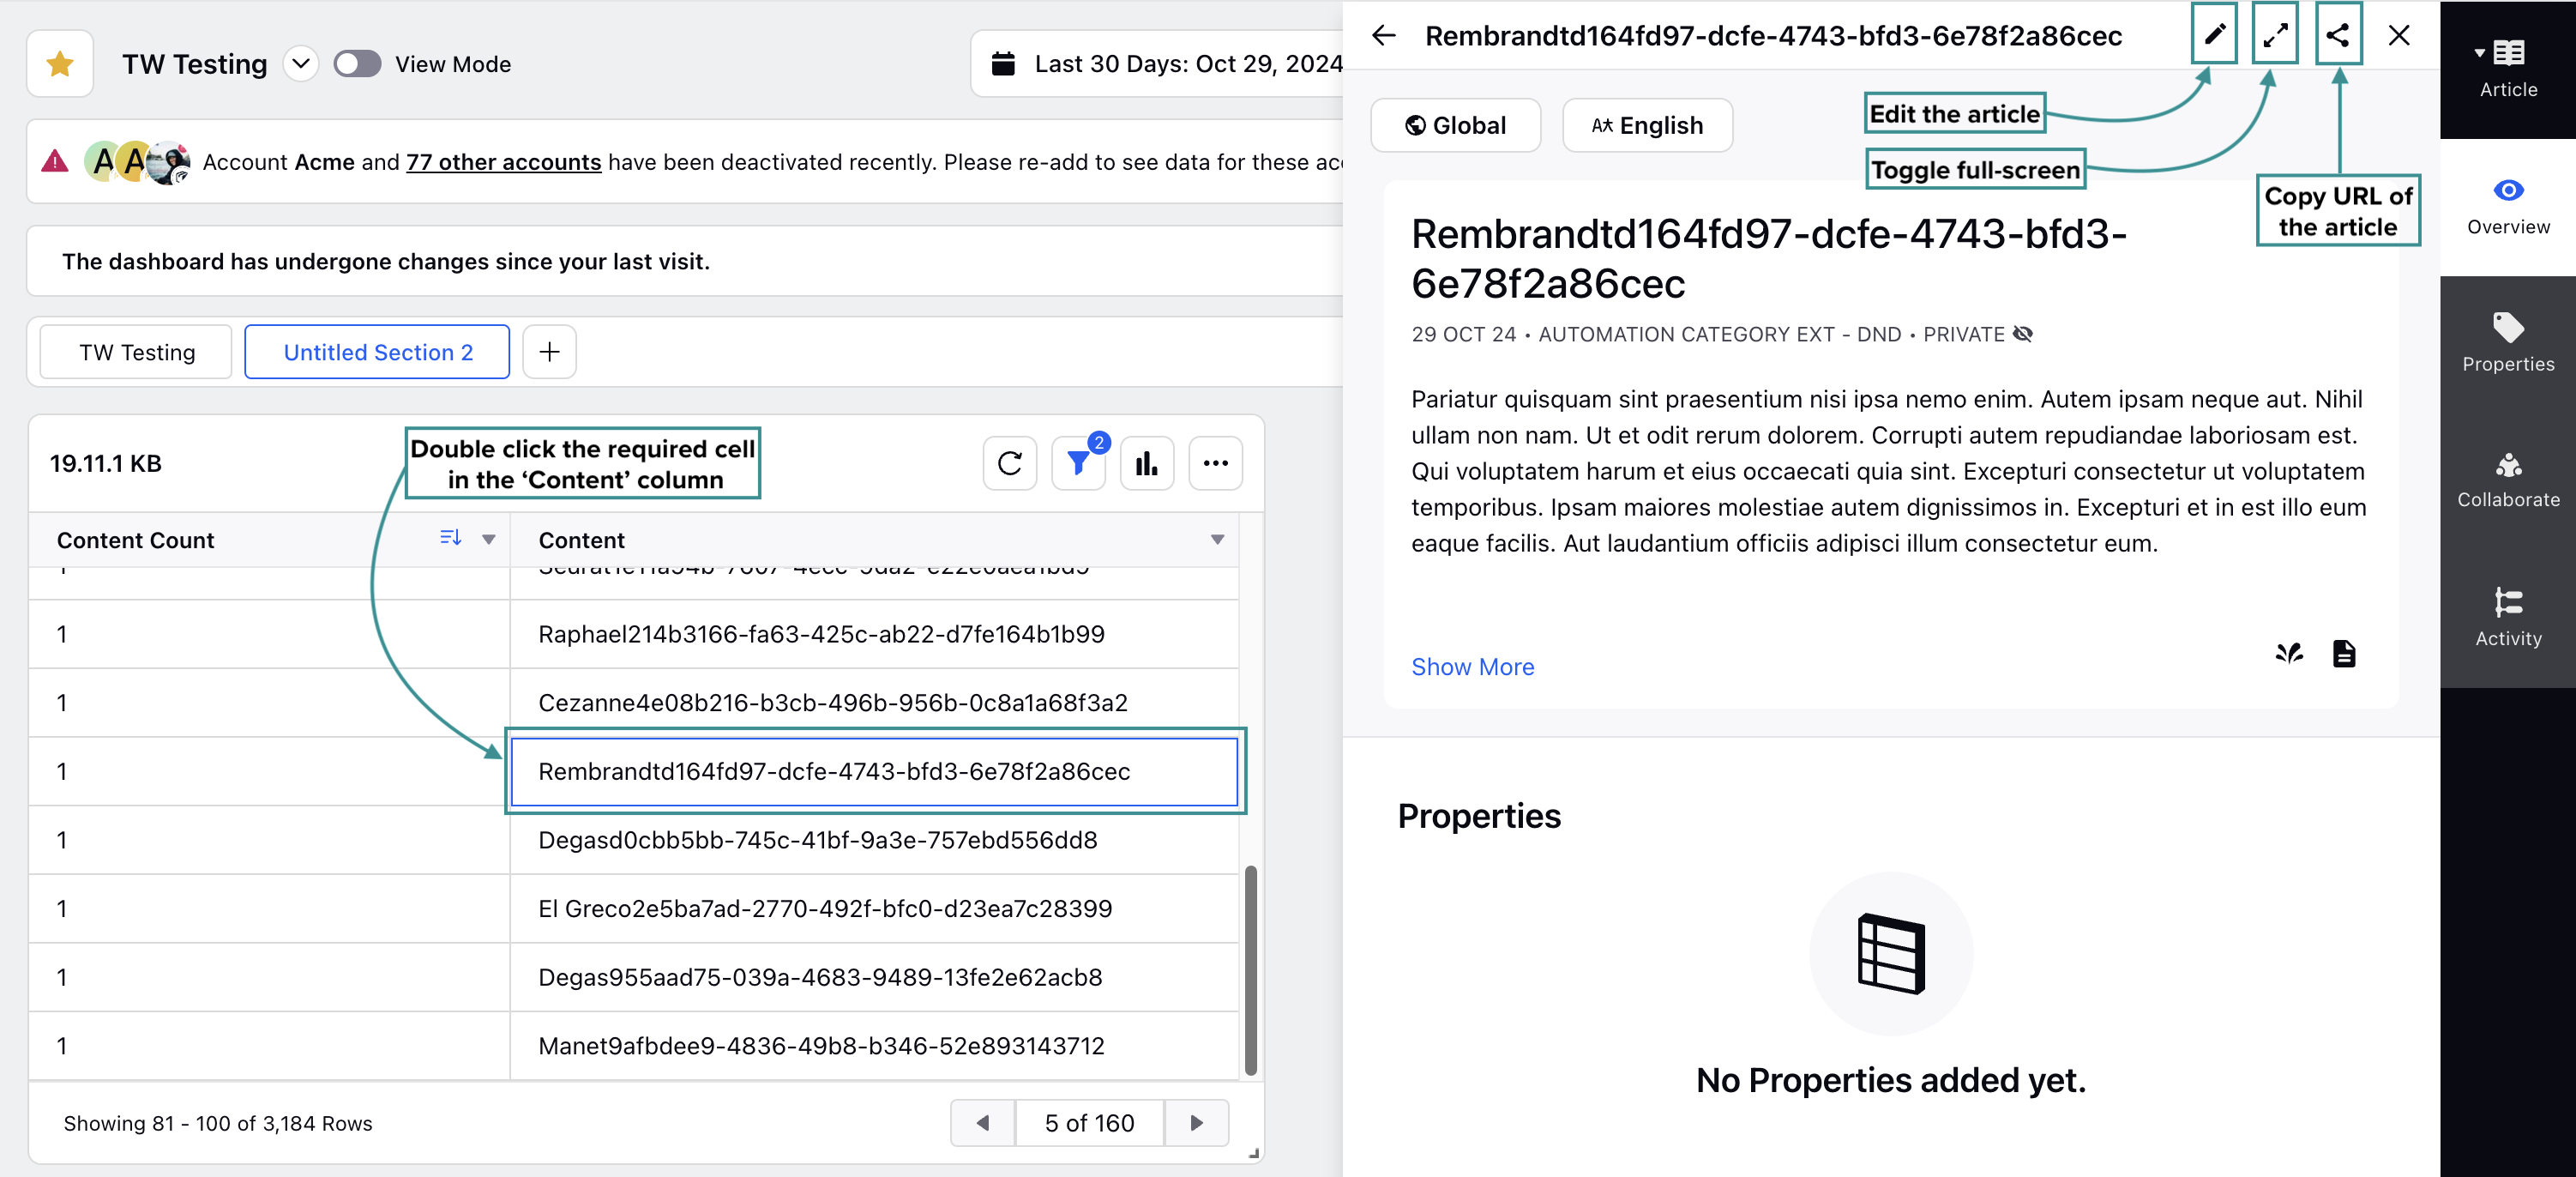
When a Reporting Widget is created with the ‘Content’ Dimension selected and the ‘Table’ visualization, double-clicking a cell in the ‘Content’ column will open the article from the Third Pane. From the Third Pane, you can click the Edit Article button to open the article editor and make changes to the article.
Note: You must have Edit permission under the Knowledge Base module to edit an article.
You can copy the URL of the article, view the attributes of the article from the Properties tab, add a note on the article from the Collaborate tab, and view the activity log of the article from the Activity tab.
Website Analytics
User Visits in Last 24 hours
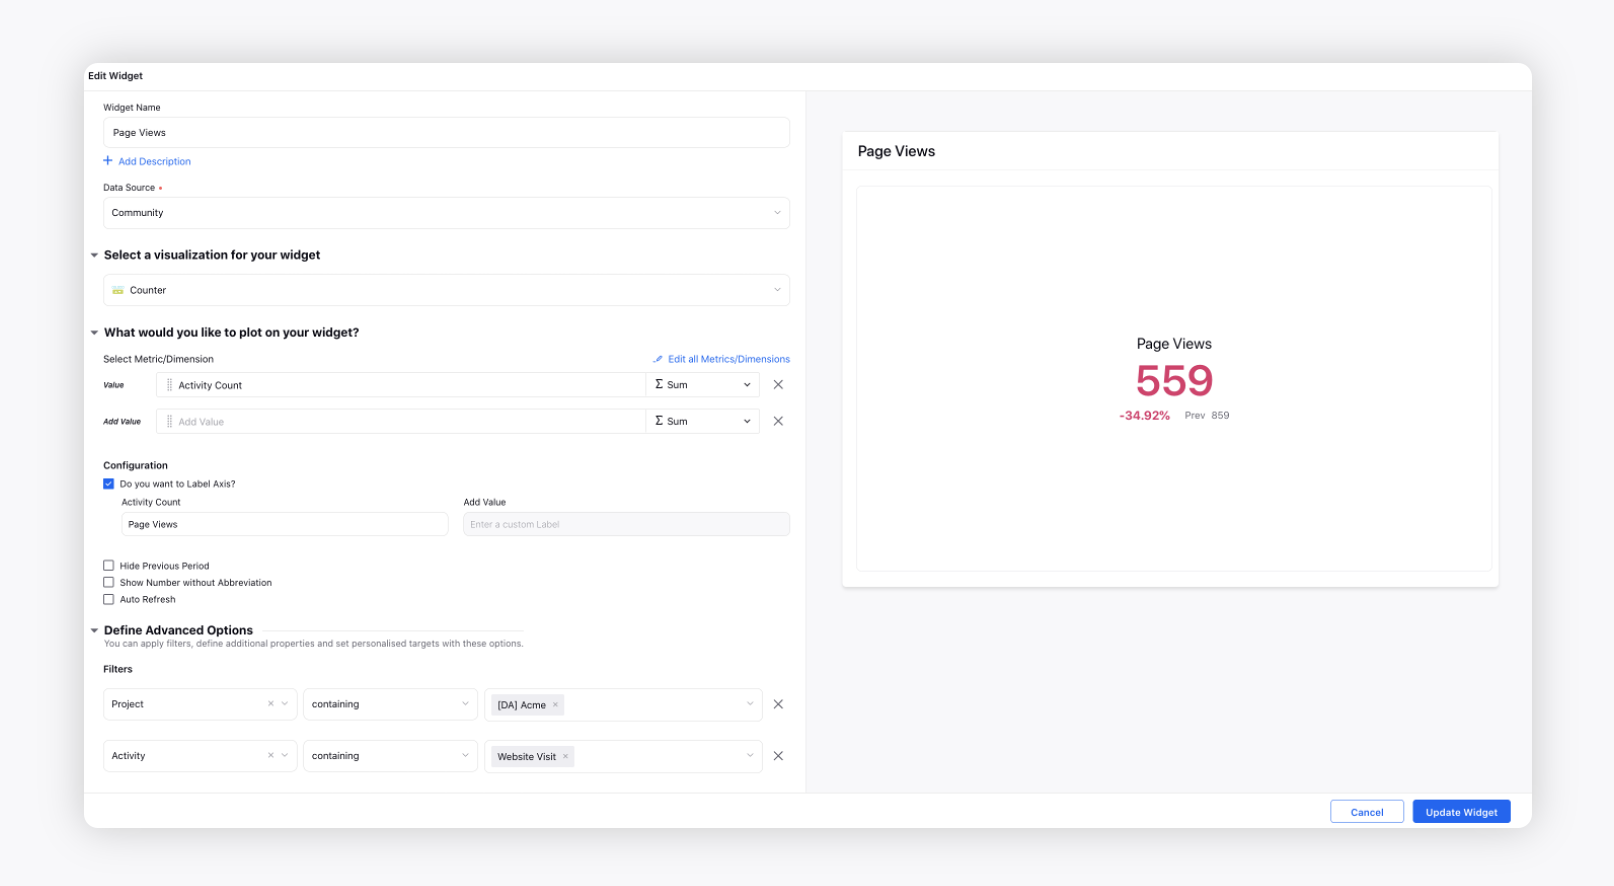
Page Views
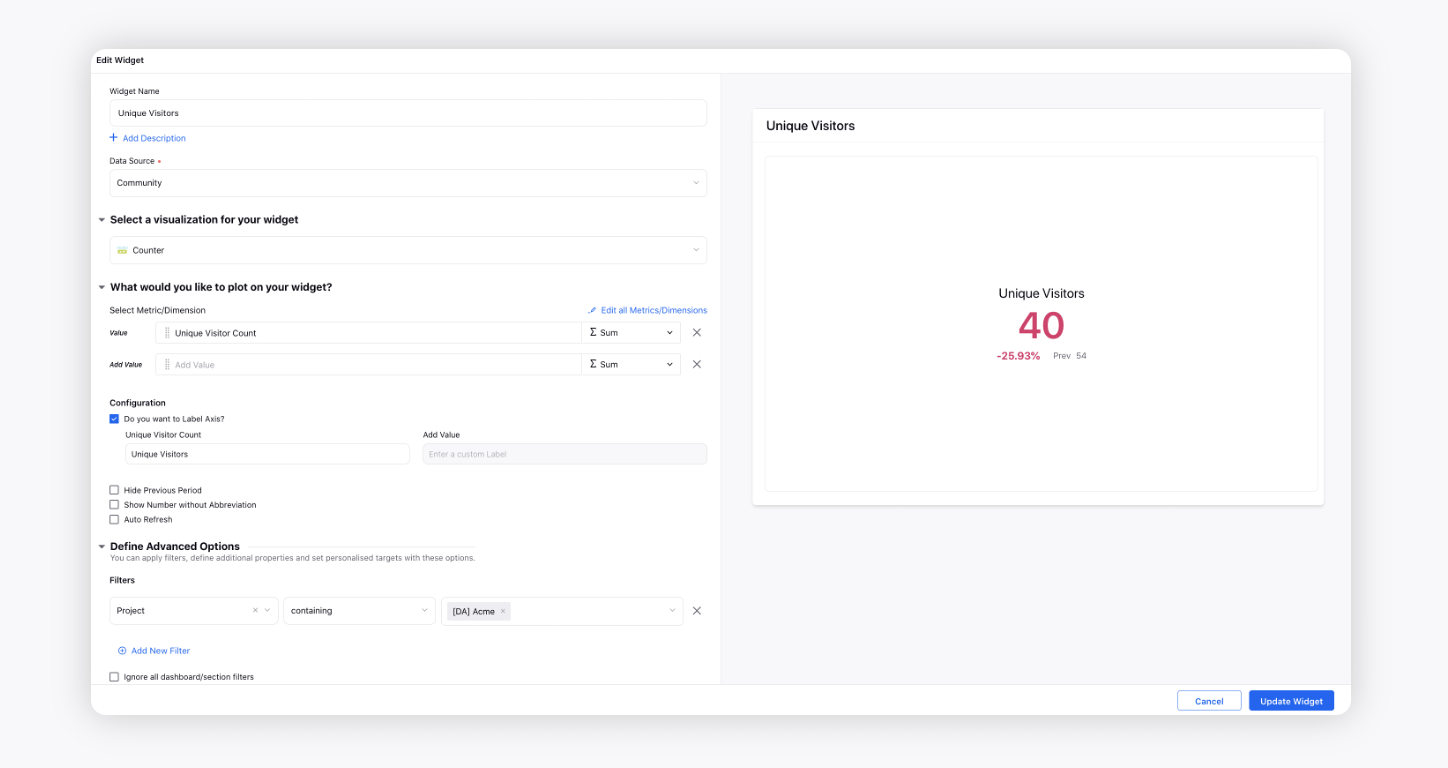
Unique Visitors
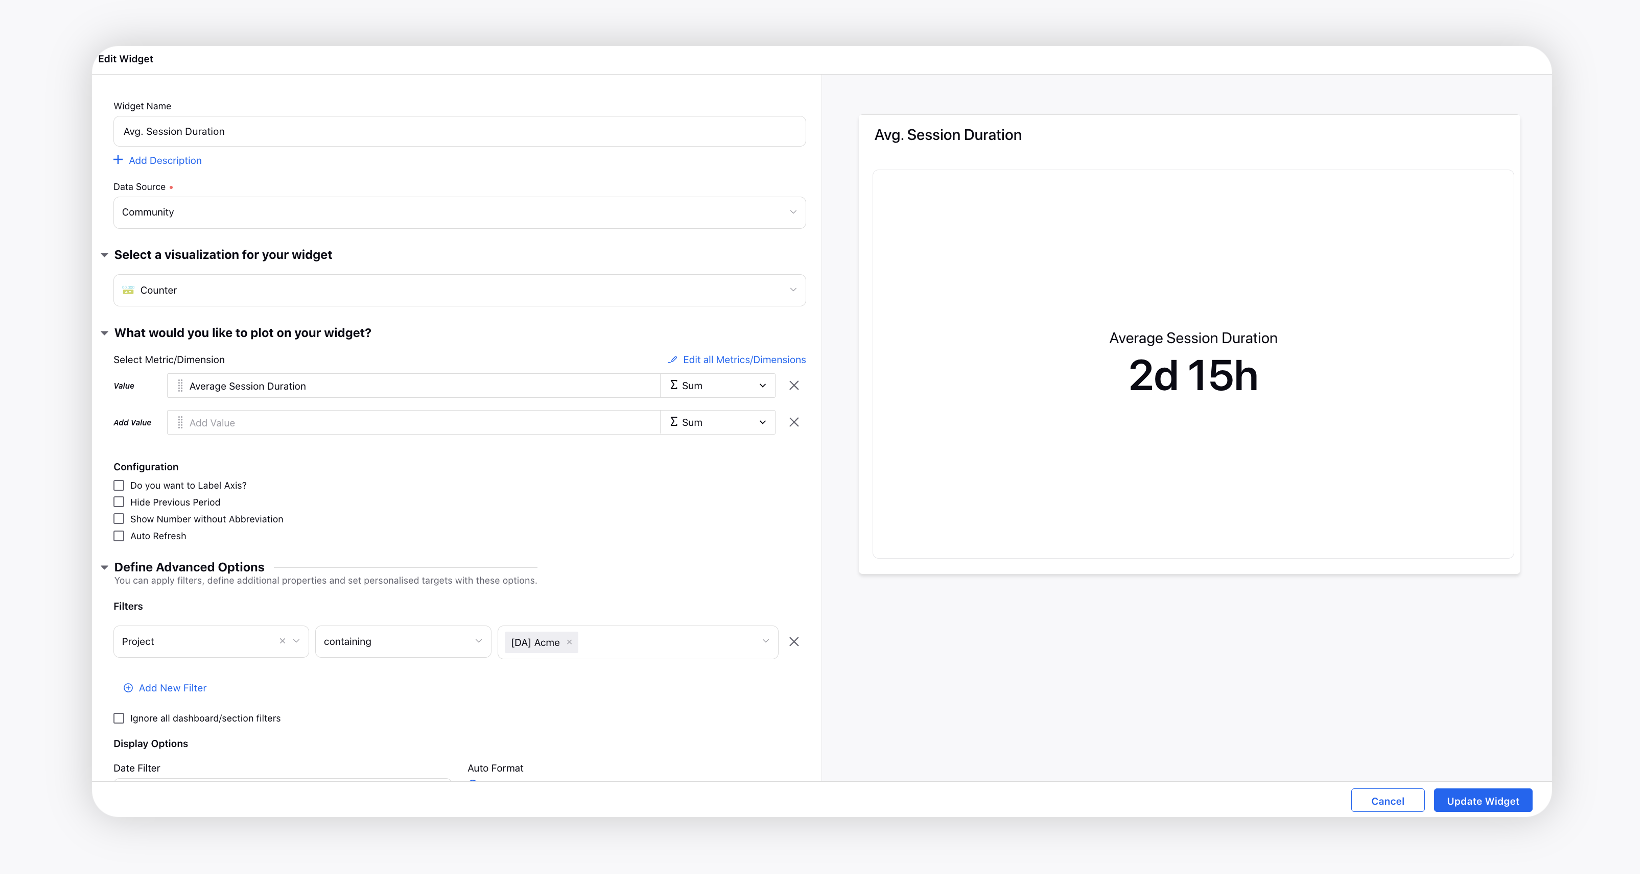
Avg. Session Duration
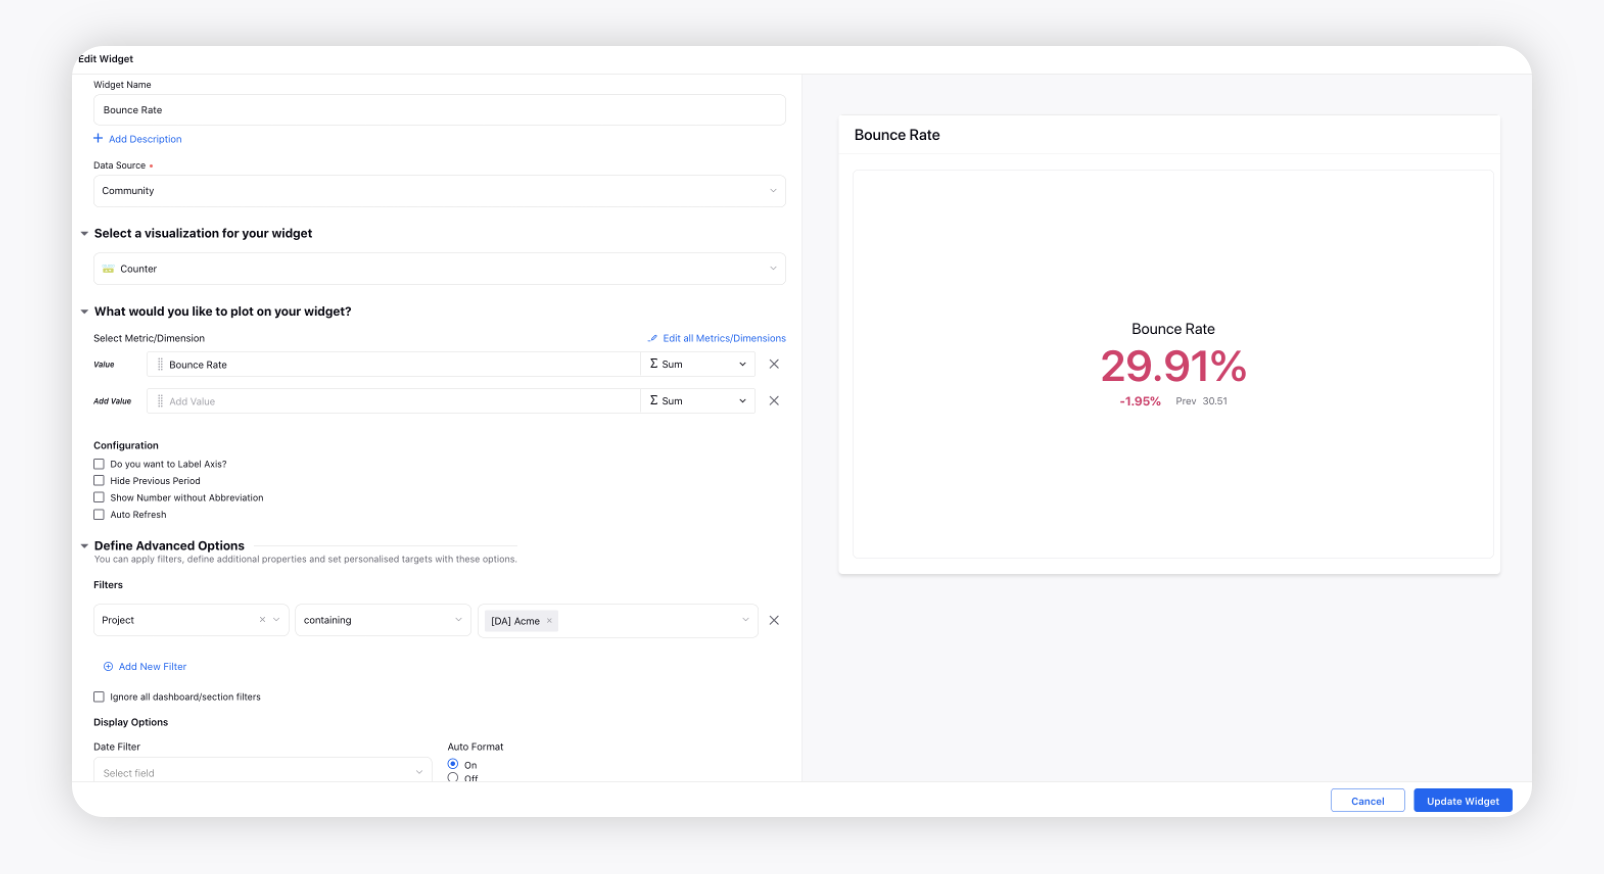
Bounce Rate
Knowledge Portal Website Analytics
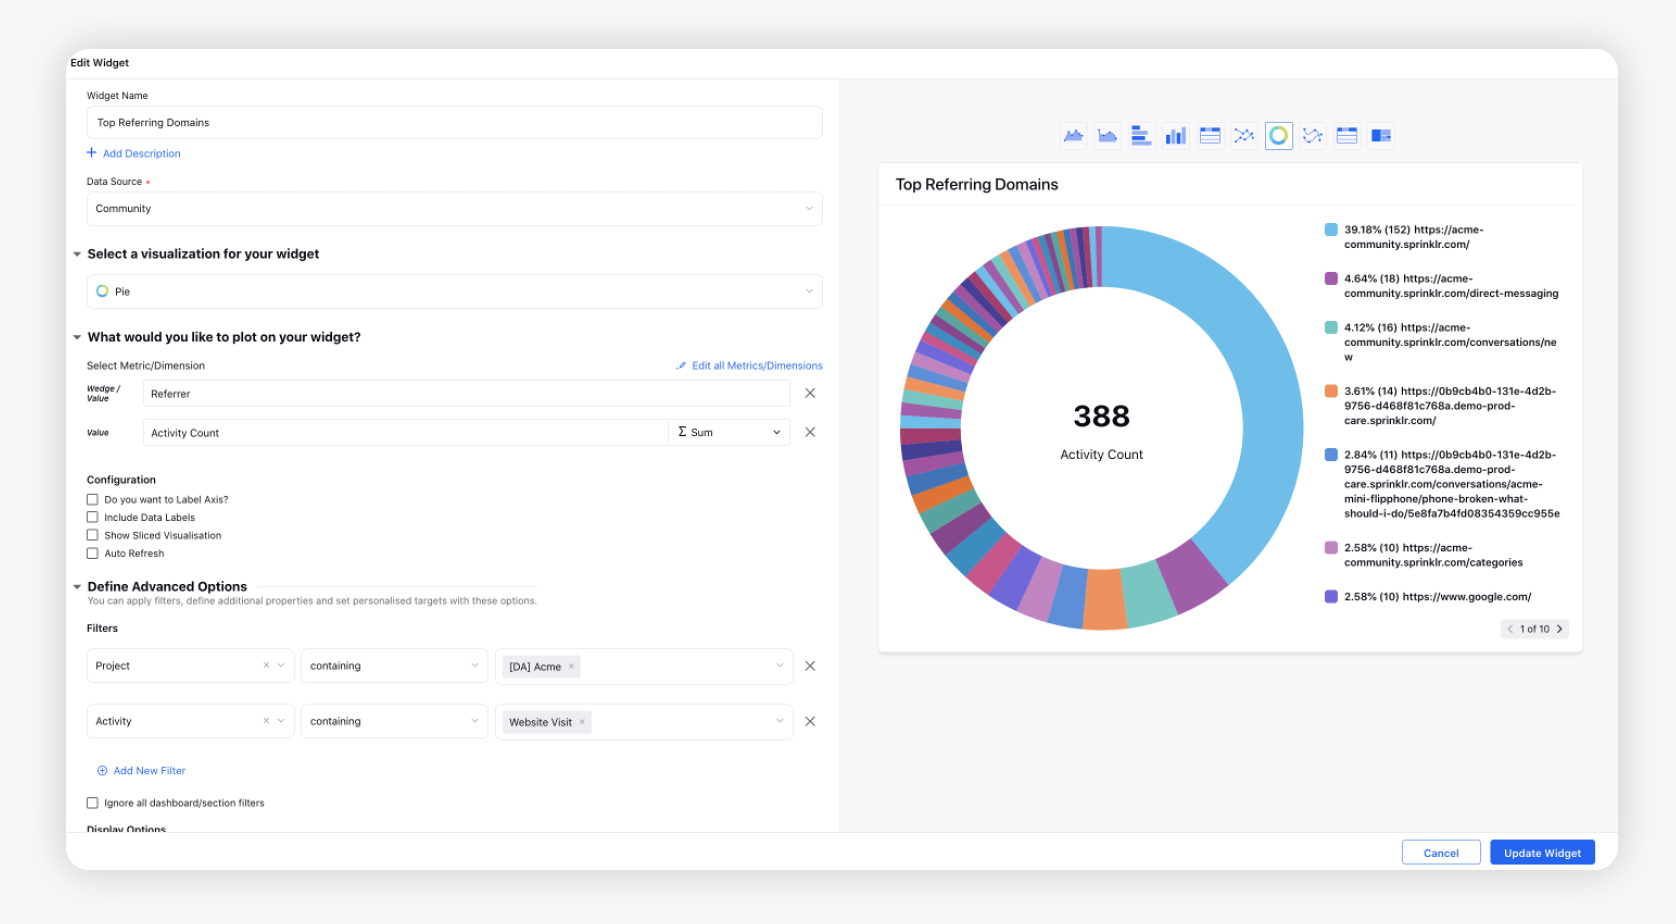
Top Referring Domains
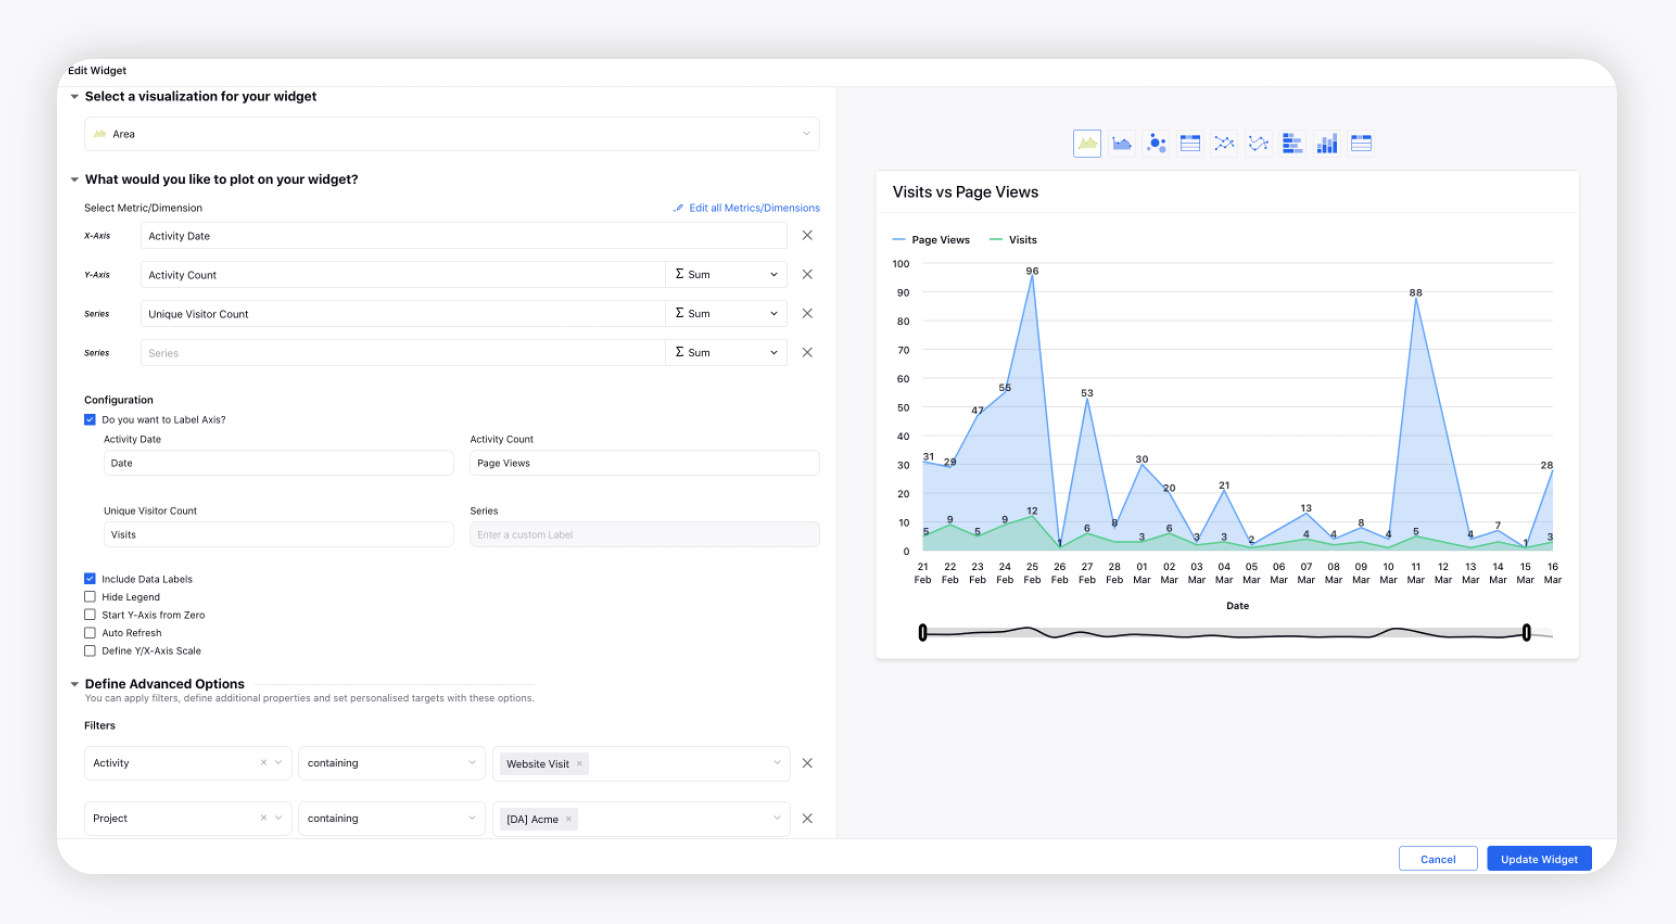
Visits vs Page Views
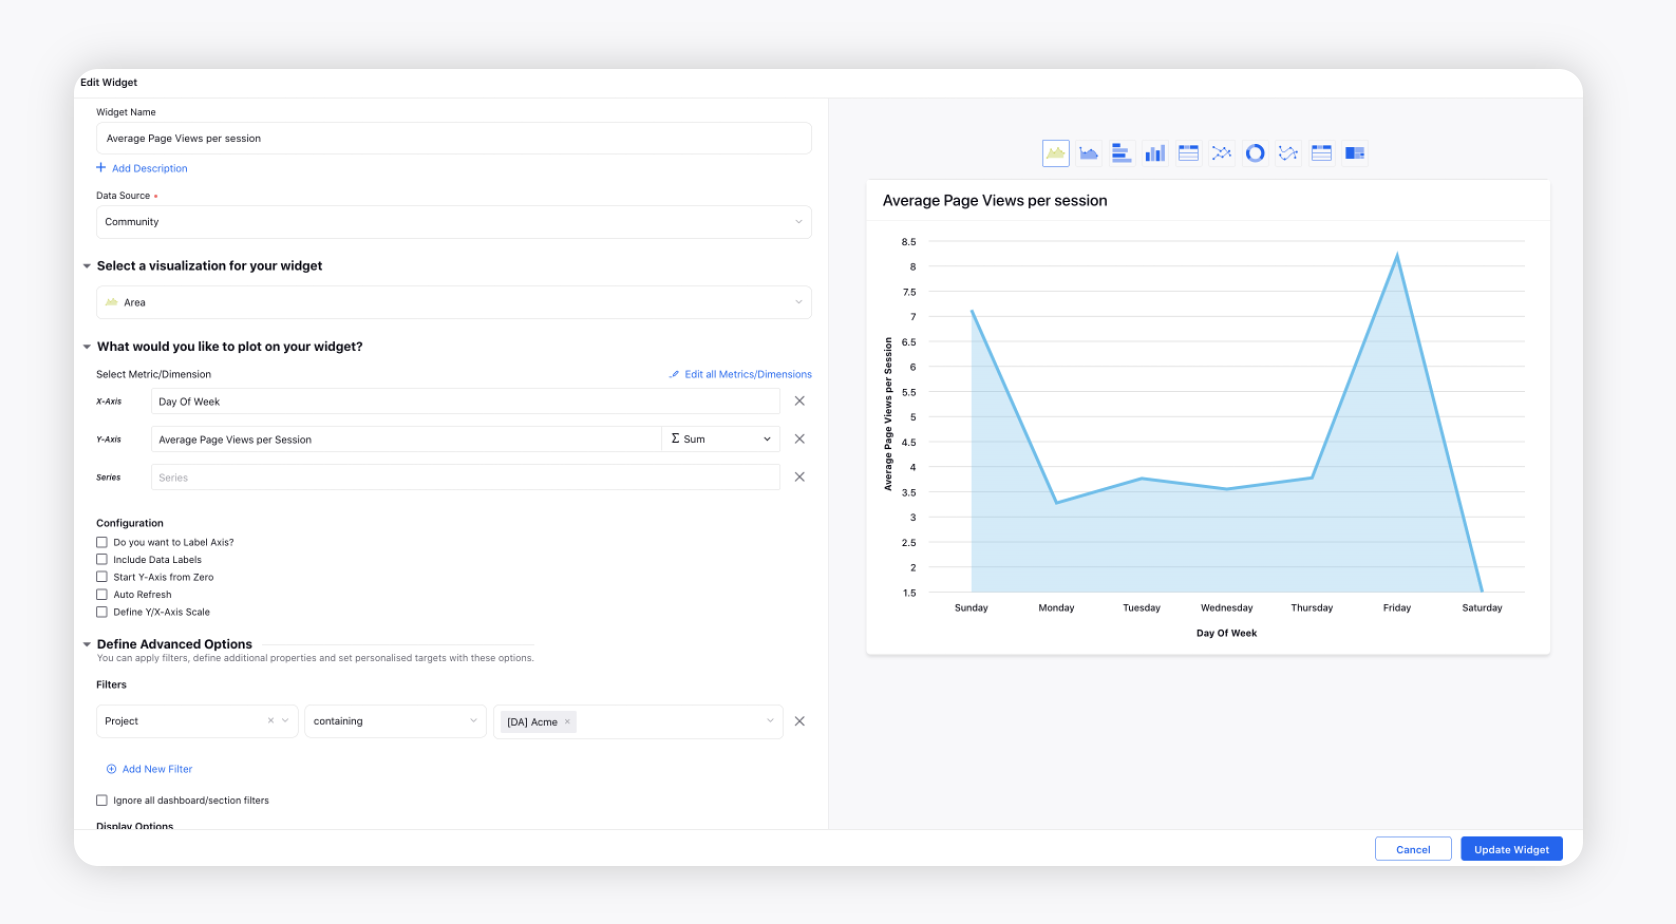
Average Page Views per session
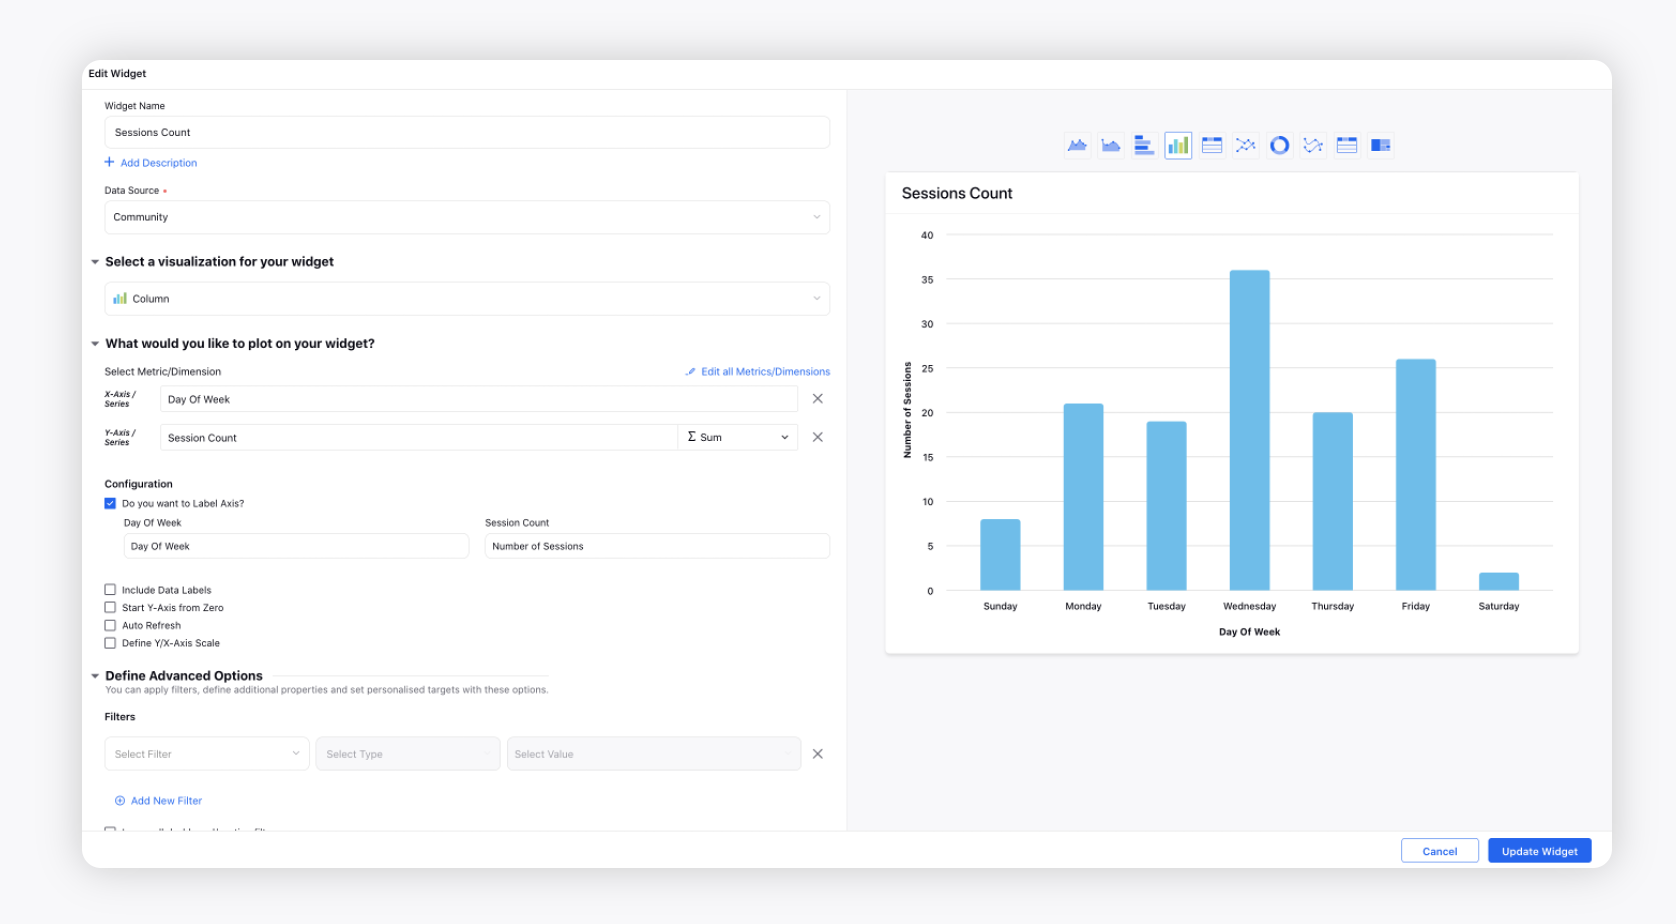
Sessions Count
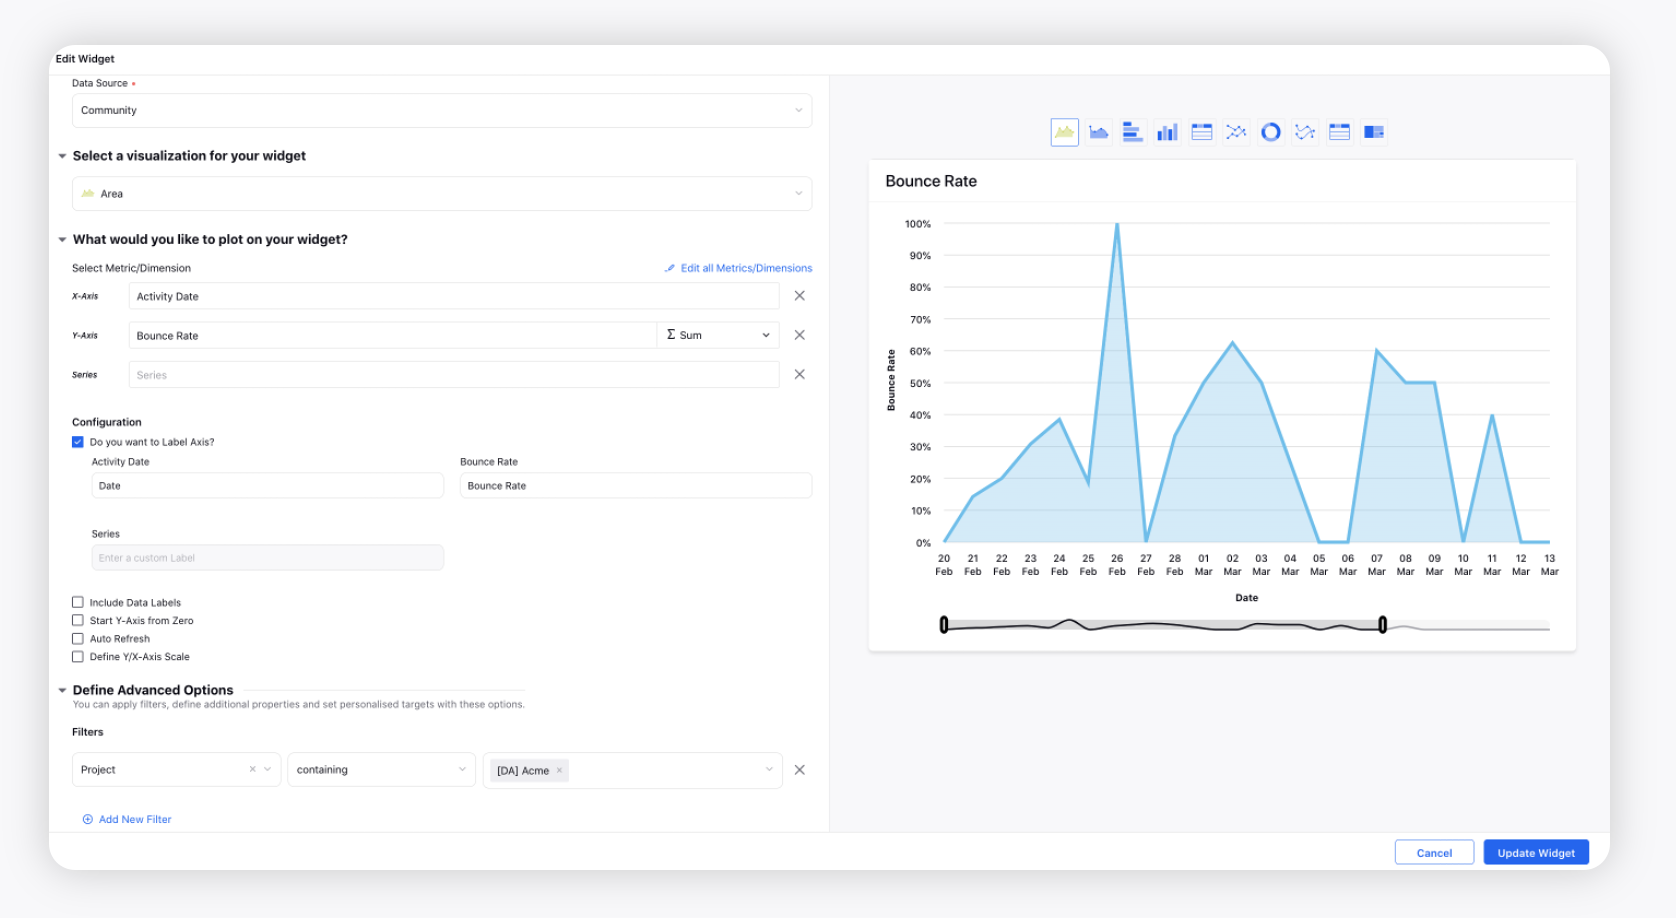
Bounce Rate
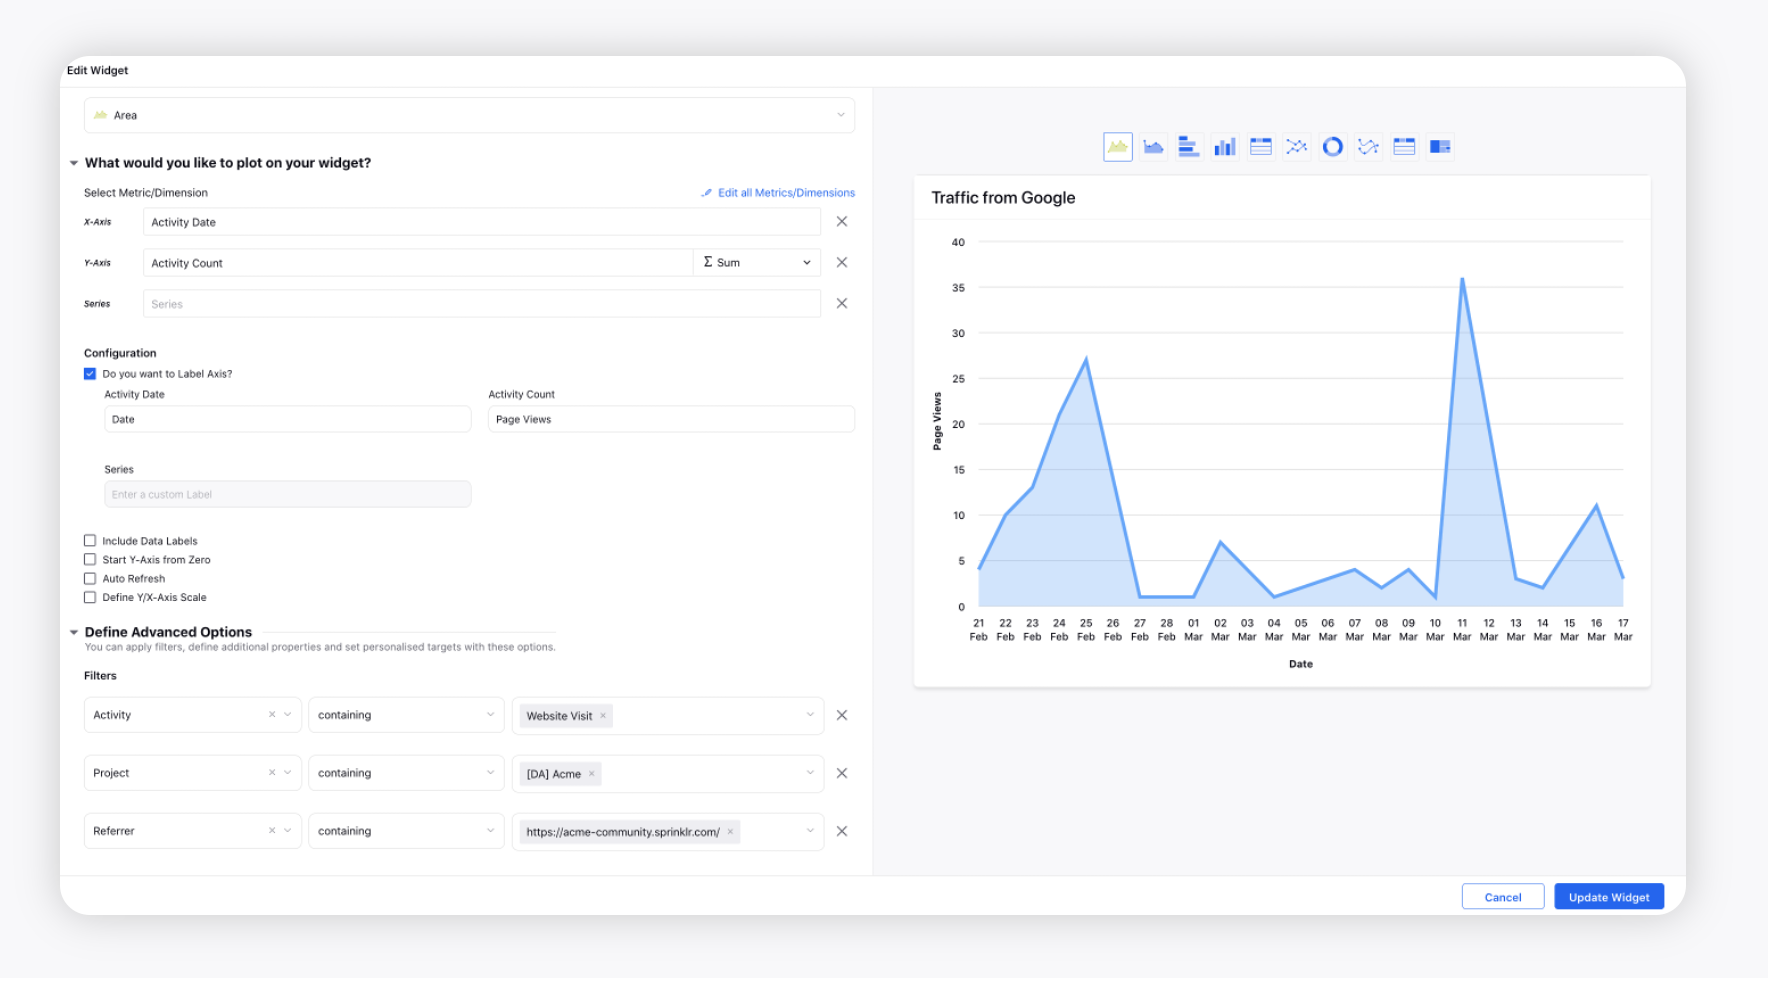
Traffic from Google
Unique Visitors count breakdown by Device
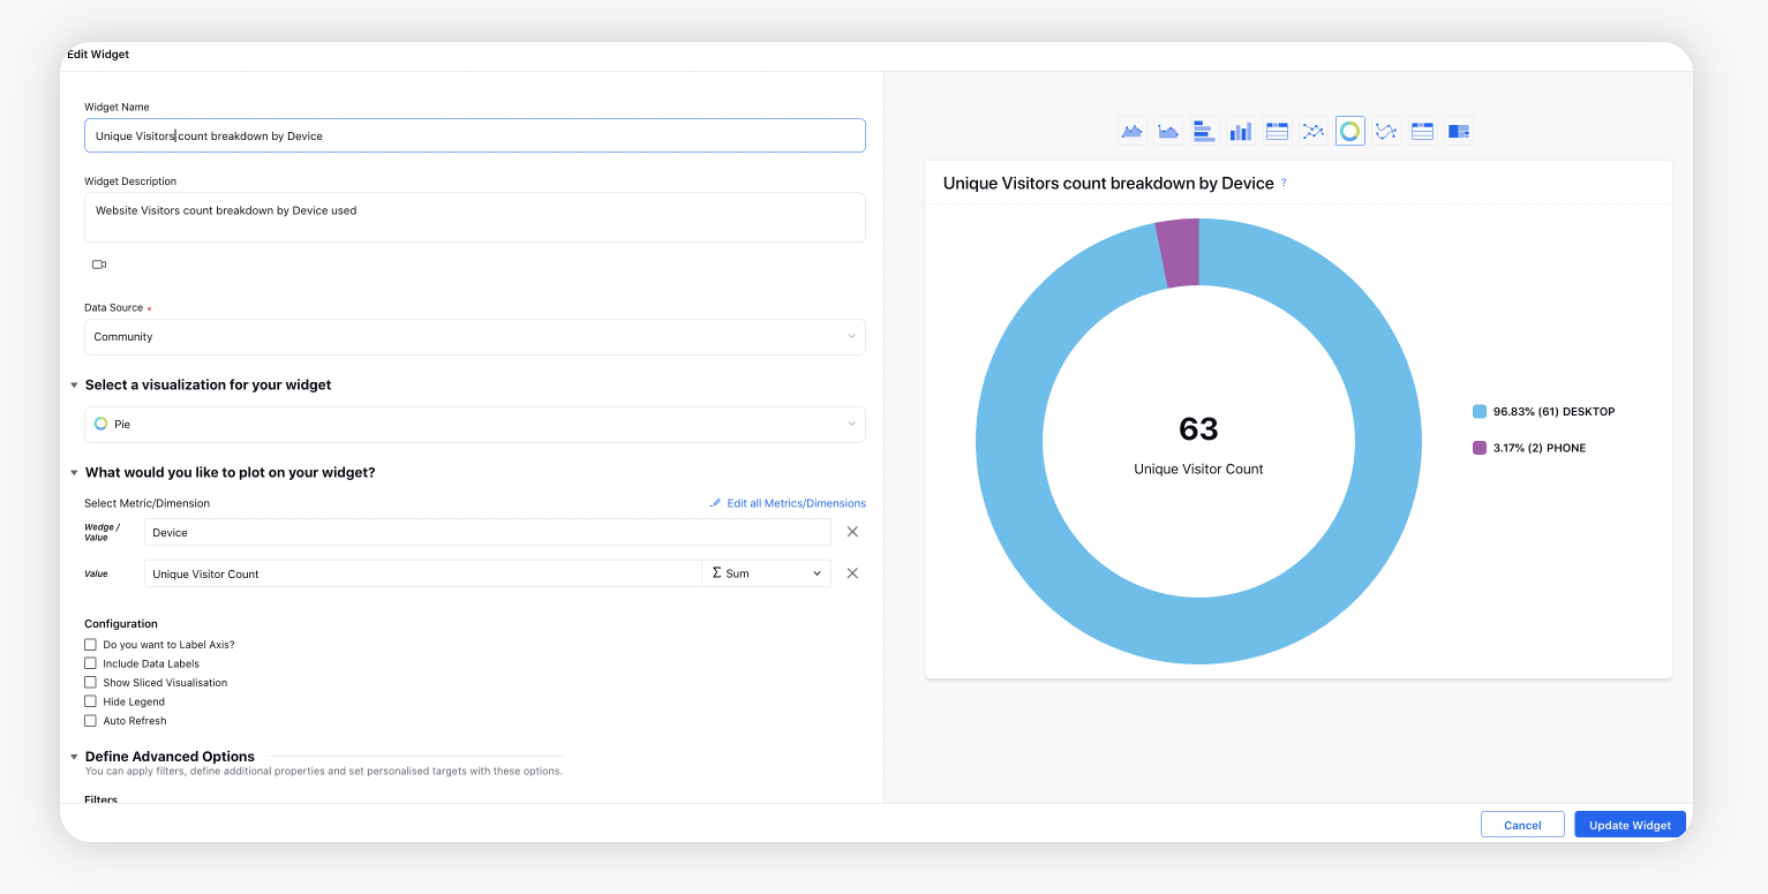
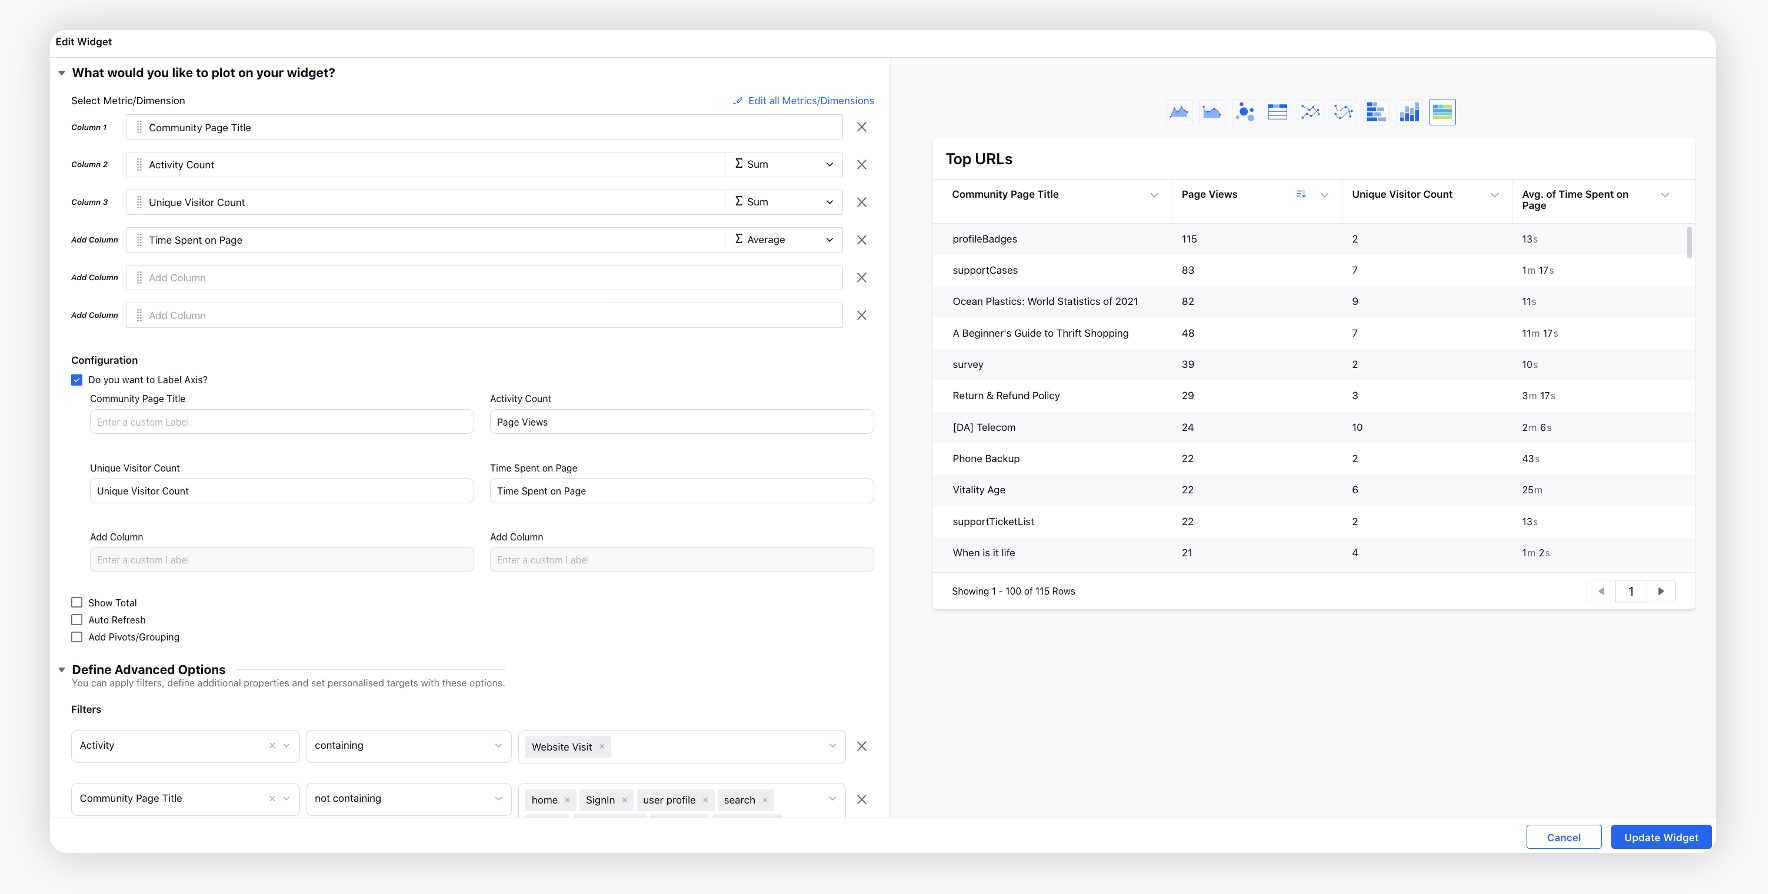
Top Articles and Most Searched Queries
Top URLs
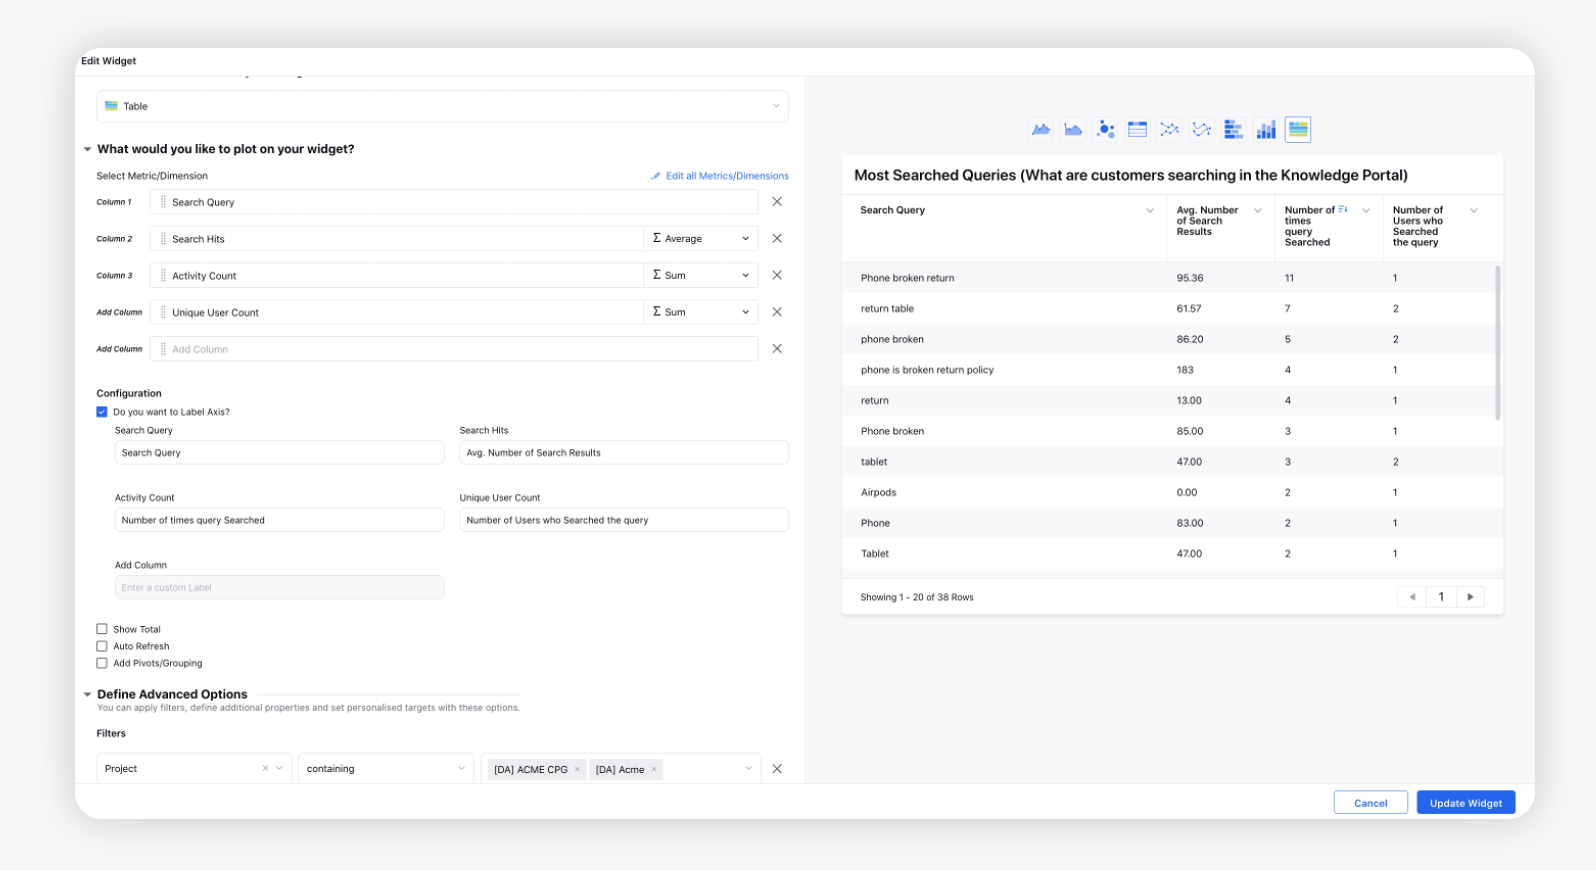
Most Searched Queries
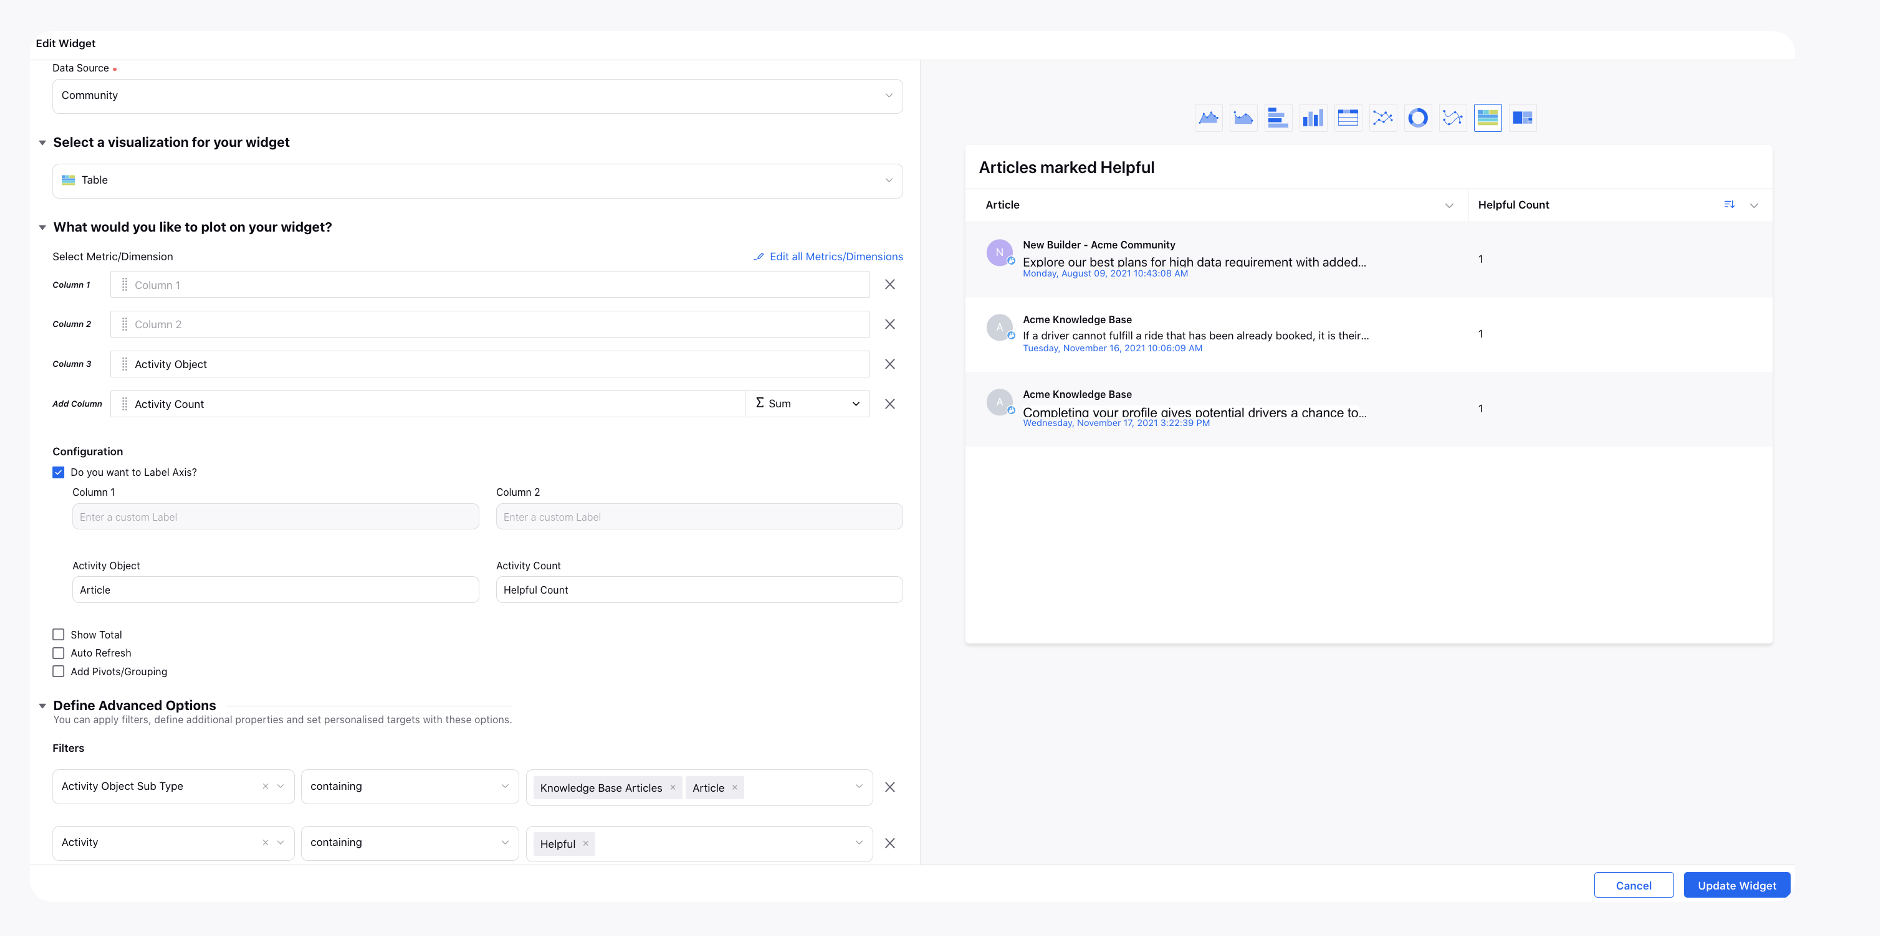
Articles marked Helpful
Articles marked Not Helpful
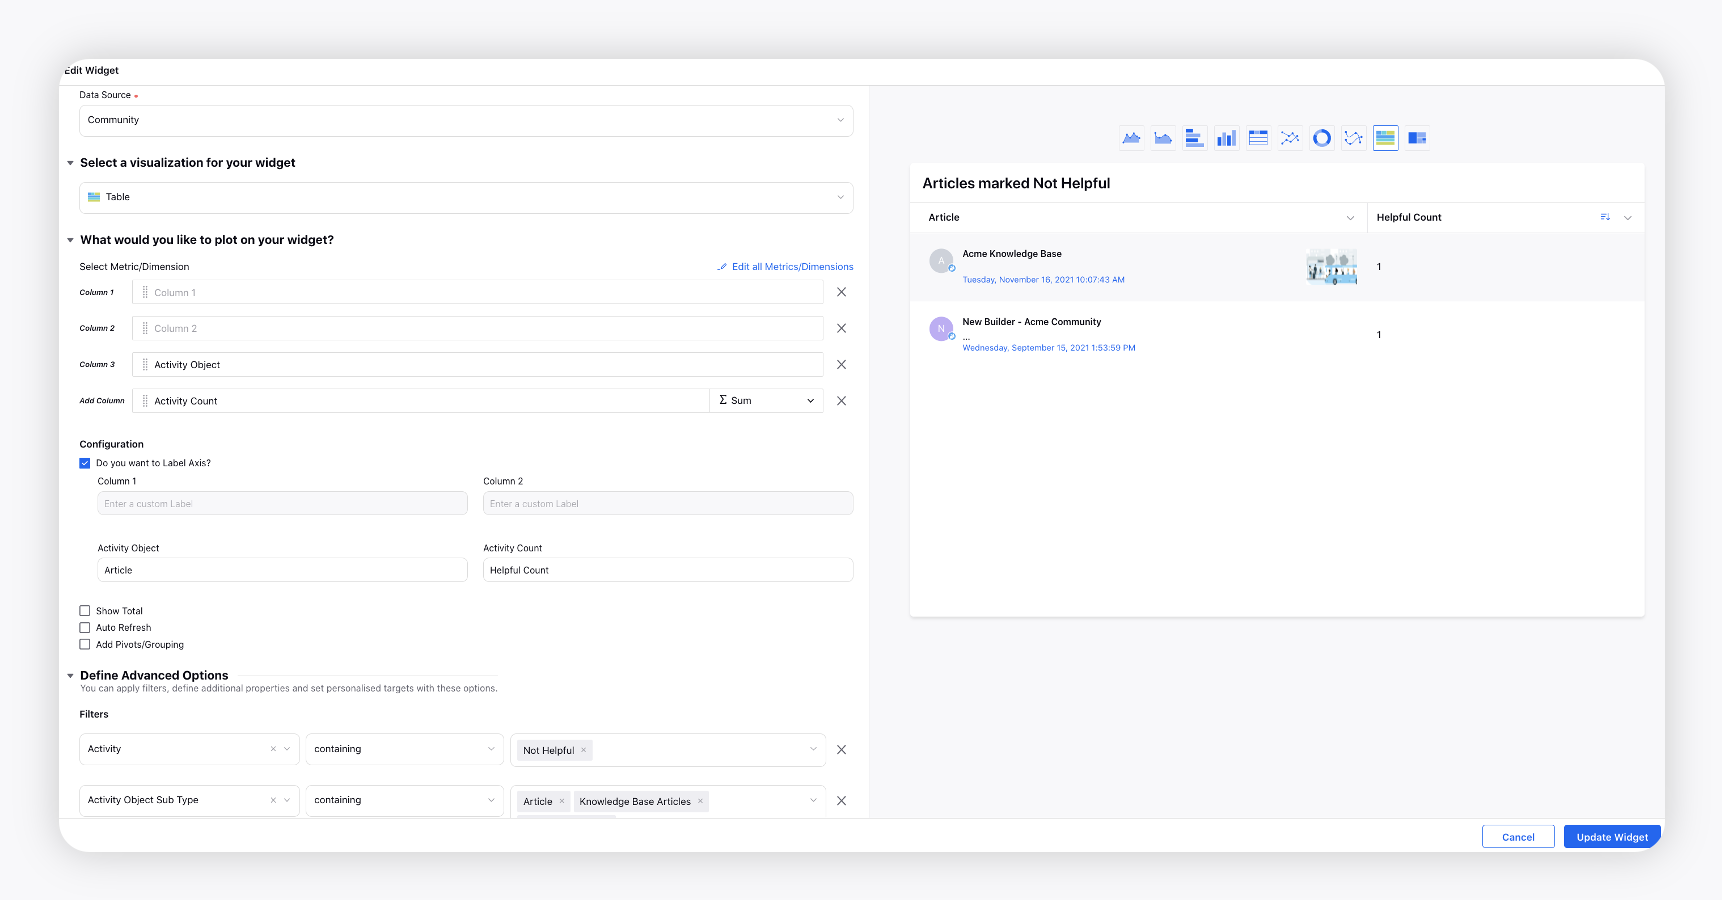
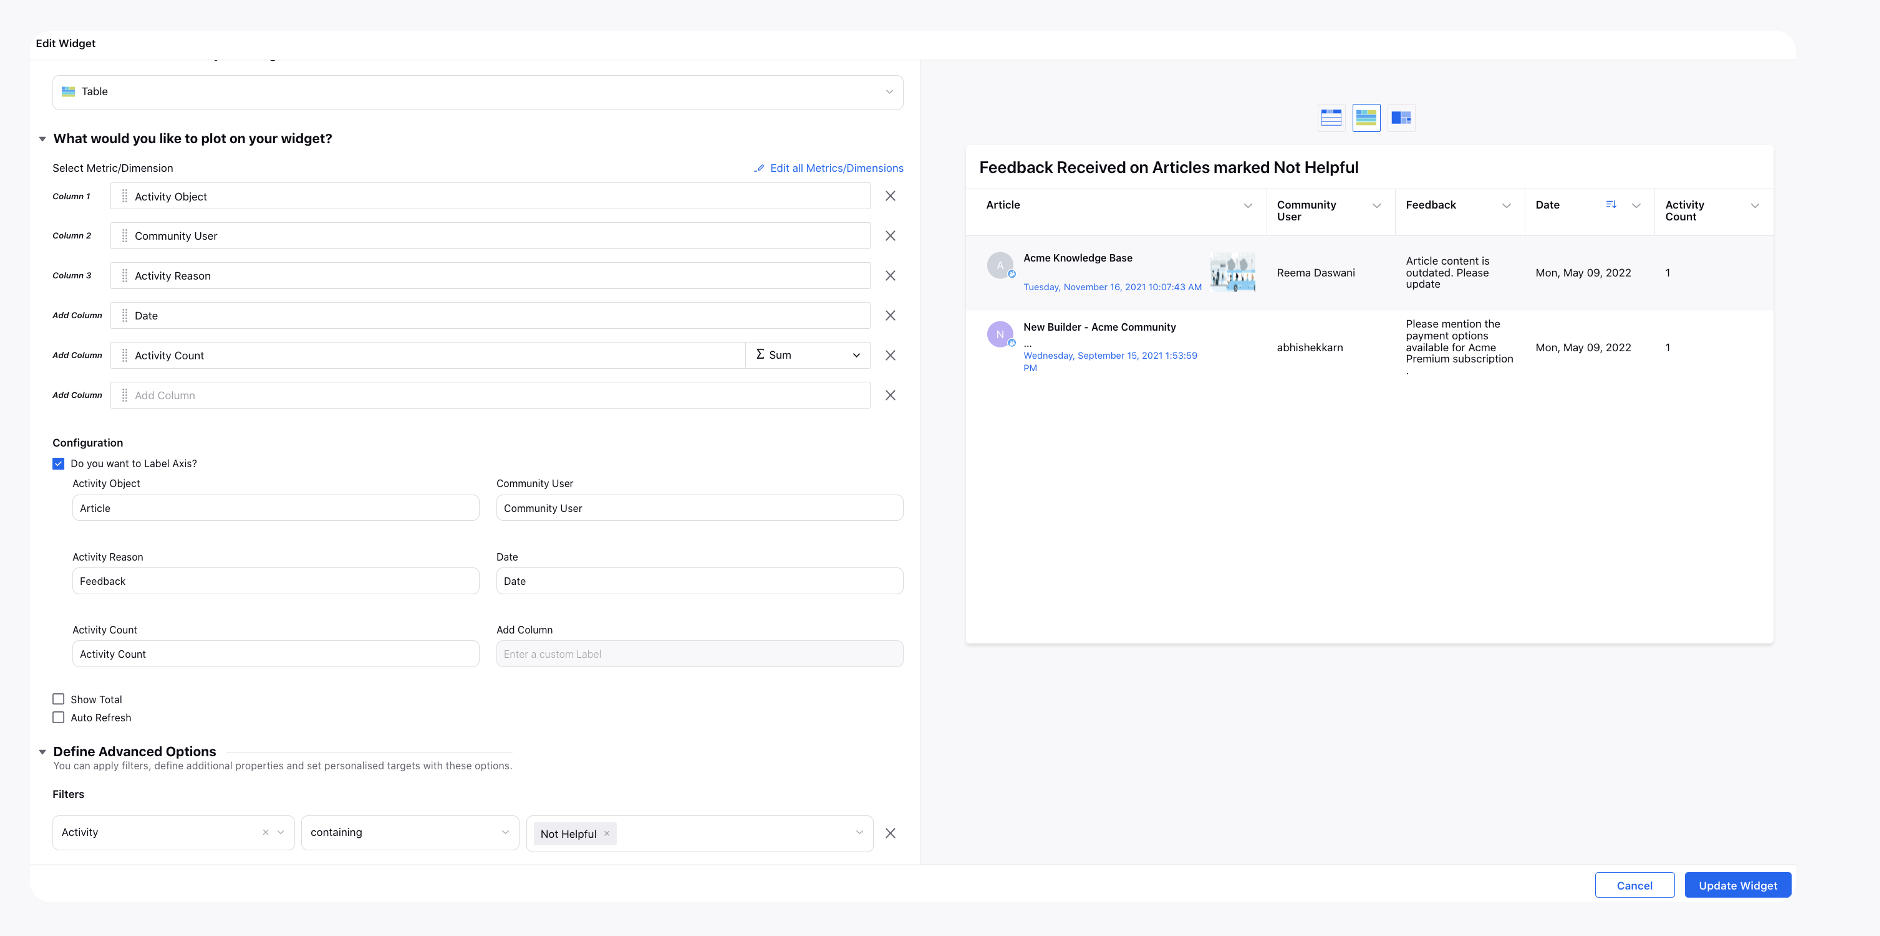
Feedback Received on Articles marked Not Helpful
Reporting on Translated Articles
You can separately track article-level events, such as helpful count and modified date, for each translated version of the parent article. These details can be tracked using Knowledge Base Reporting. The following article-level details can be tracked for each translated version:
Helpful Count
Article Feedback
Created on
Modified Date
Published Date
External URL
Event Count.
Agent Usage
Smart Assist: Knowledge Base
Inbound Cases with AI predicted Articles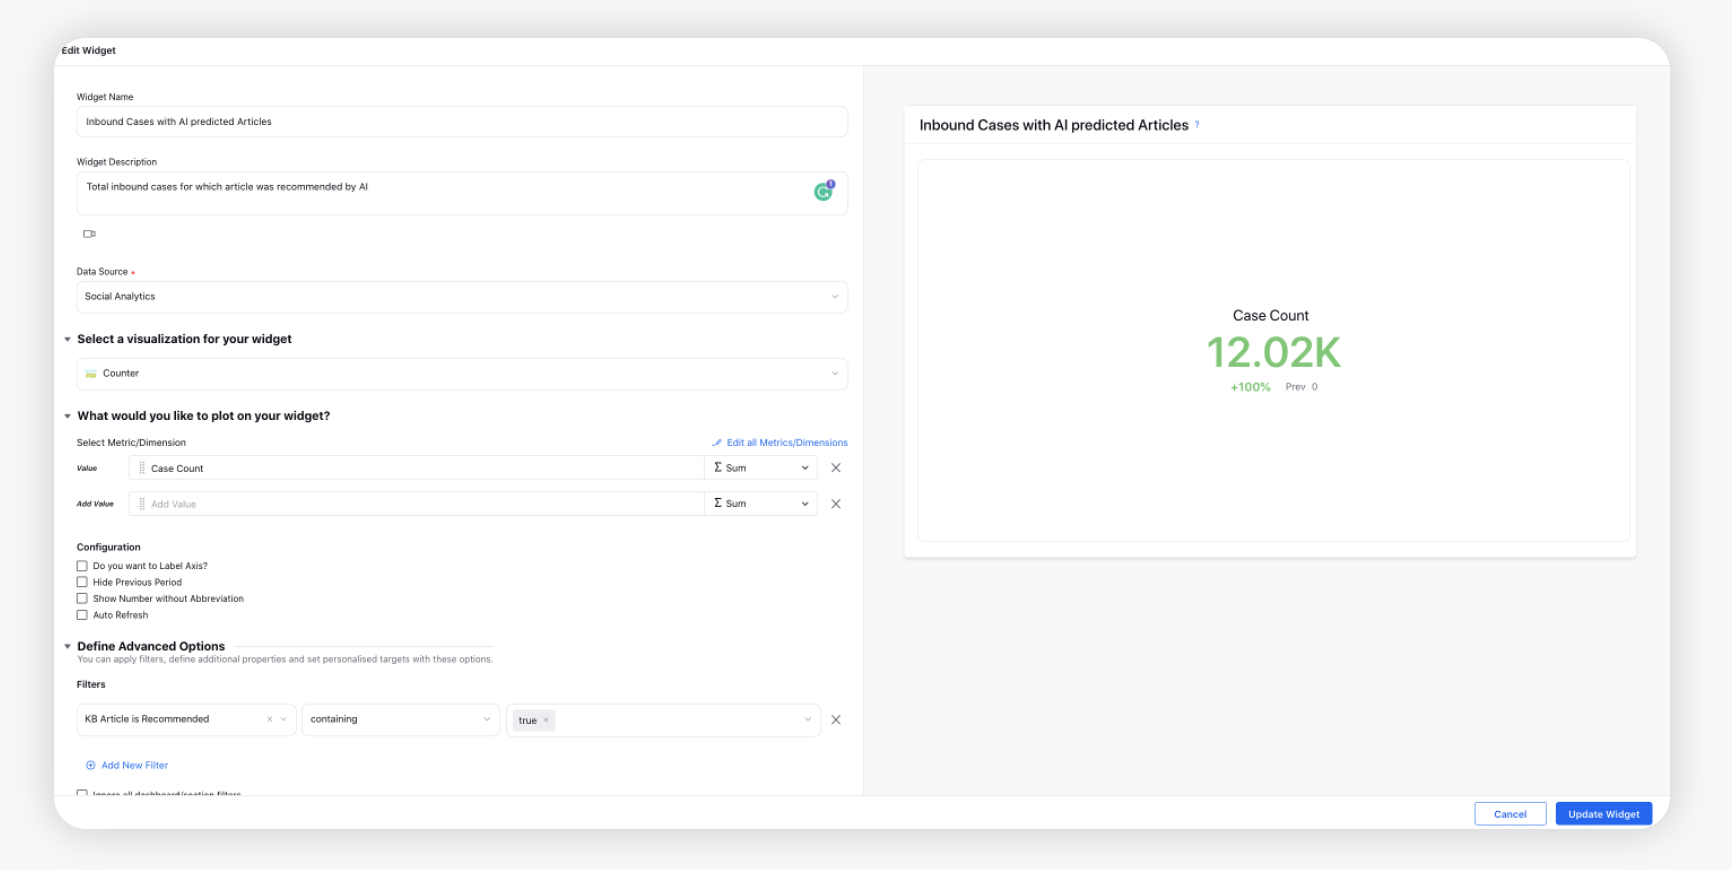
Total AI predicted Articles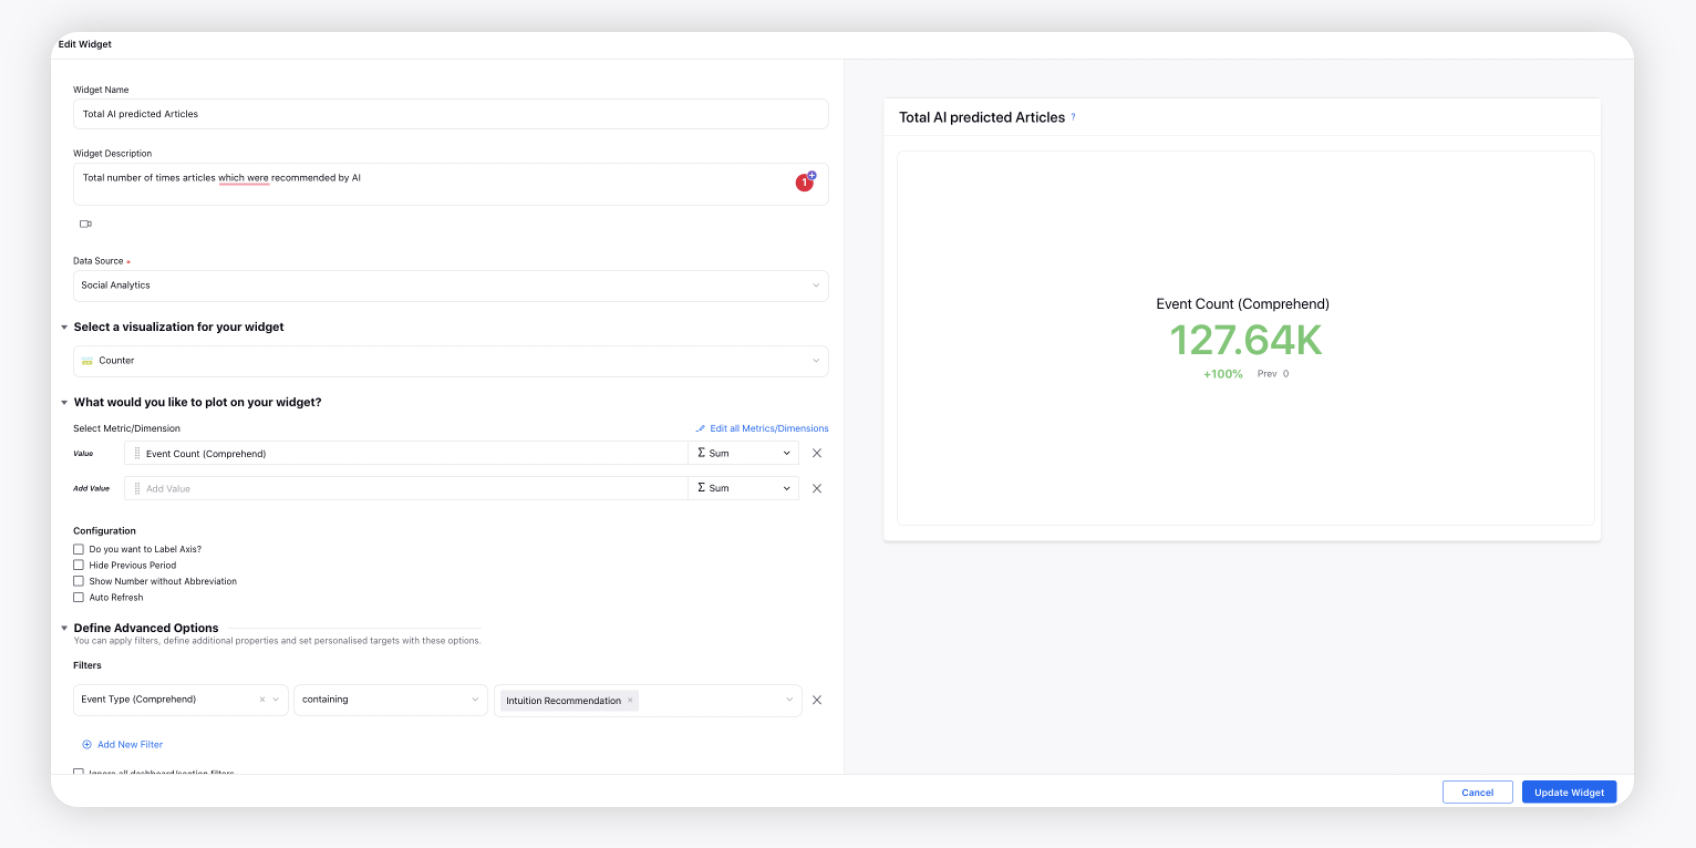
Article Read Count by Agents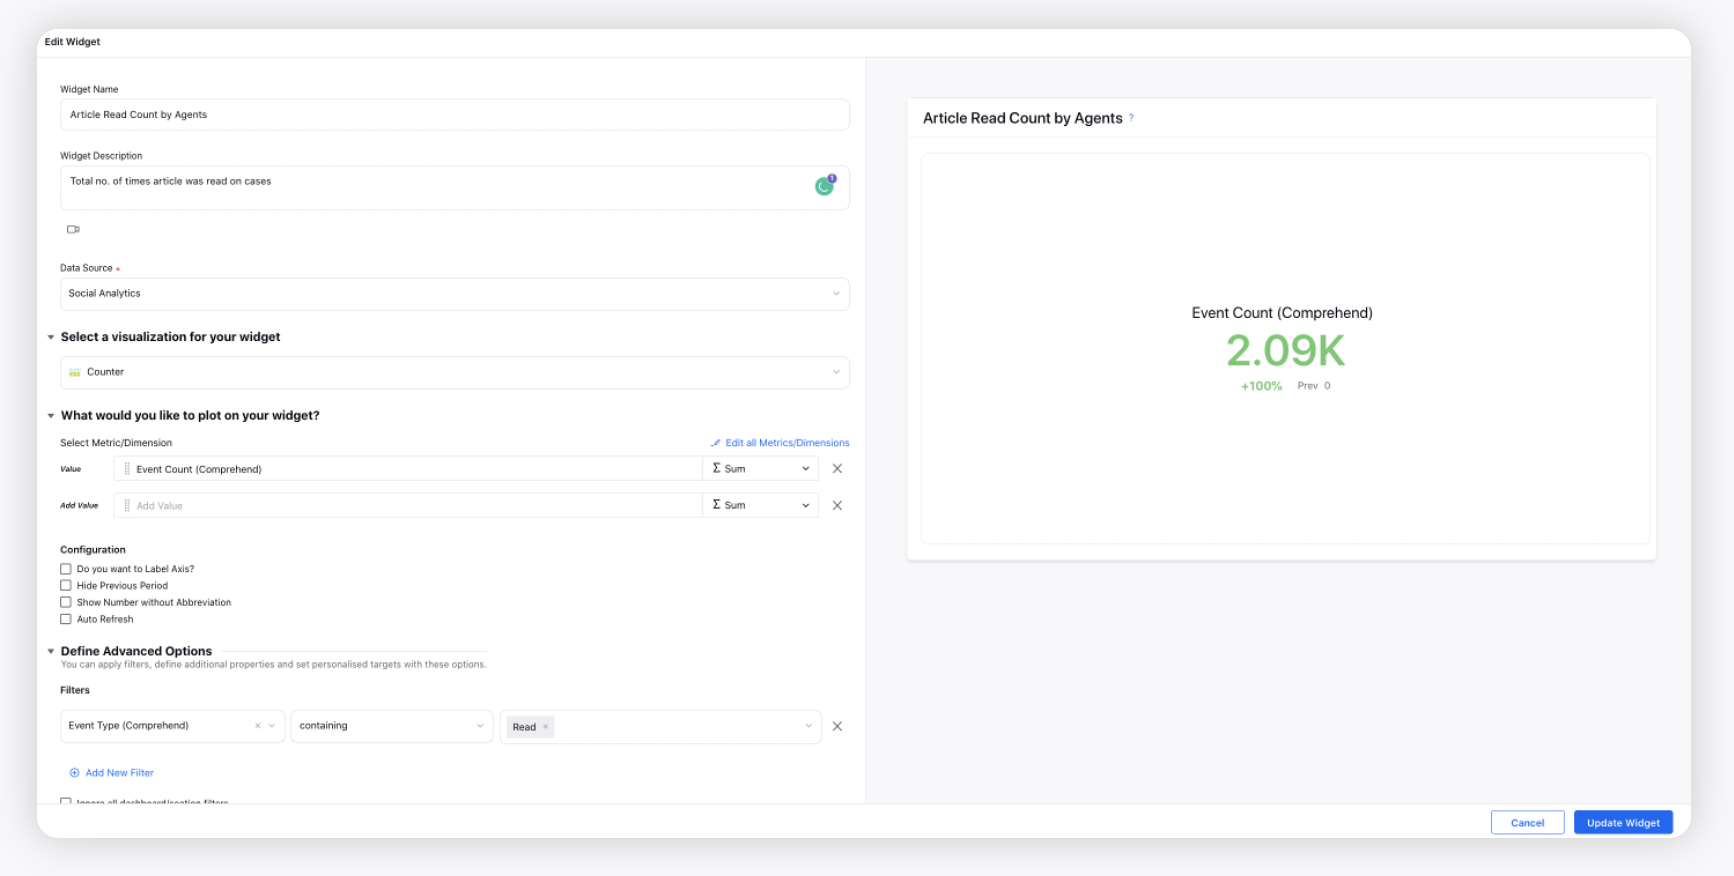
Helpful Count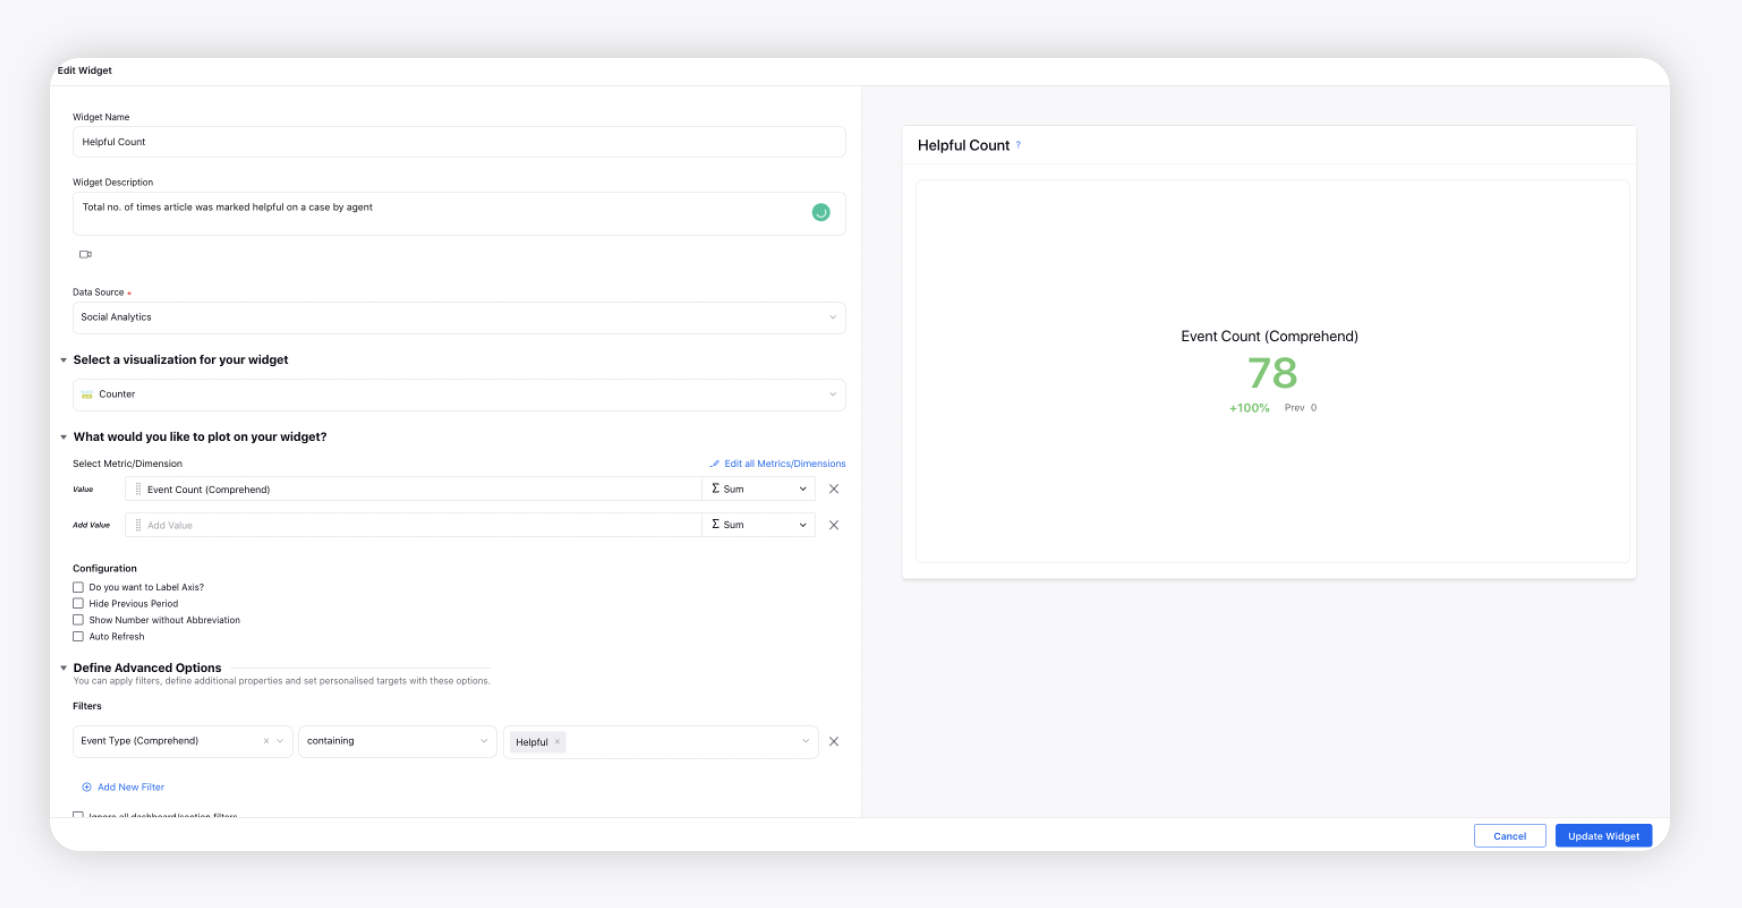
Unhelpful Count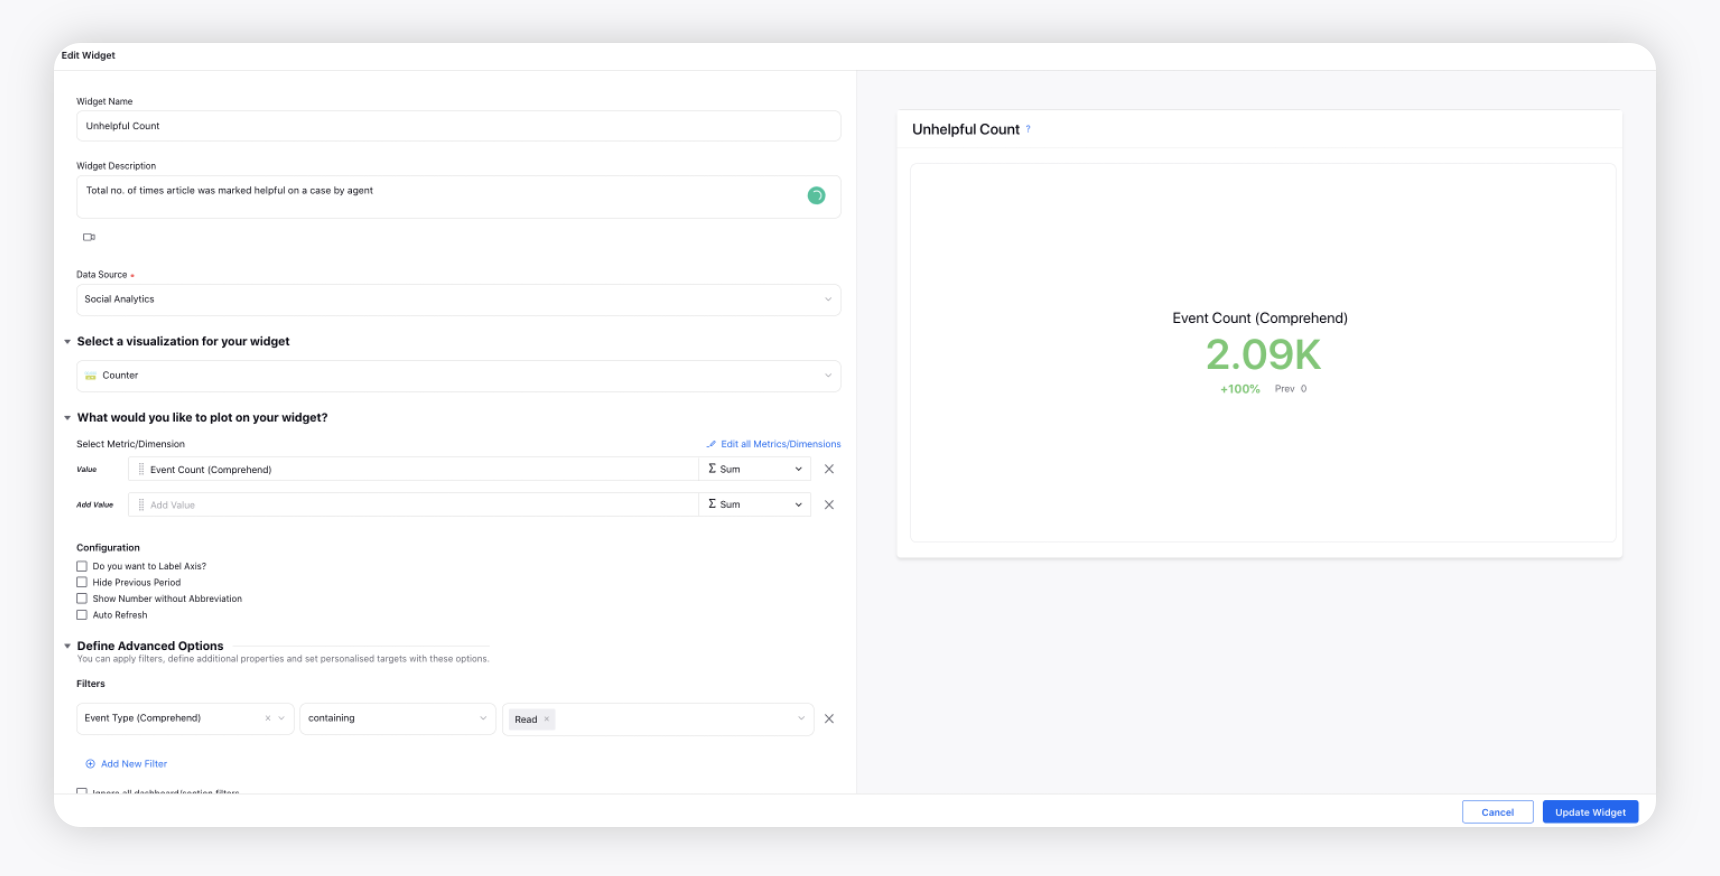
Article Recommendation Summary
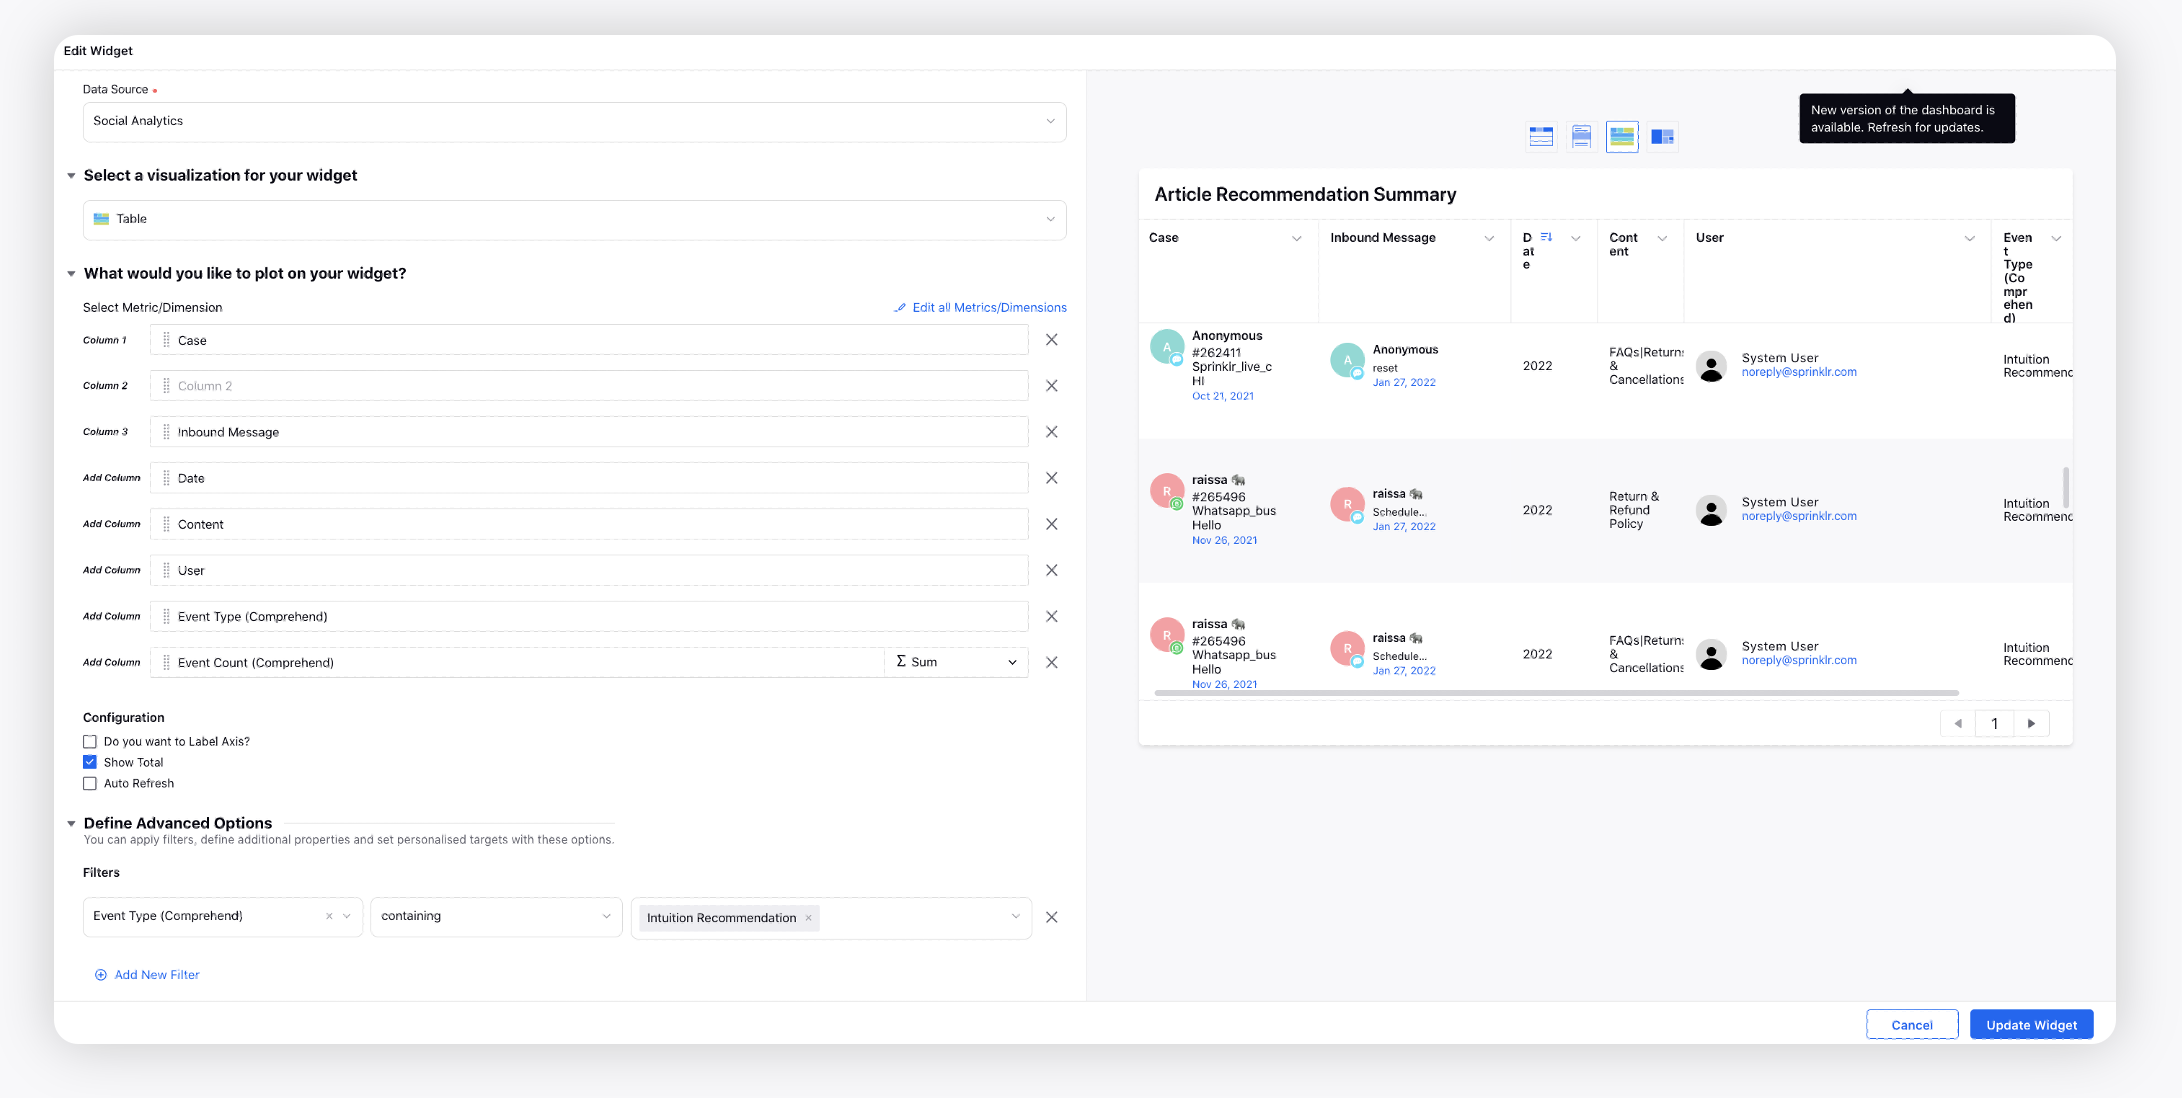
Case Response SLA without Article Used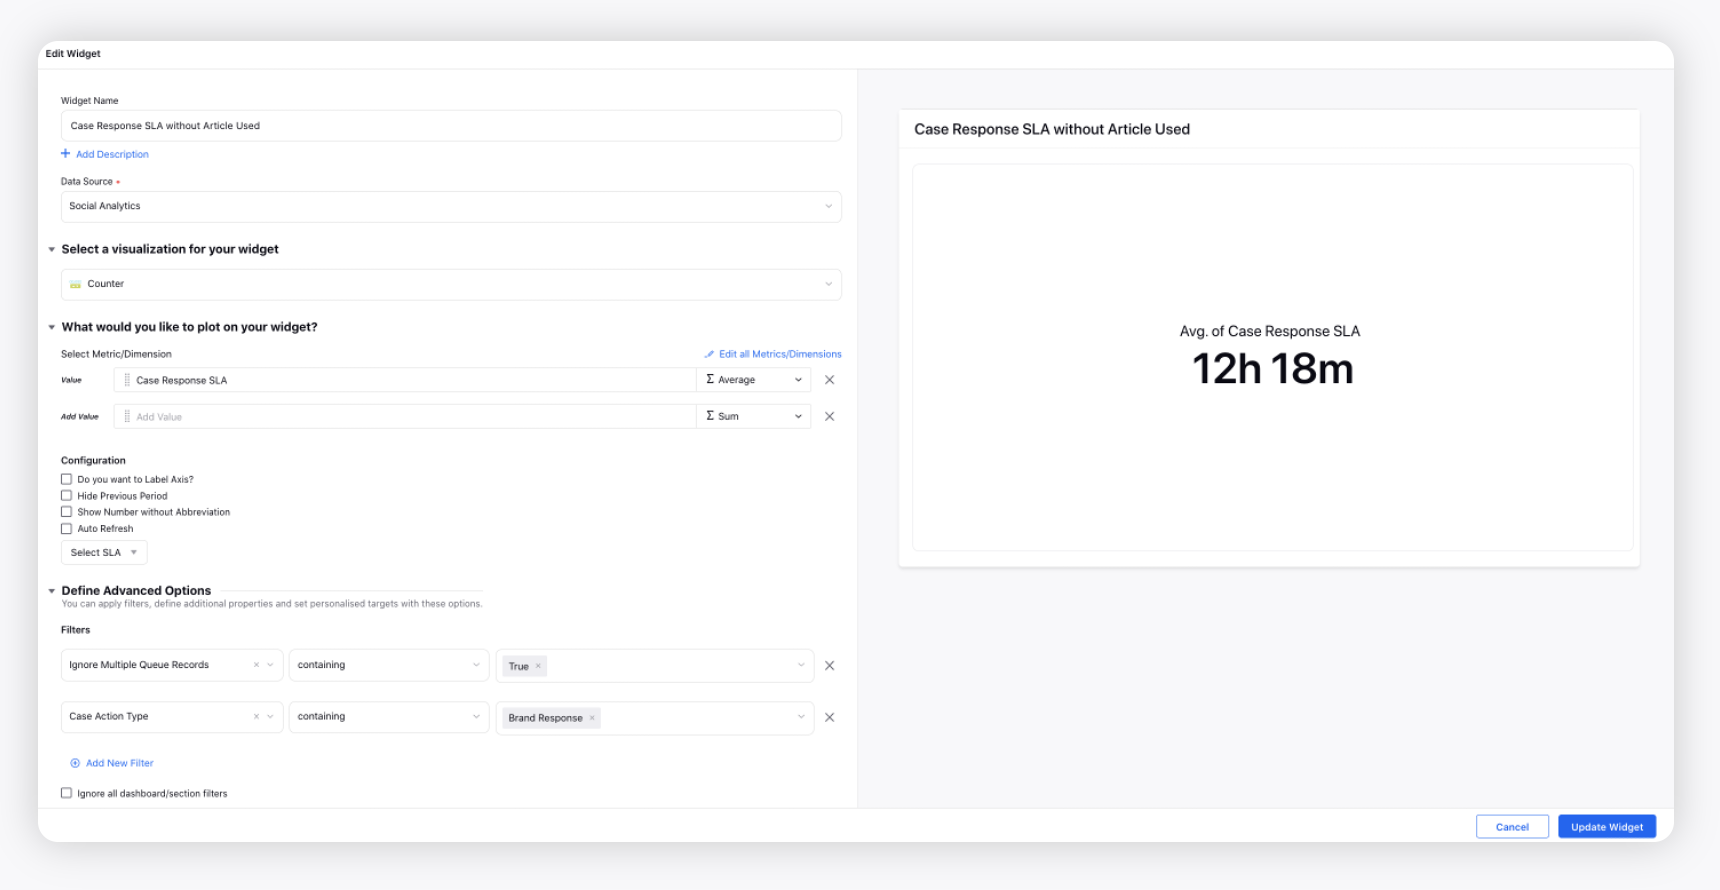
Case Response SLA with Article Usage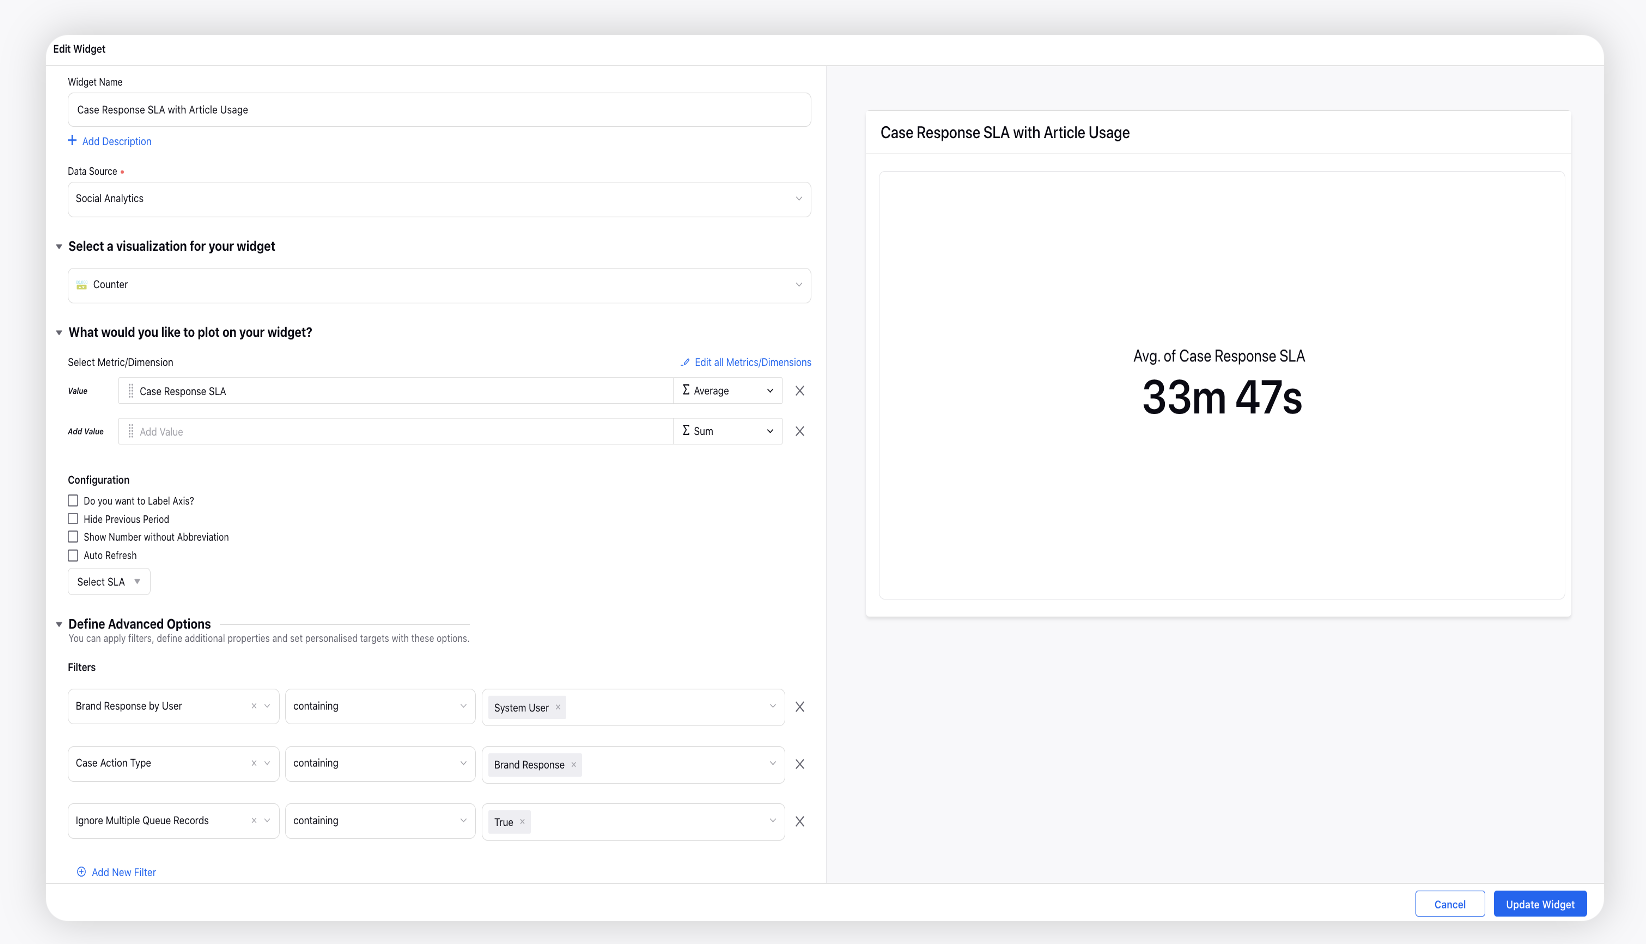
CSAT without article usage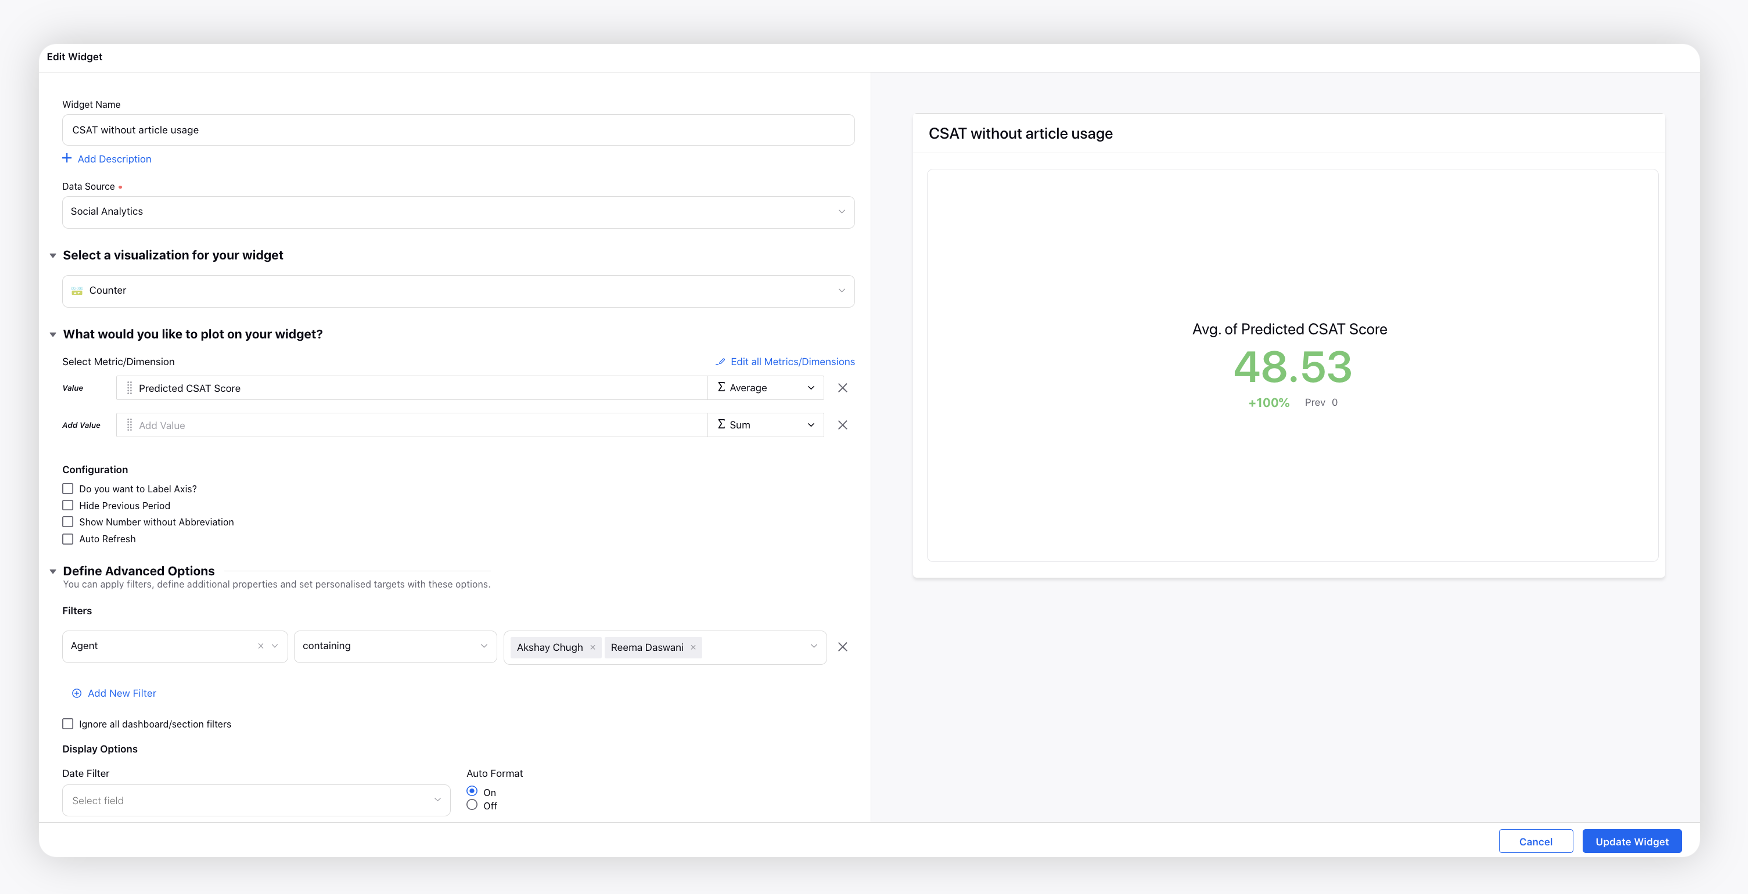
CSAT with article usage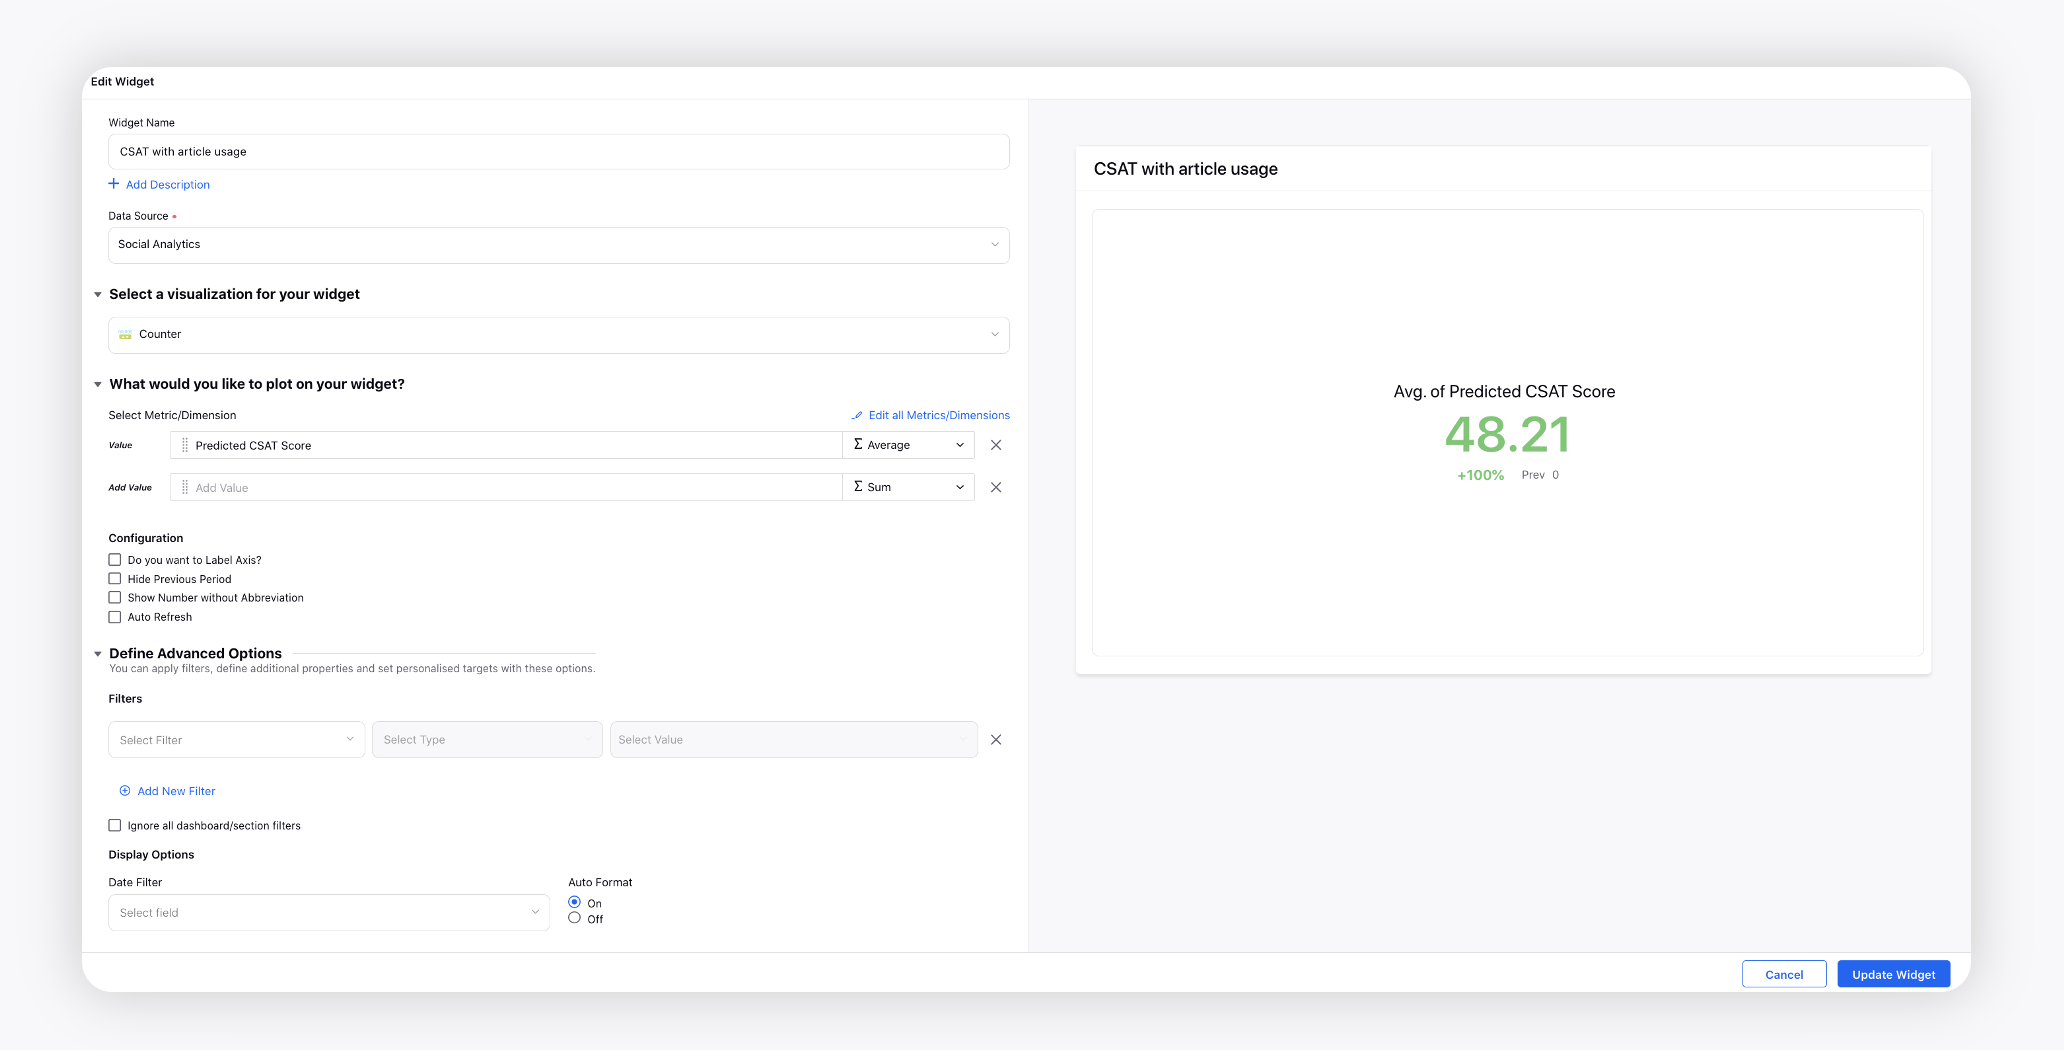
Most Used Content by Agents
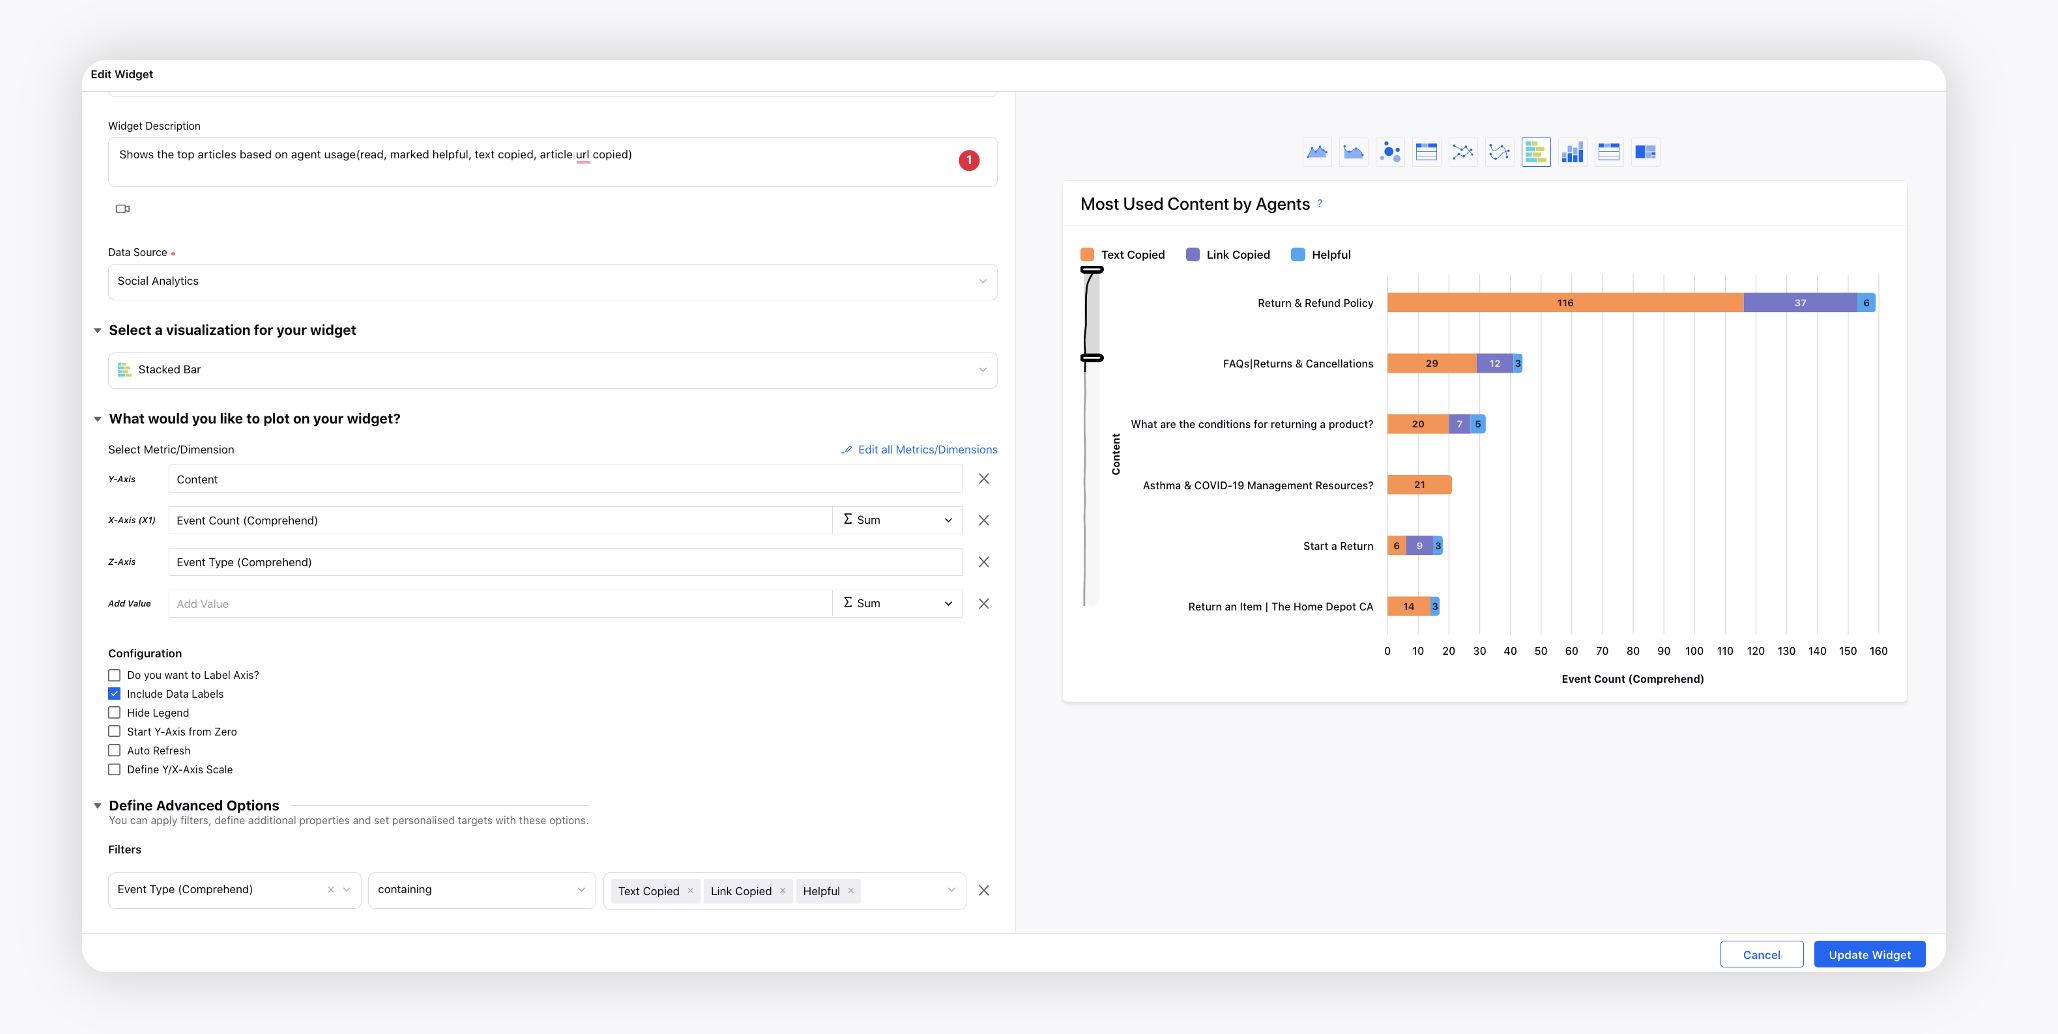
Article Usage Summary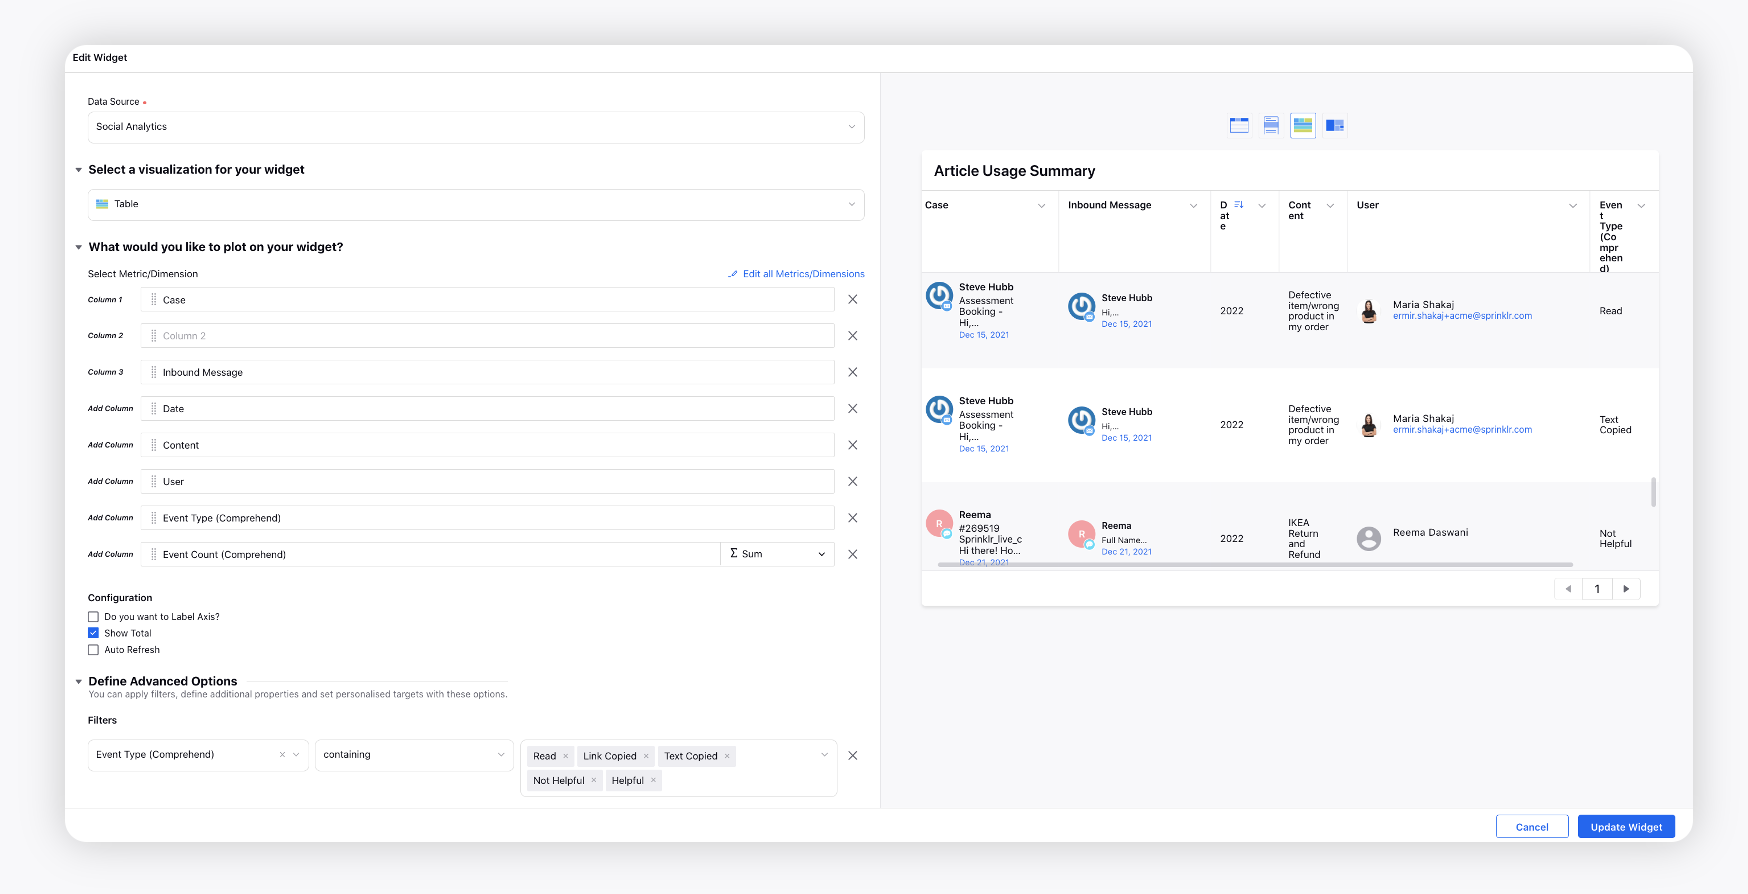
Article Usage: User adoption Summary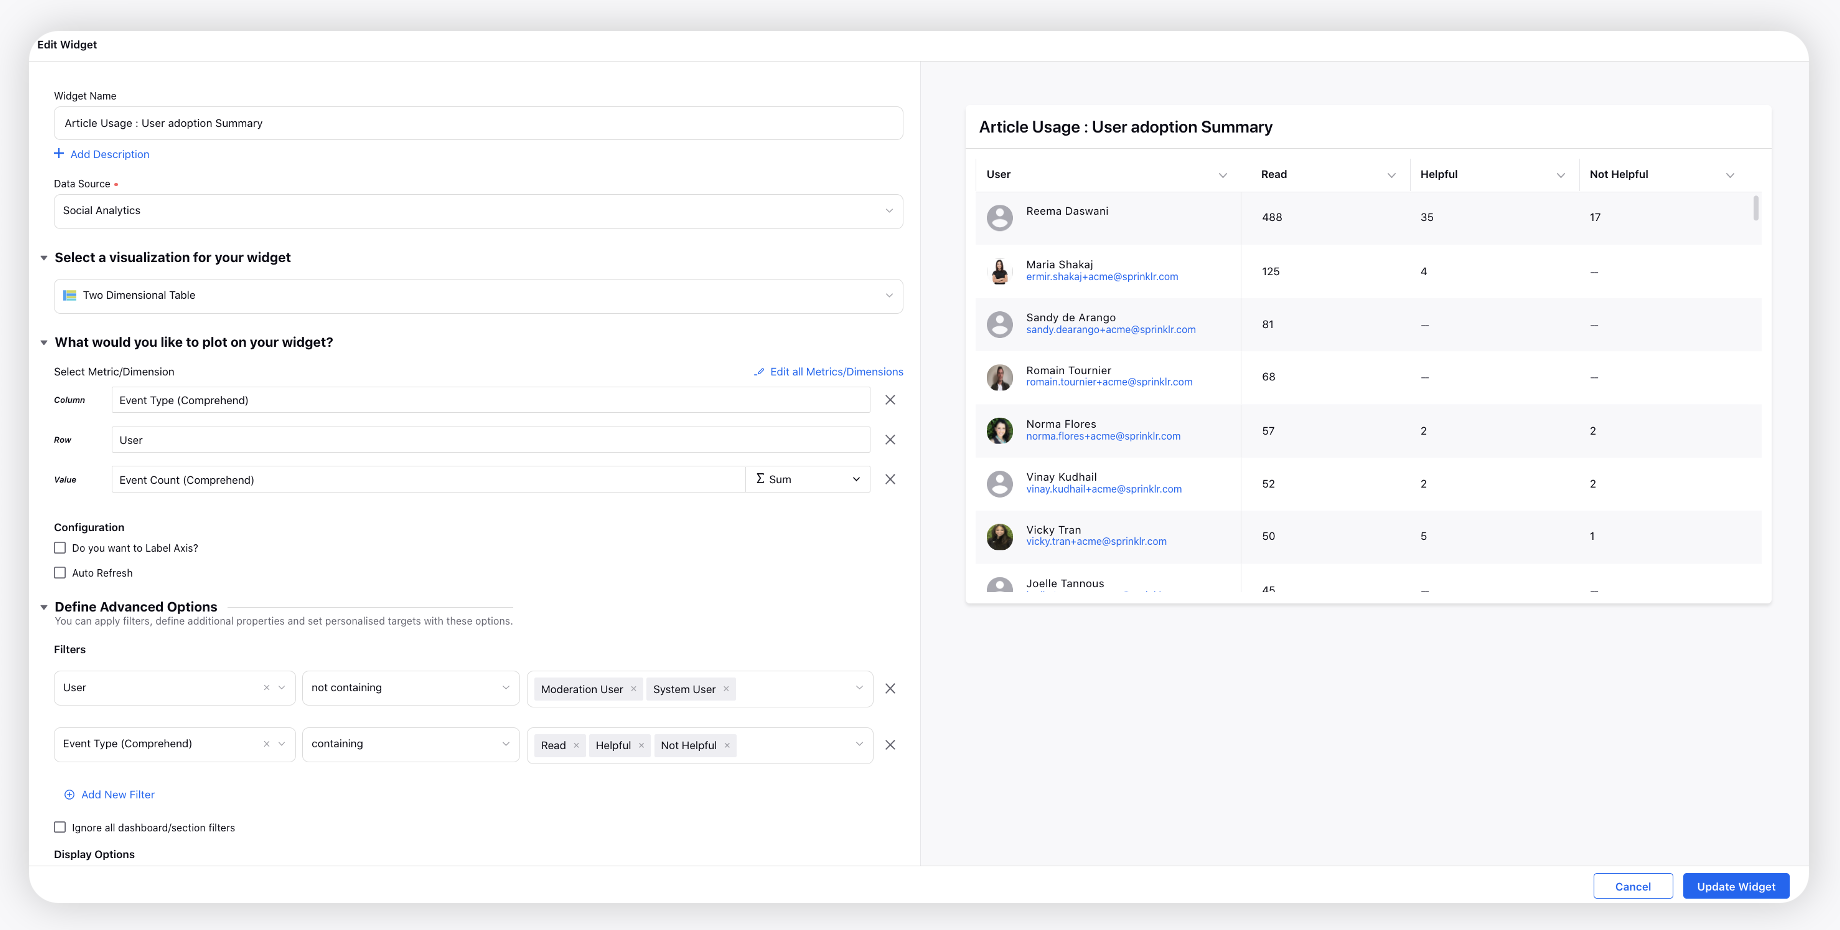
Articles marked helpful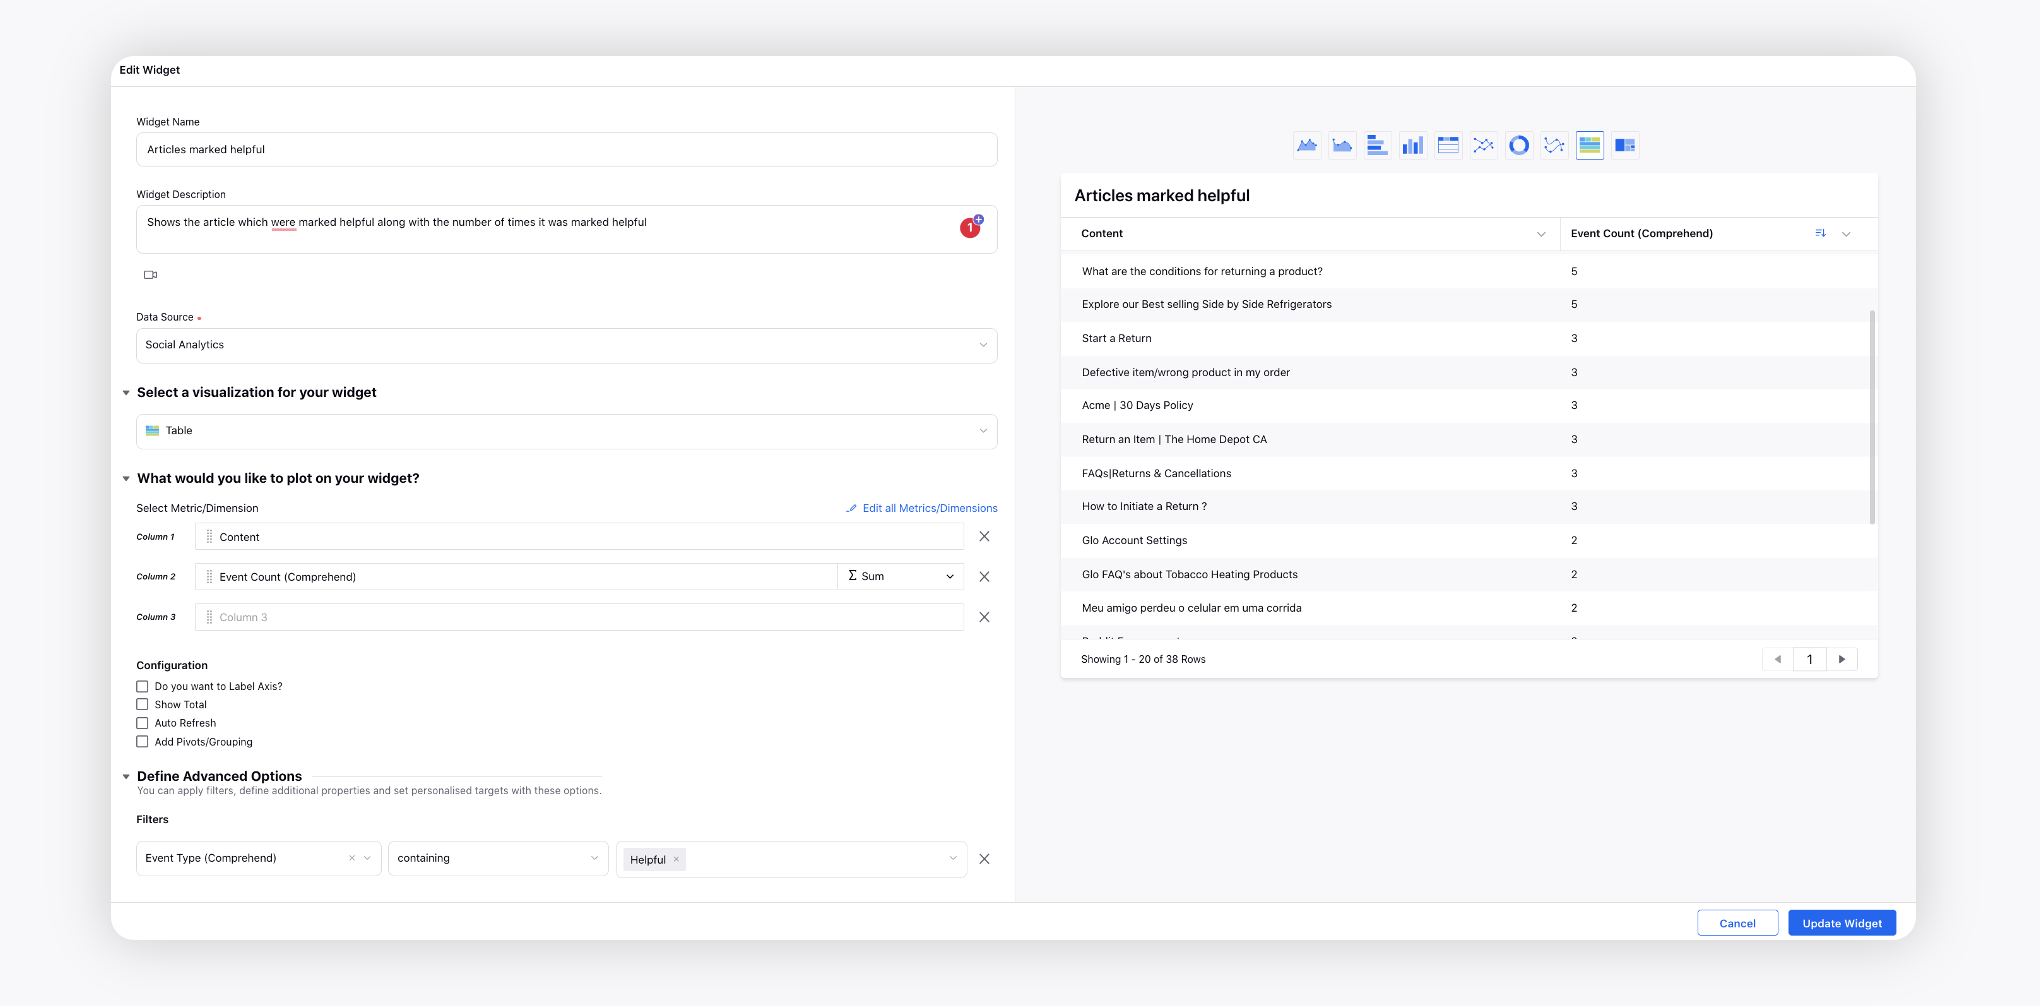
Articles marked Not helpful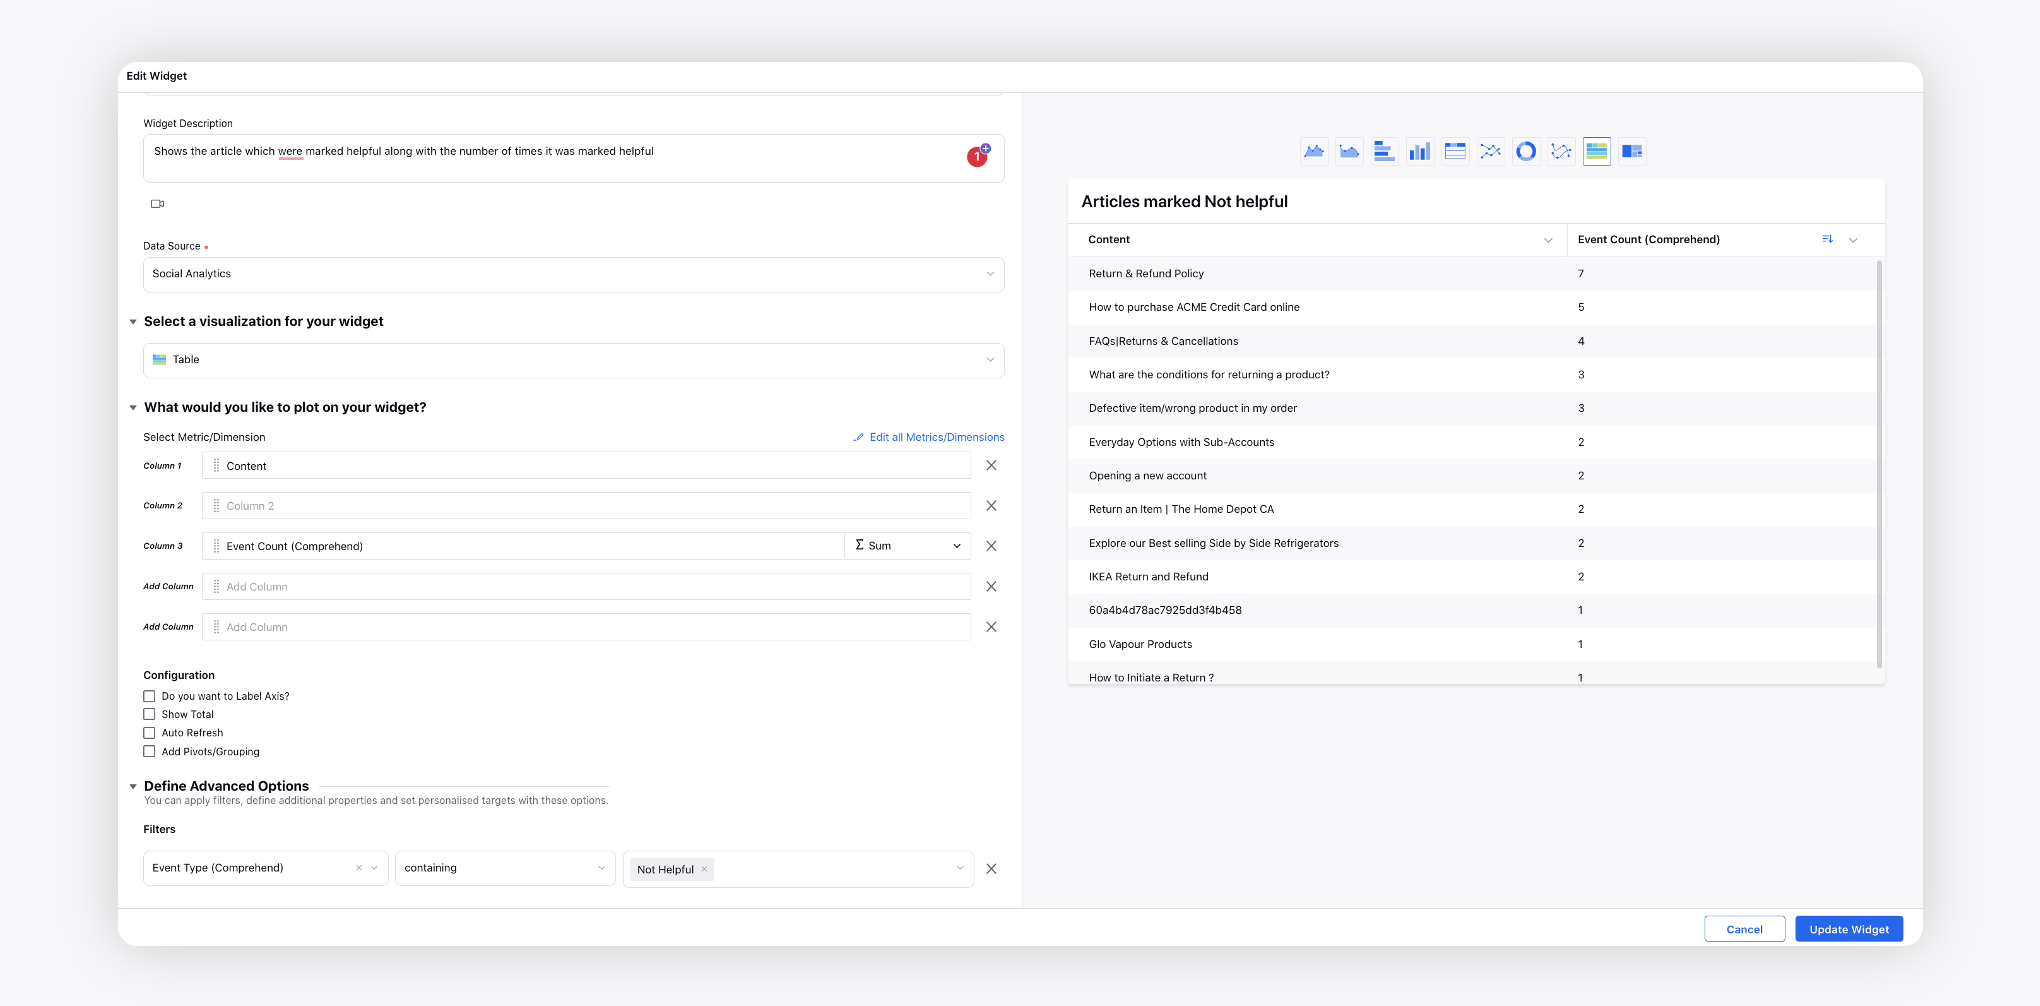
Not Helpful feedback breakdown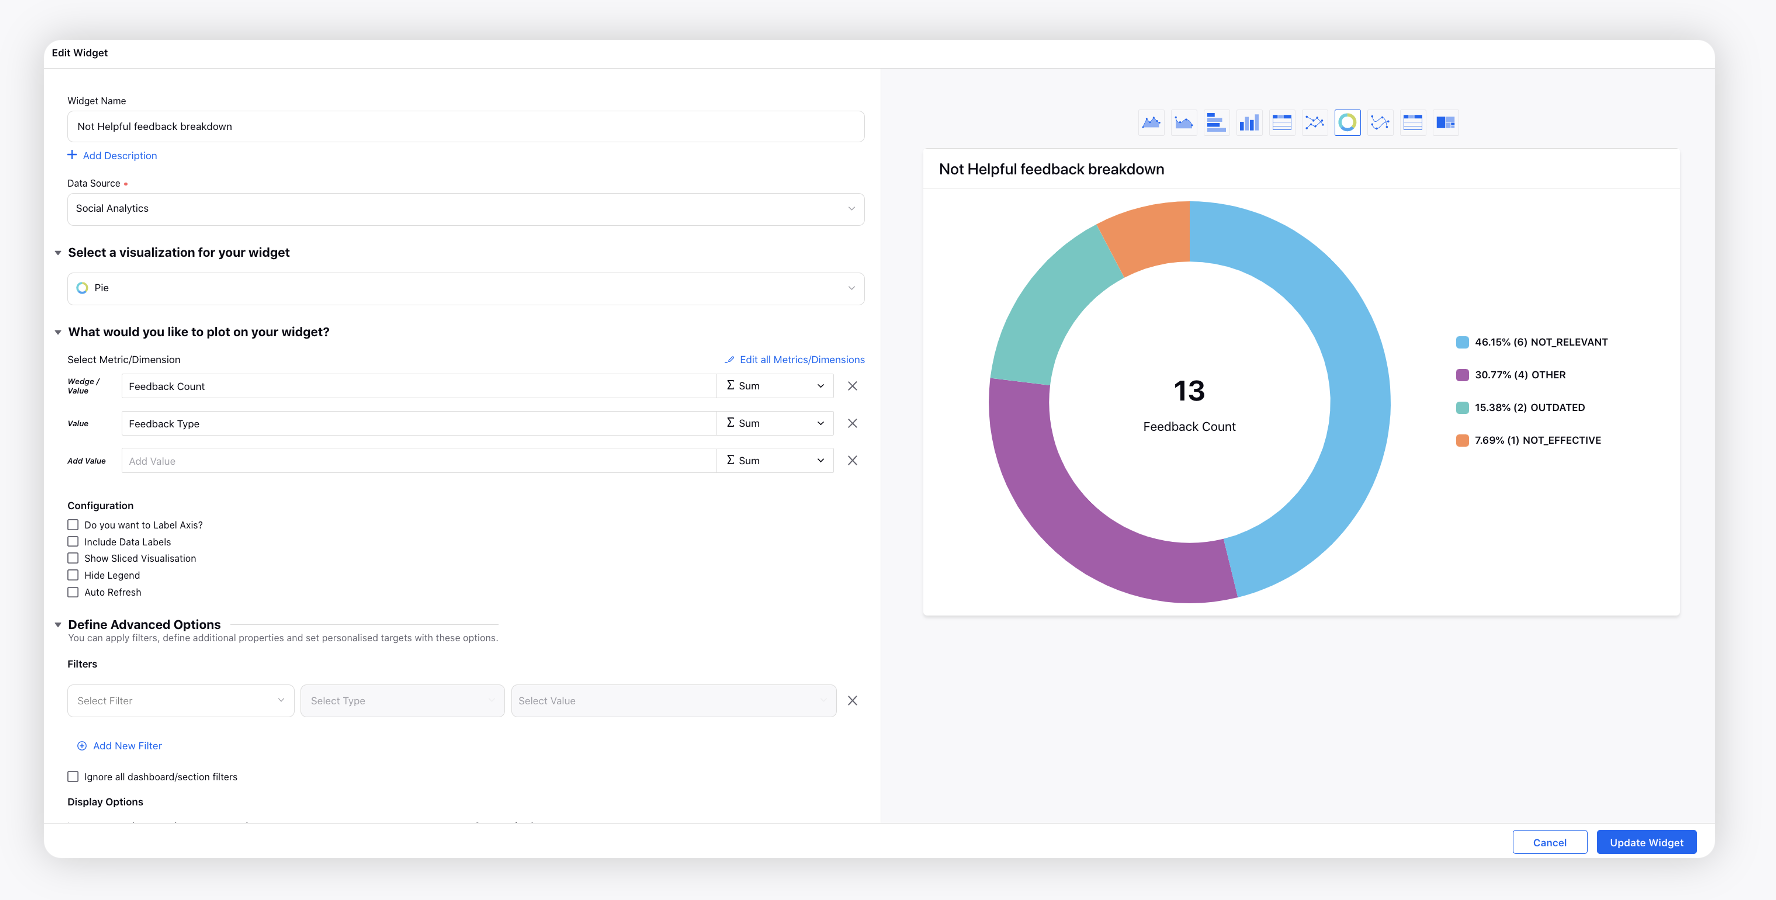
Feedback Received on Articles marked Not helpful
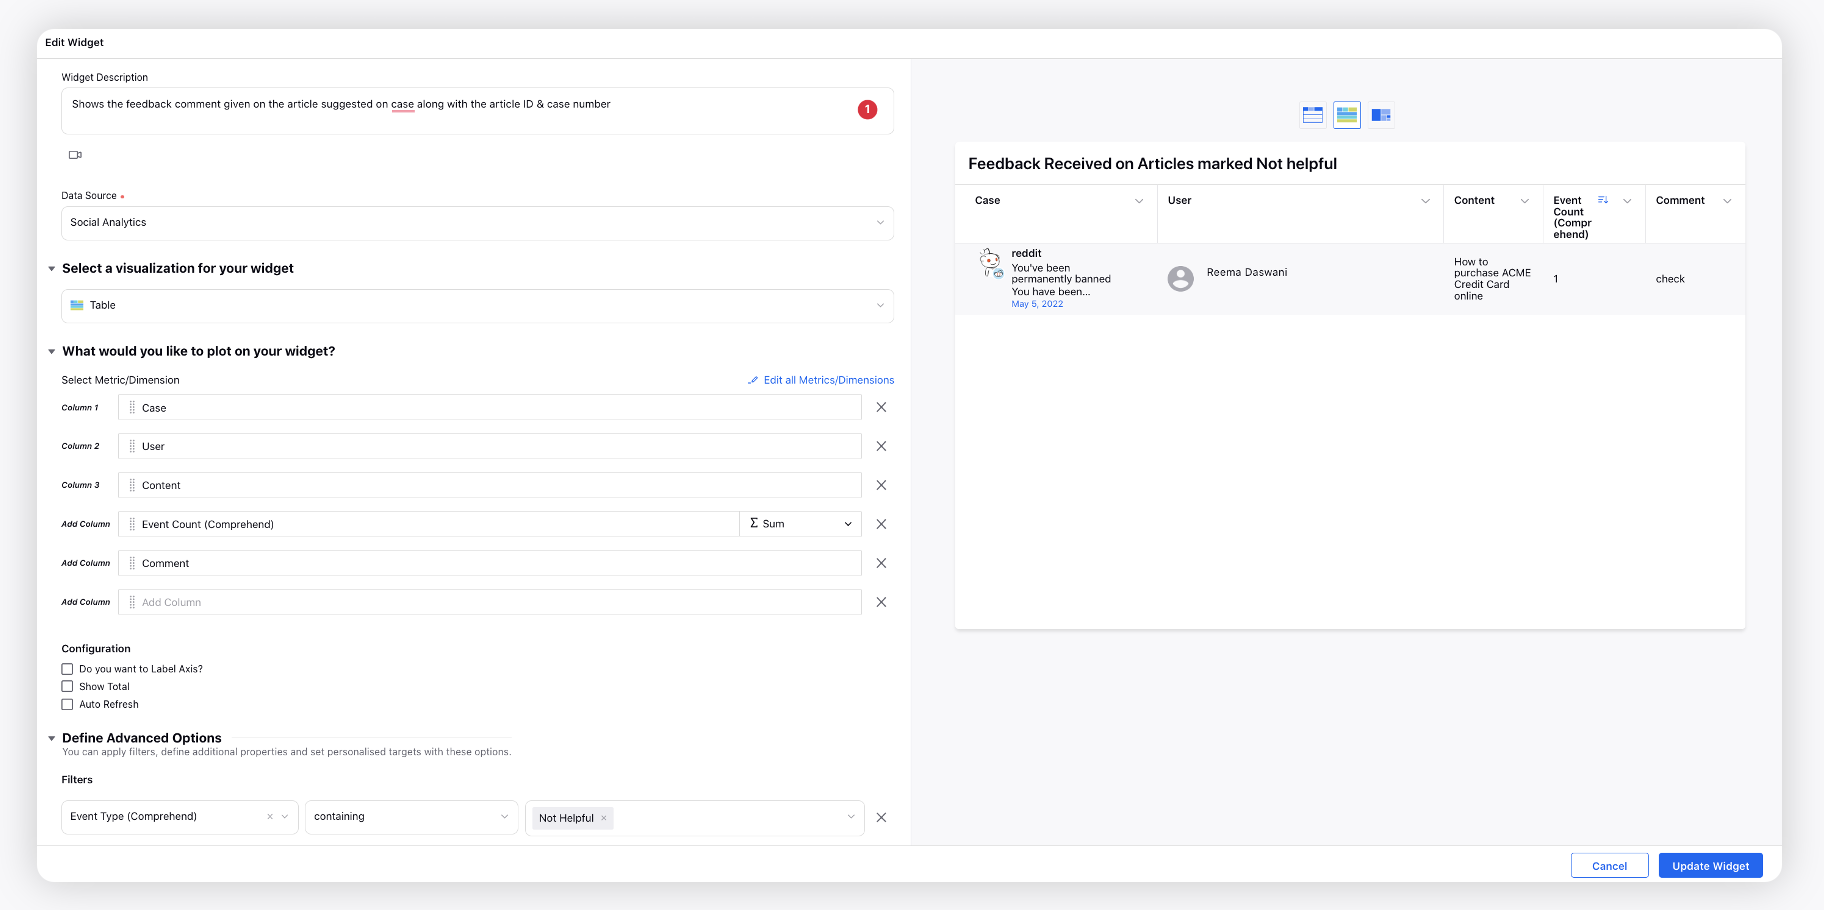
Feedback Type with Comments Recived on Articles
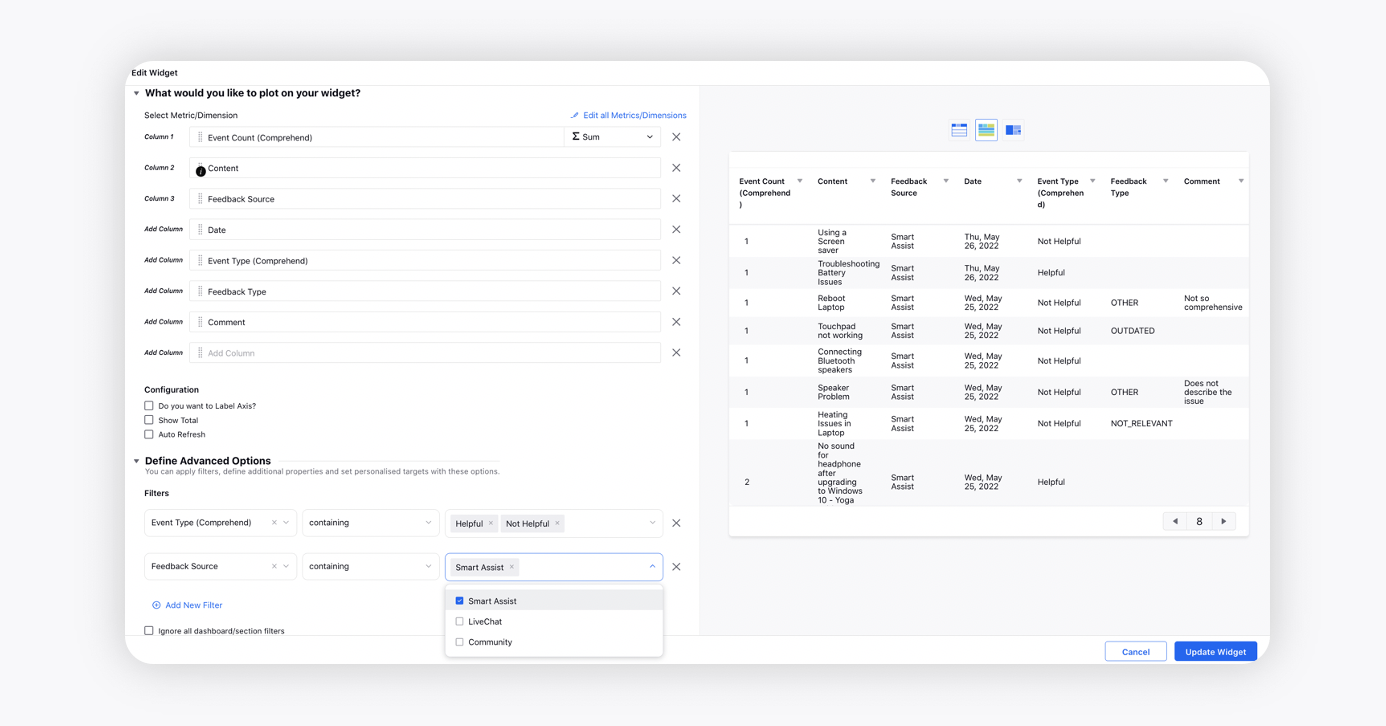
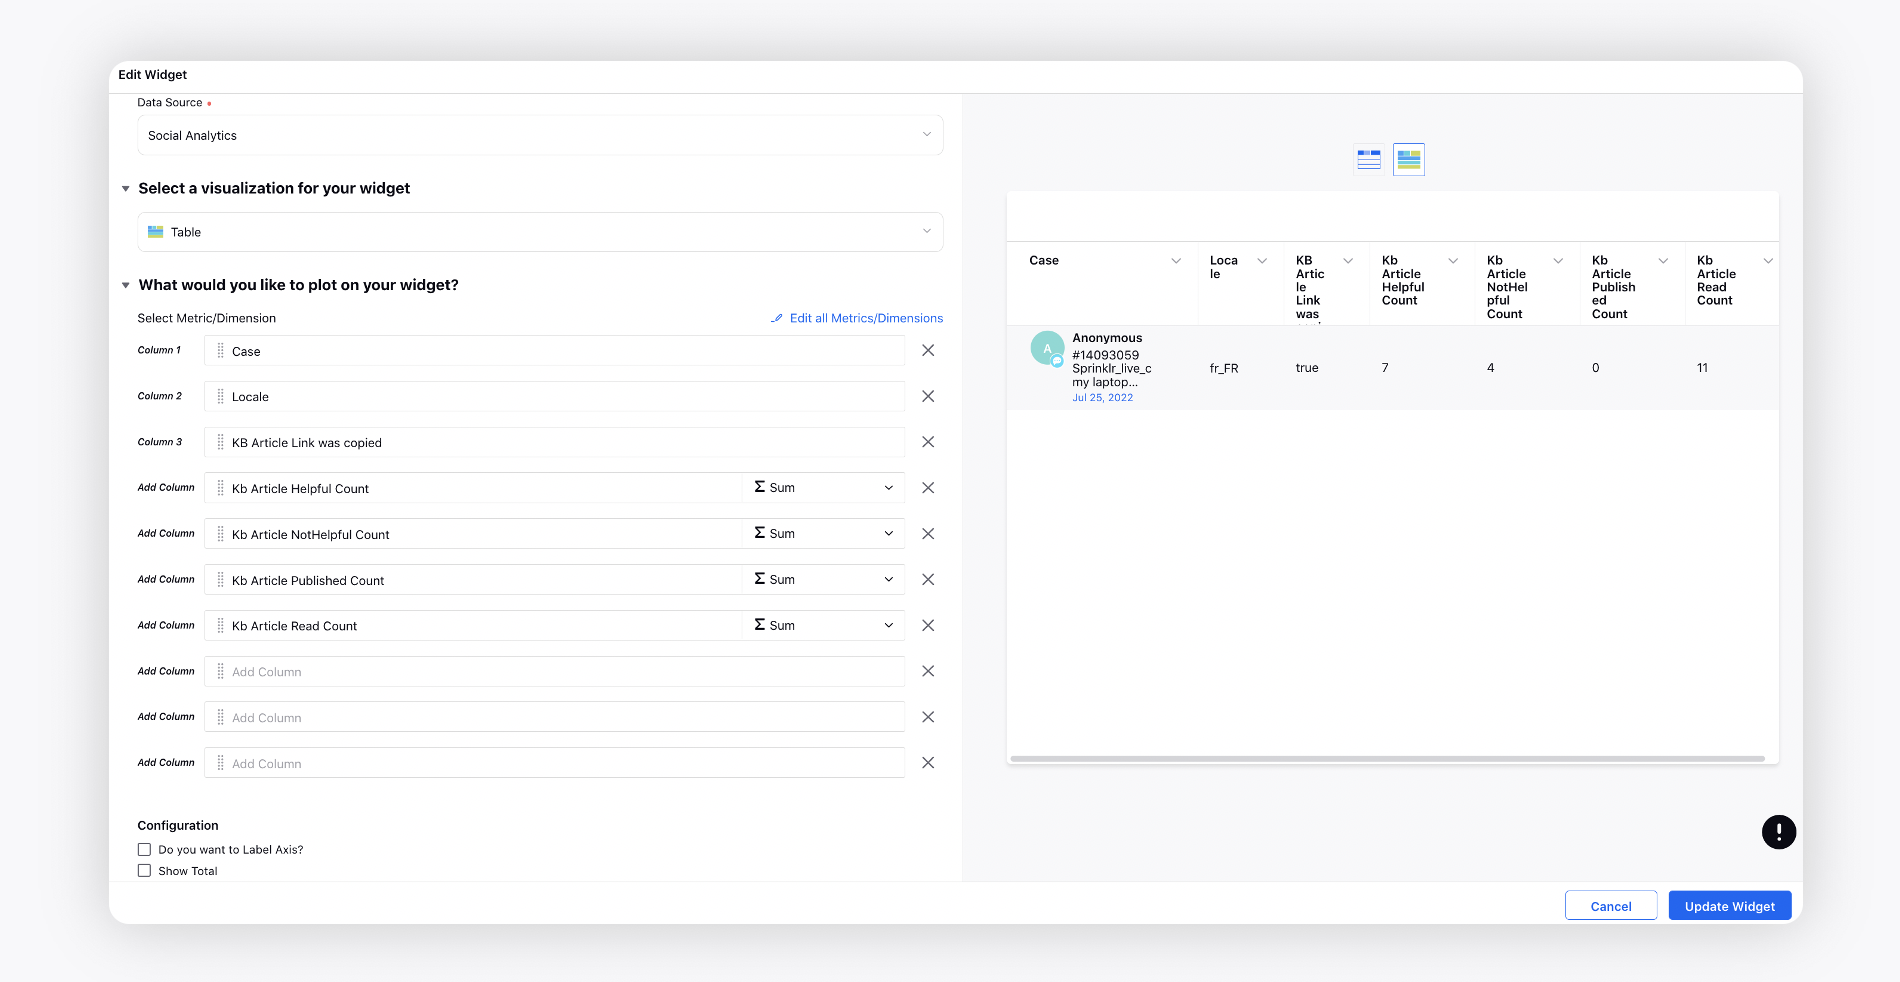
Reporting on language variations of an article
Enablement note: To enable reporting for articles based on the language, please work with your Success Manager. |
For Searches in Smart Assist
Use the following metrics and dimensions with the 'Table' visualization to create a Reporting Widget to track all searches made in Smart Assist by agents.
Metrics | Dimensions |
Event Count (Comprehend) | Clicked Contents |
Search Hits | Content |
Clicks On Search Results | - |
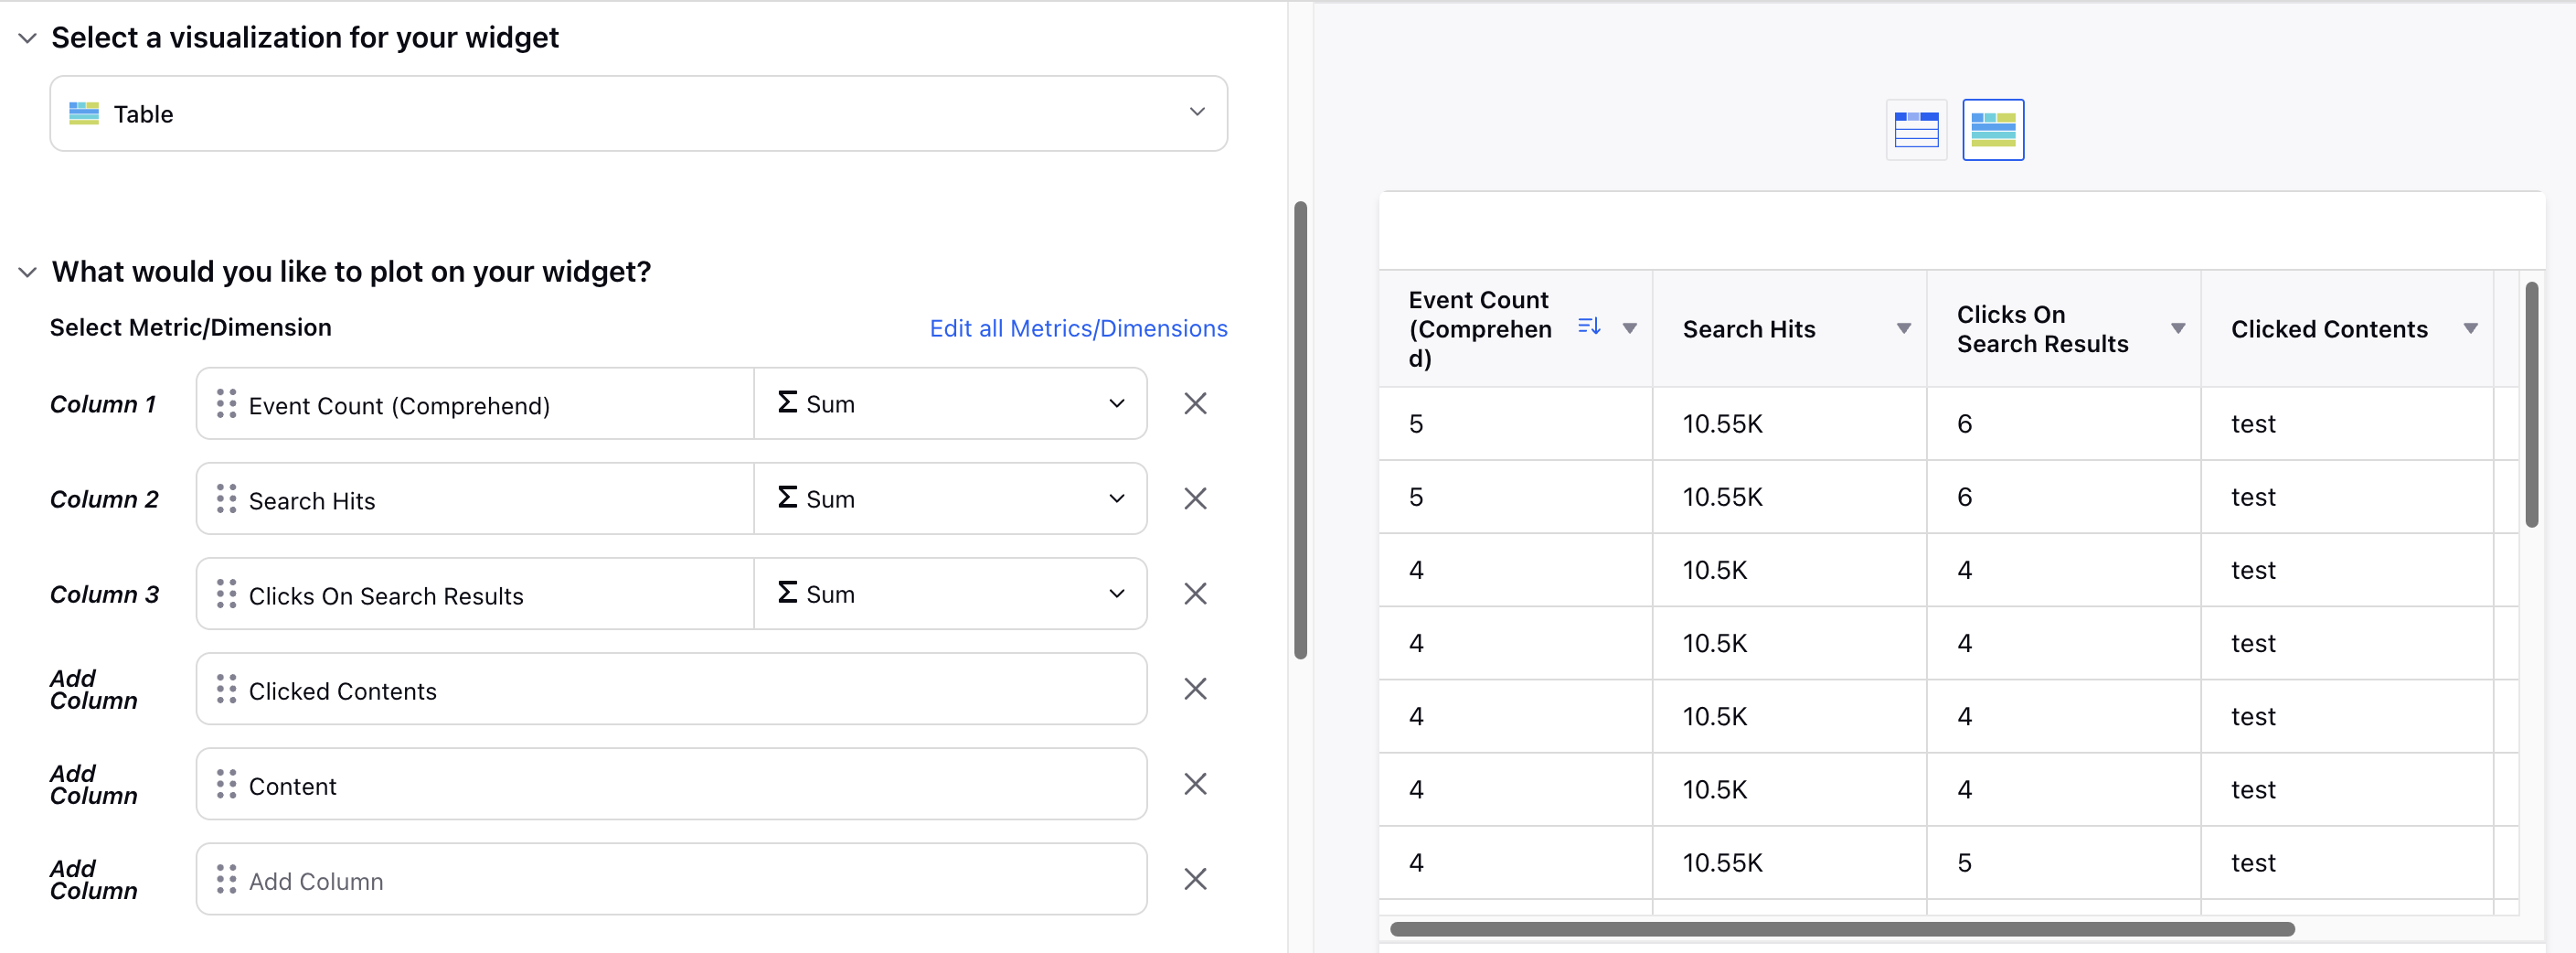
Event Count (Comprehend): This metric represents the total number of times a search query was executed.
Note: This metric must be used with the ‘Event Type’ filter set to “Search”.

For example, if agents searched for "customer support" 50 times in a day, the Event Count for "customer support" would be 50.
Search Hits: This metric indicates the total number of results returned for a search query. If the search hits are 0, it means no results were found for that query. When aggregated, this metric can provide the total number of search hits or the average number of search hits per query.
Note: If agents searched for "product manual" 5 times and each search returned 10 results, the total Search Hits would be 50 when the “Sum” operator is selected.
If agents searched for "product manual" 5 times and the total Search Hits was 50, the average Search Hits per query would be 10 when the “Average” operator is selected.
Clicks On Search Results: This metric tracks the number of times agents click on an article from the search results. When aggregated, this metric can provide the total or average number of clicks per search query.
Note: If agents clicked on articles 30 times after searching for "installation guide," the total Clicks on Search Result for that query would be 30 when the “Sum” operator is selected.
If agents searched for "installation guide" 10 times and the total Clicks on Search Result were 30, the average Clicks on Search Result per query would be 3 when the “Average” operator is selected.
Clicked Contents: This dimension provides a list of articles that were clicked on from the search results. For example, if agents searched for "troubleshooting" and clicked on three different articles titled "Troubleshooting Guide," "Common Issues," and "Fixes for Errors," the Clicked Content would list these three articles.
Content: This dimension provides a list of top 10 articles that were clicked on from the search result.
Content Management
Content Management
Total Articles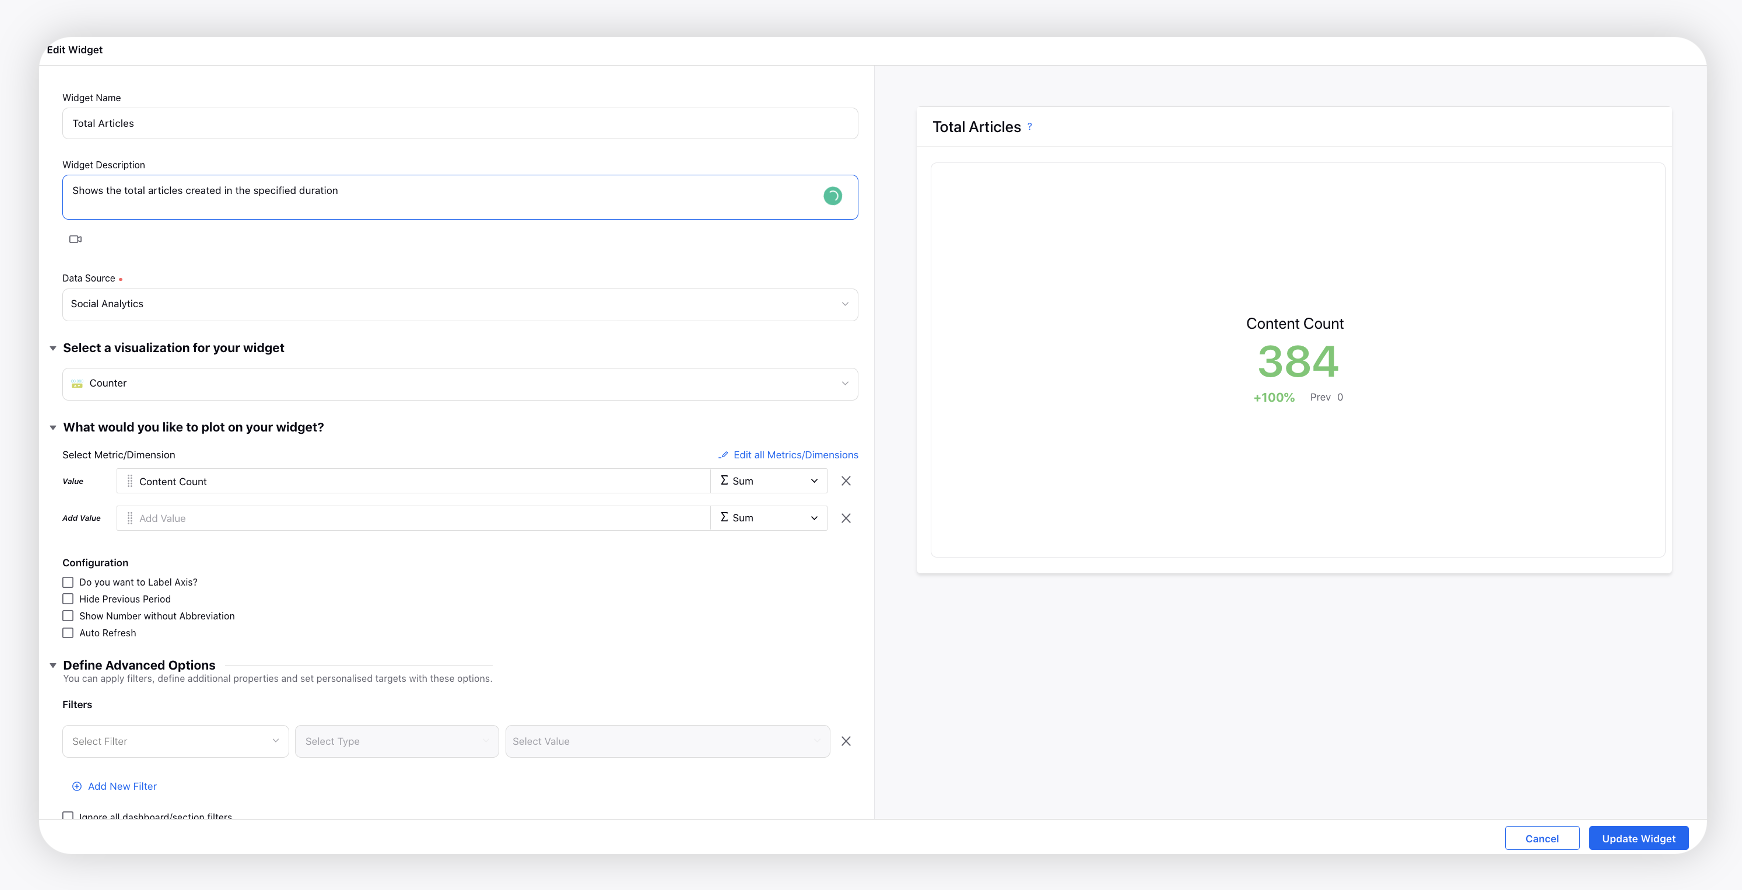
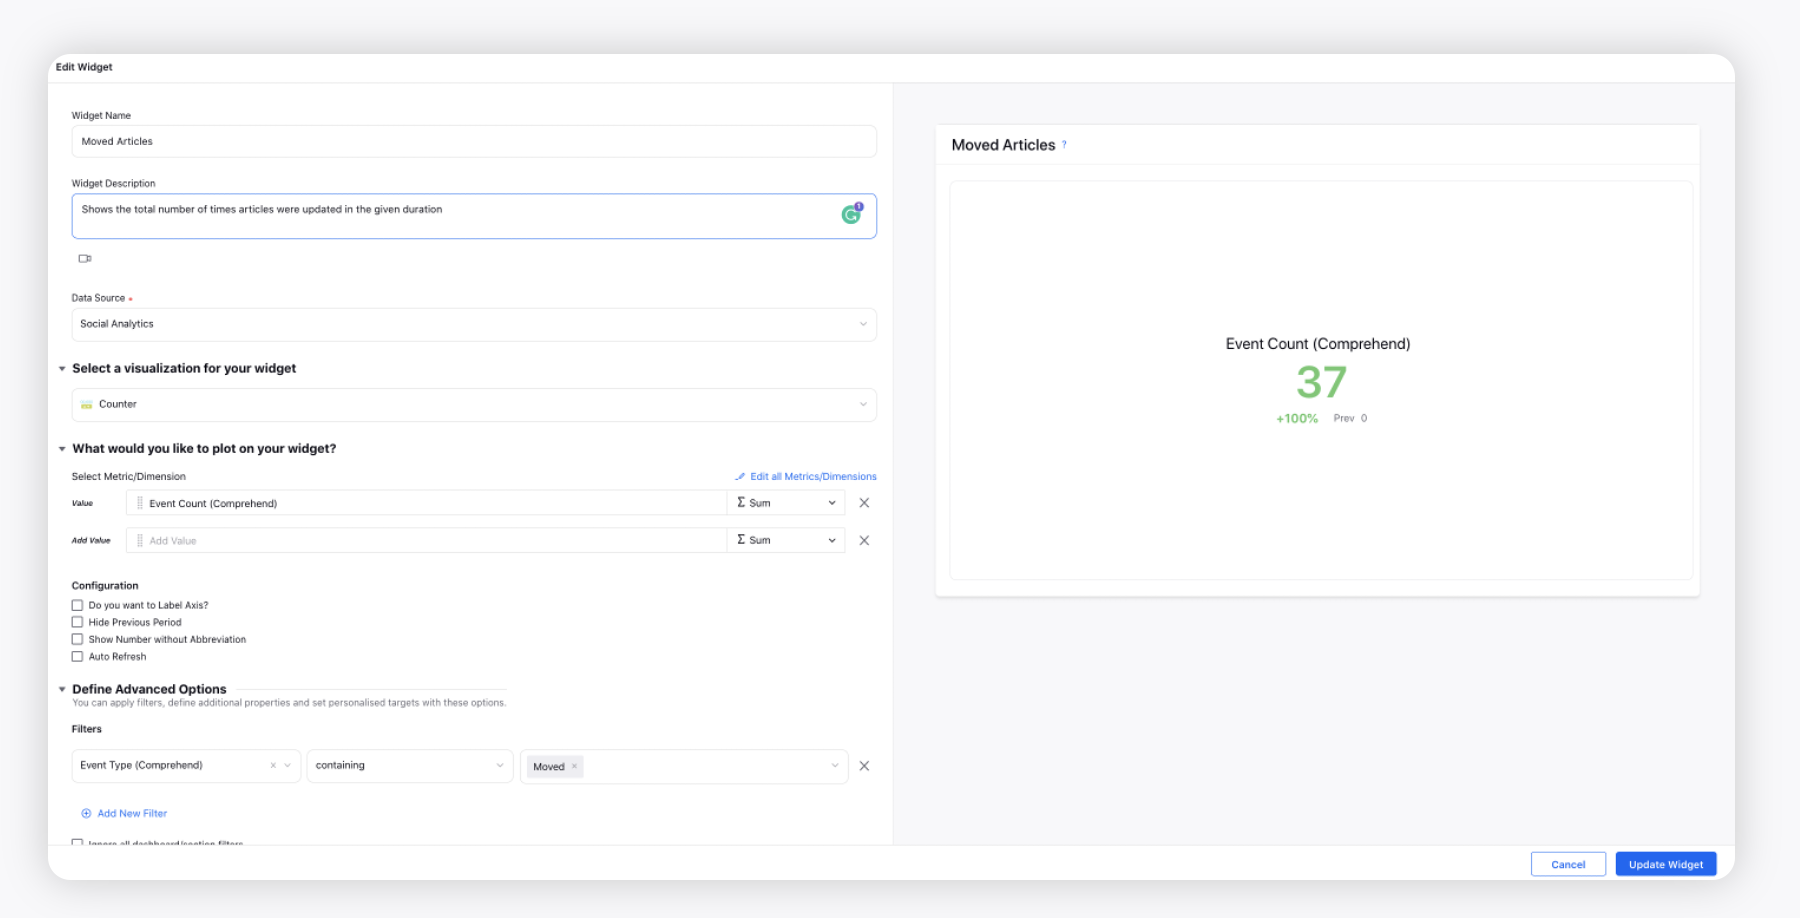
Moved Articles
Cloned Articles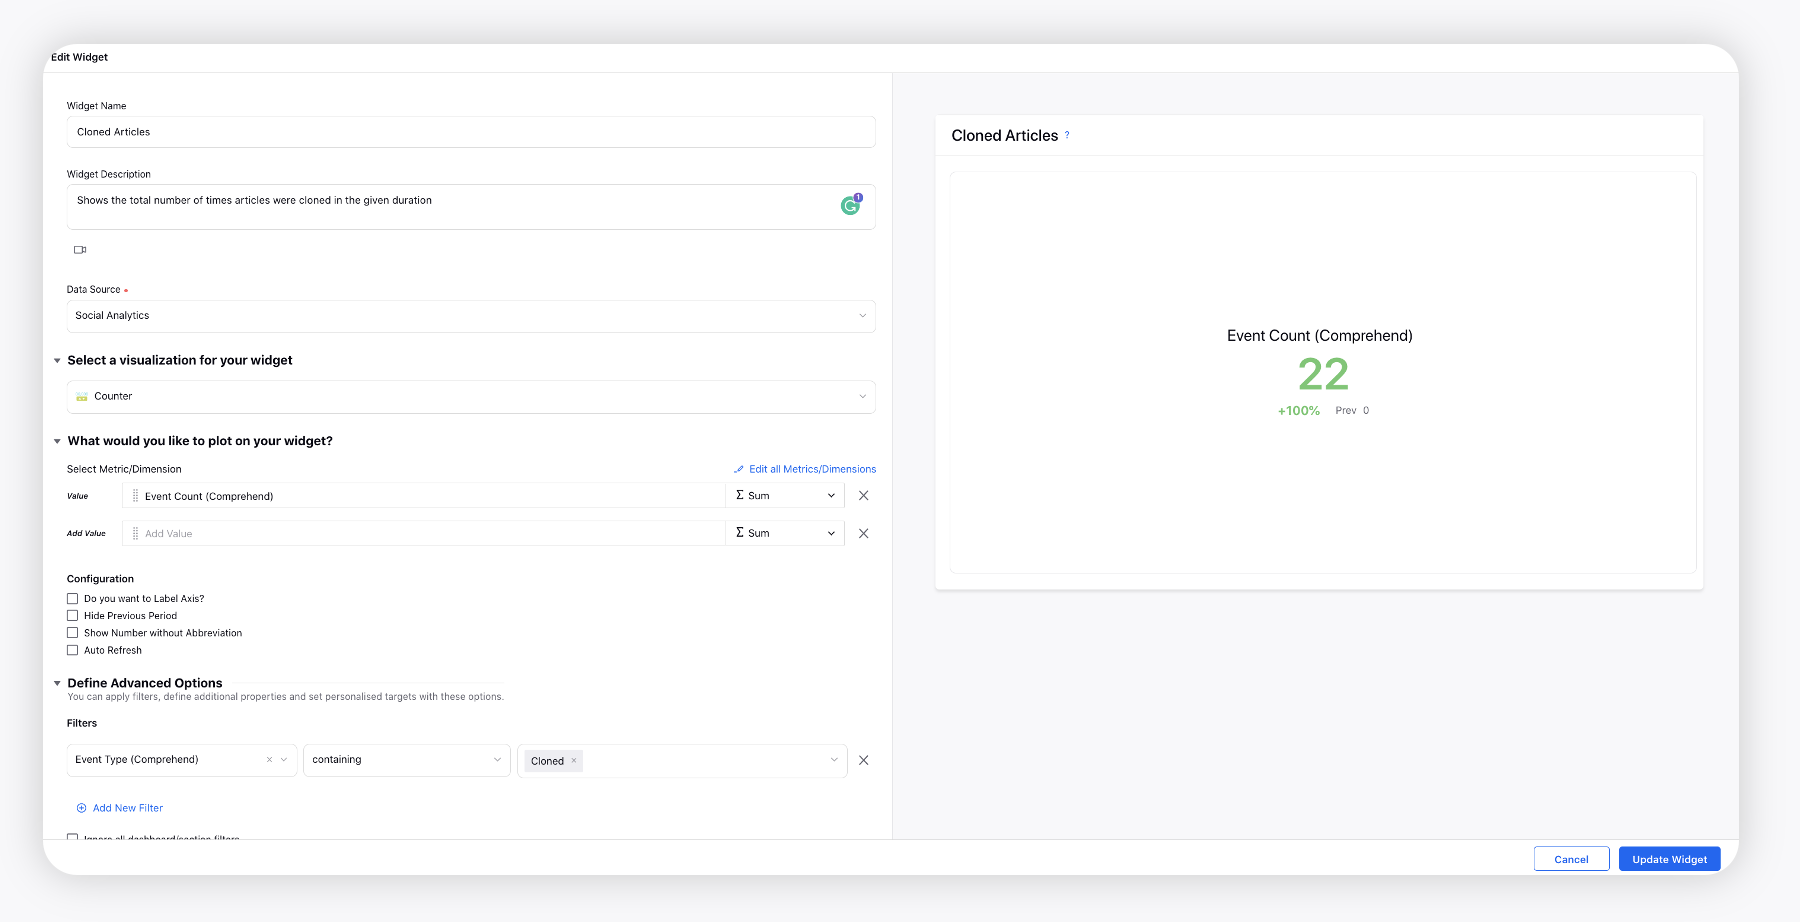
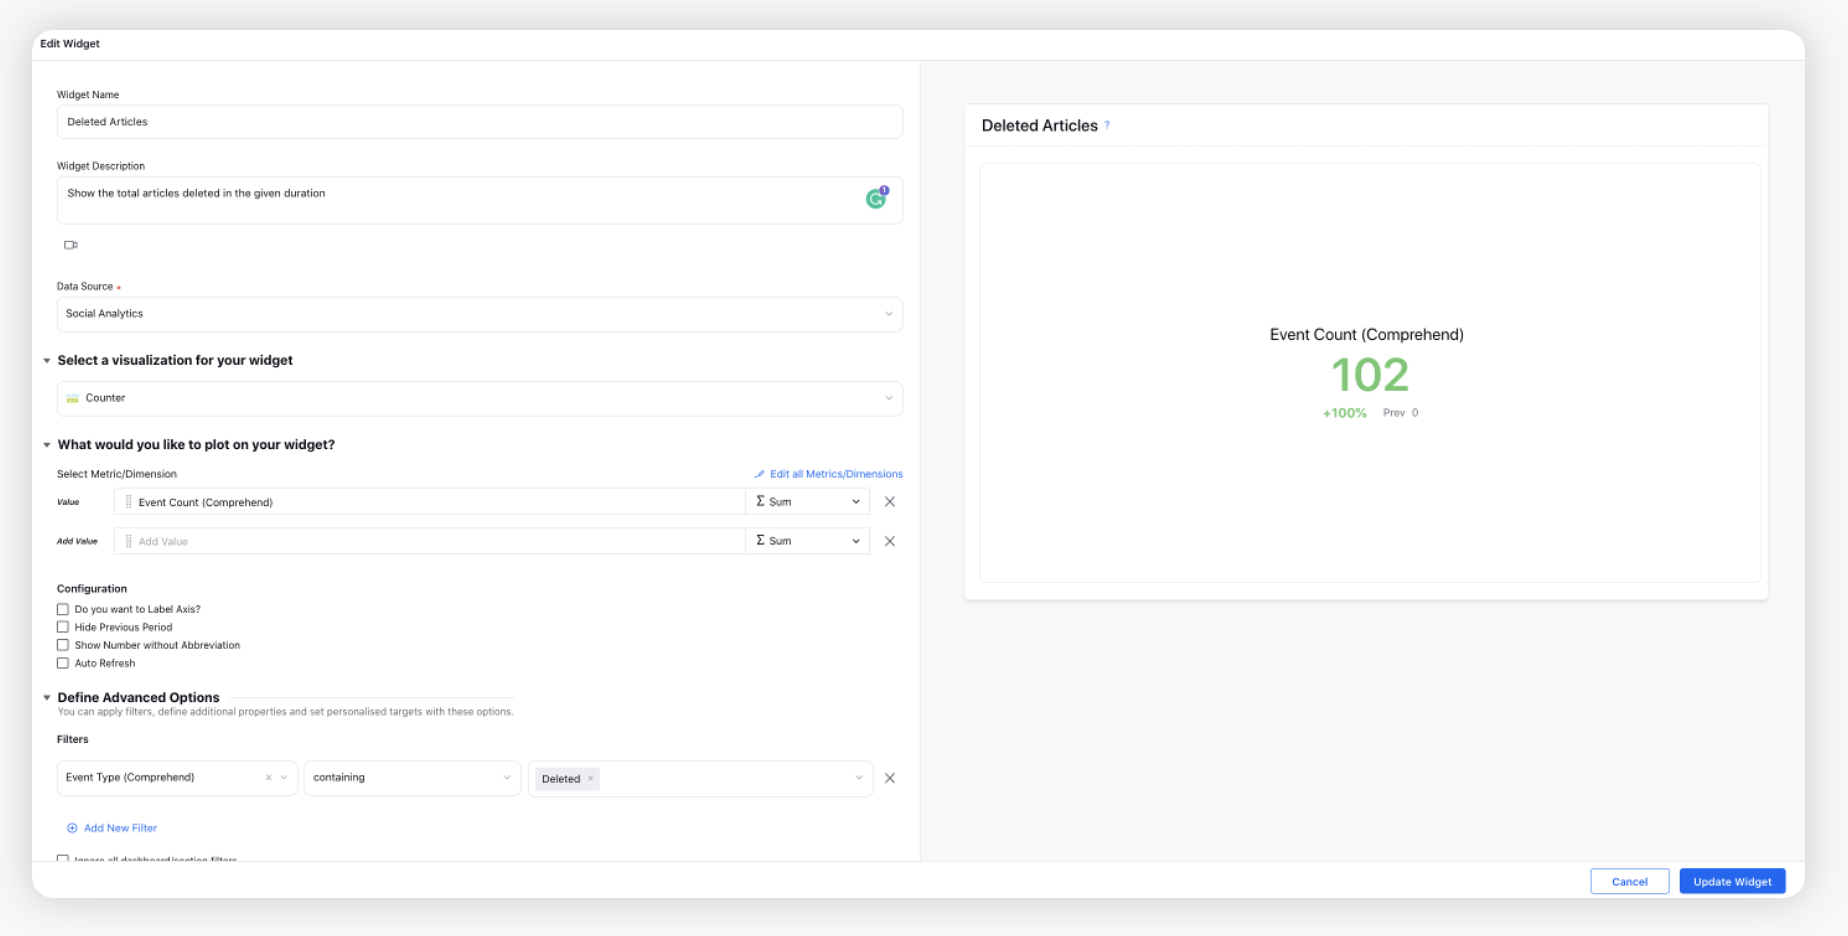
Deleted Articles
Content Updated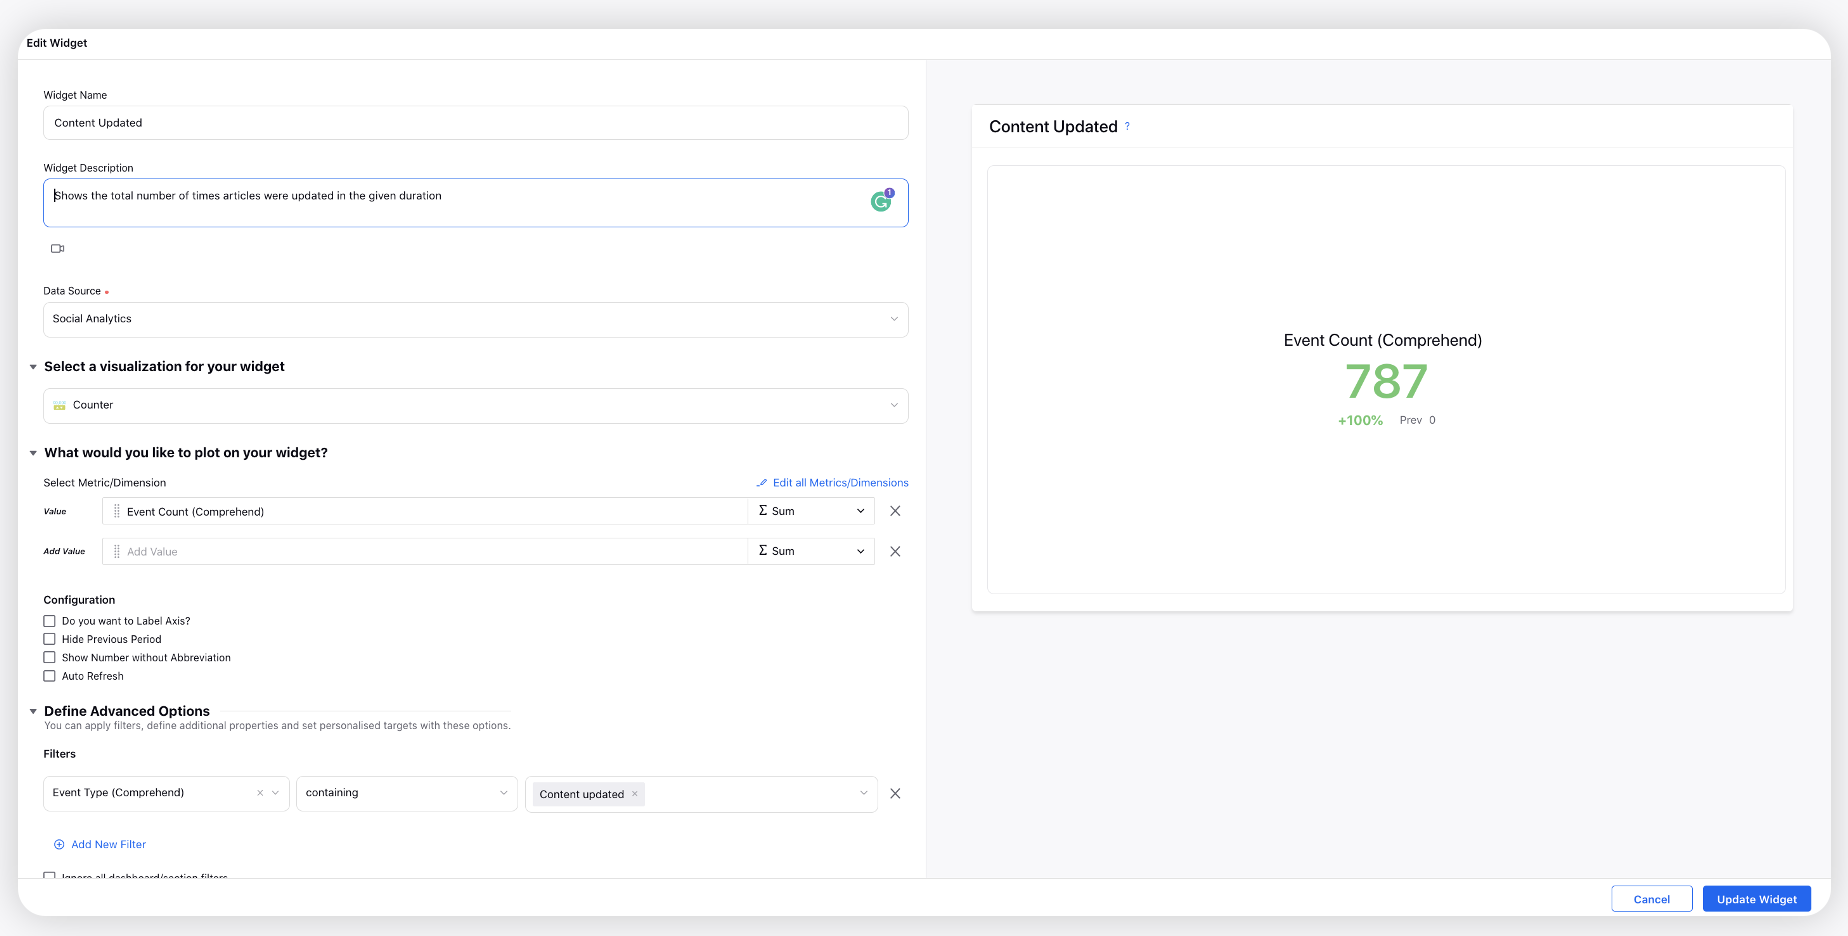
Tags Updated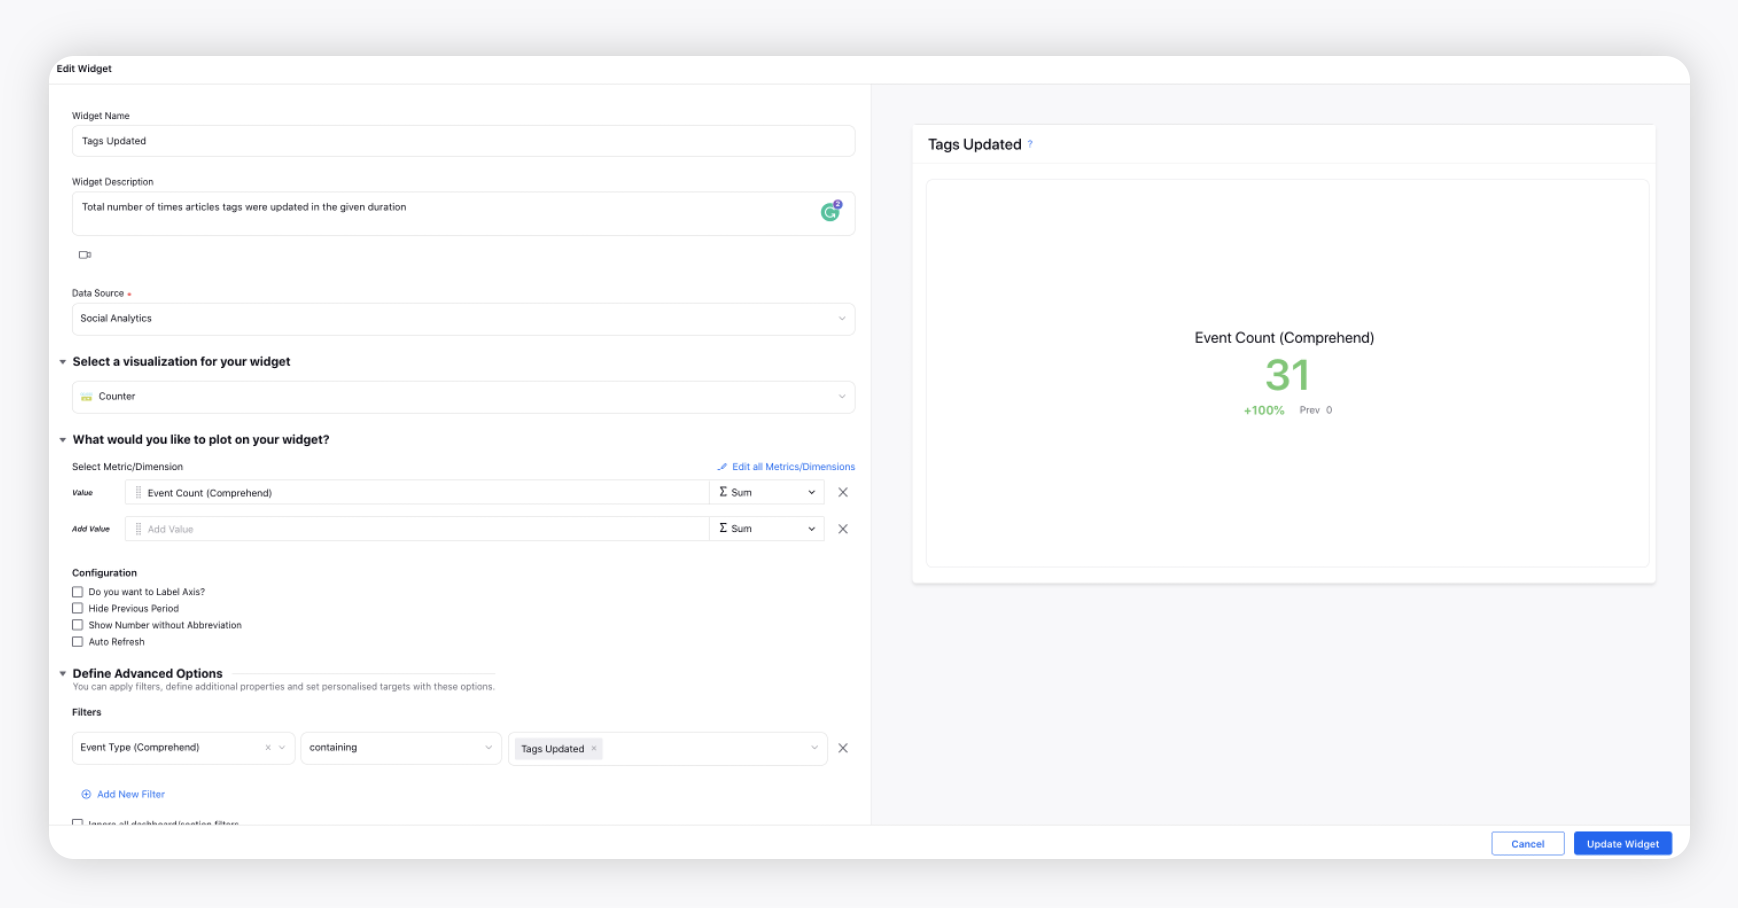
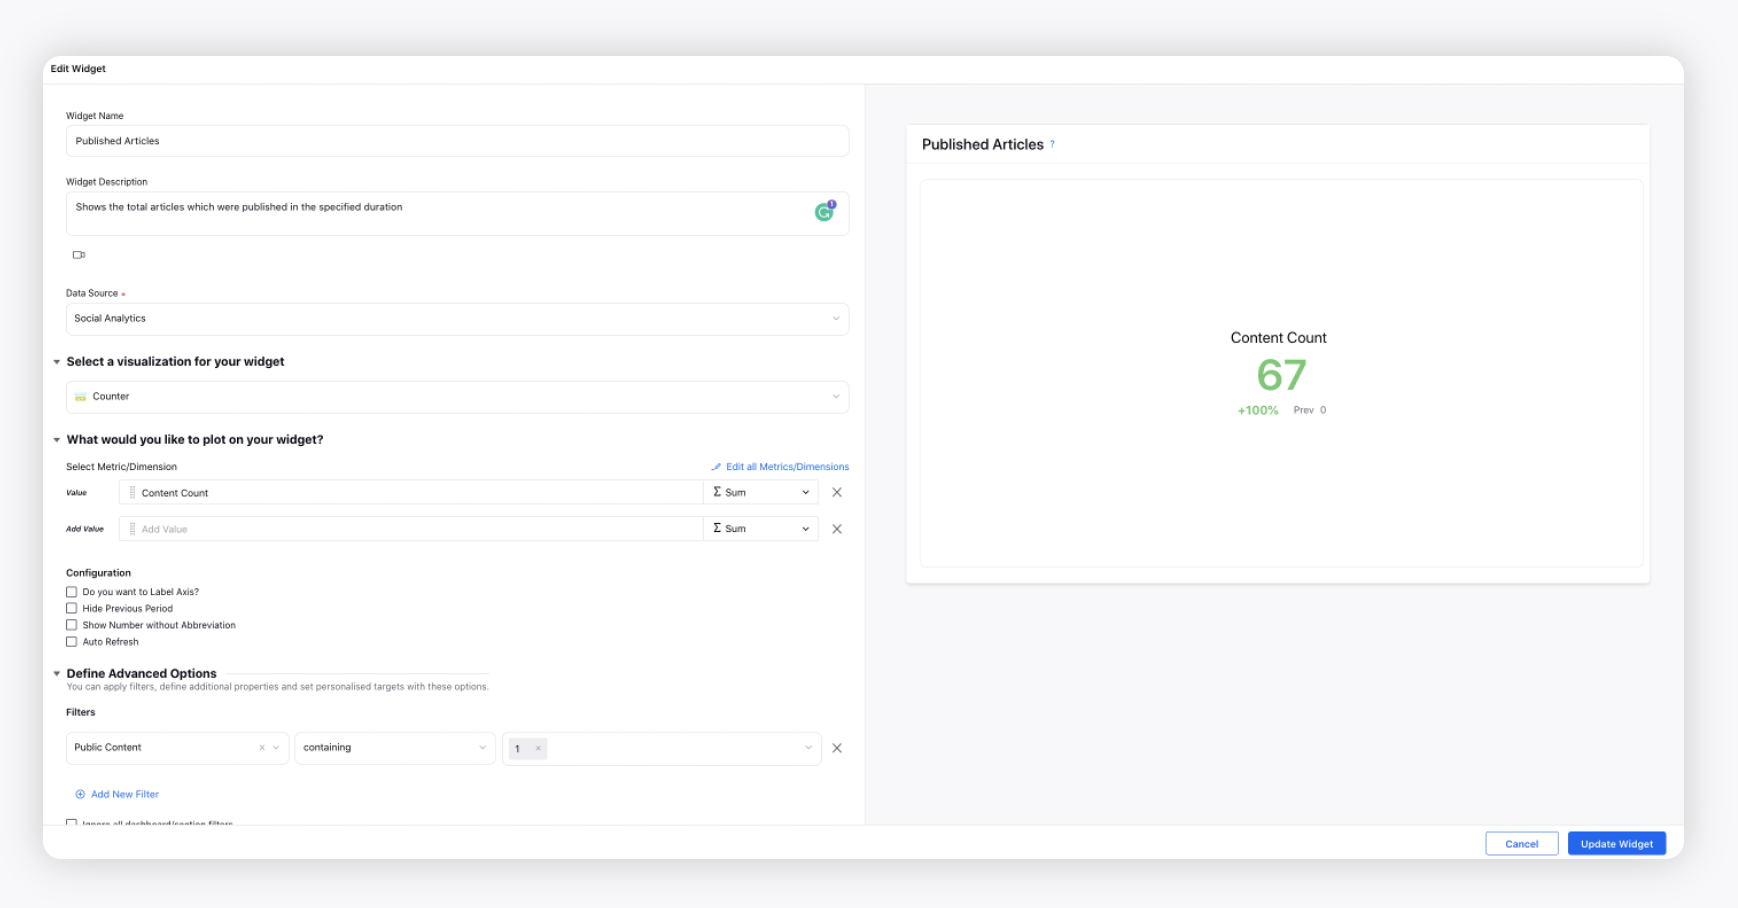
Published Articles
Article Count by Status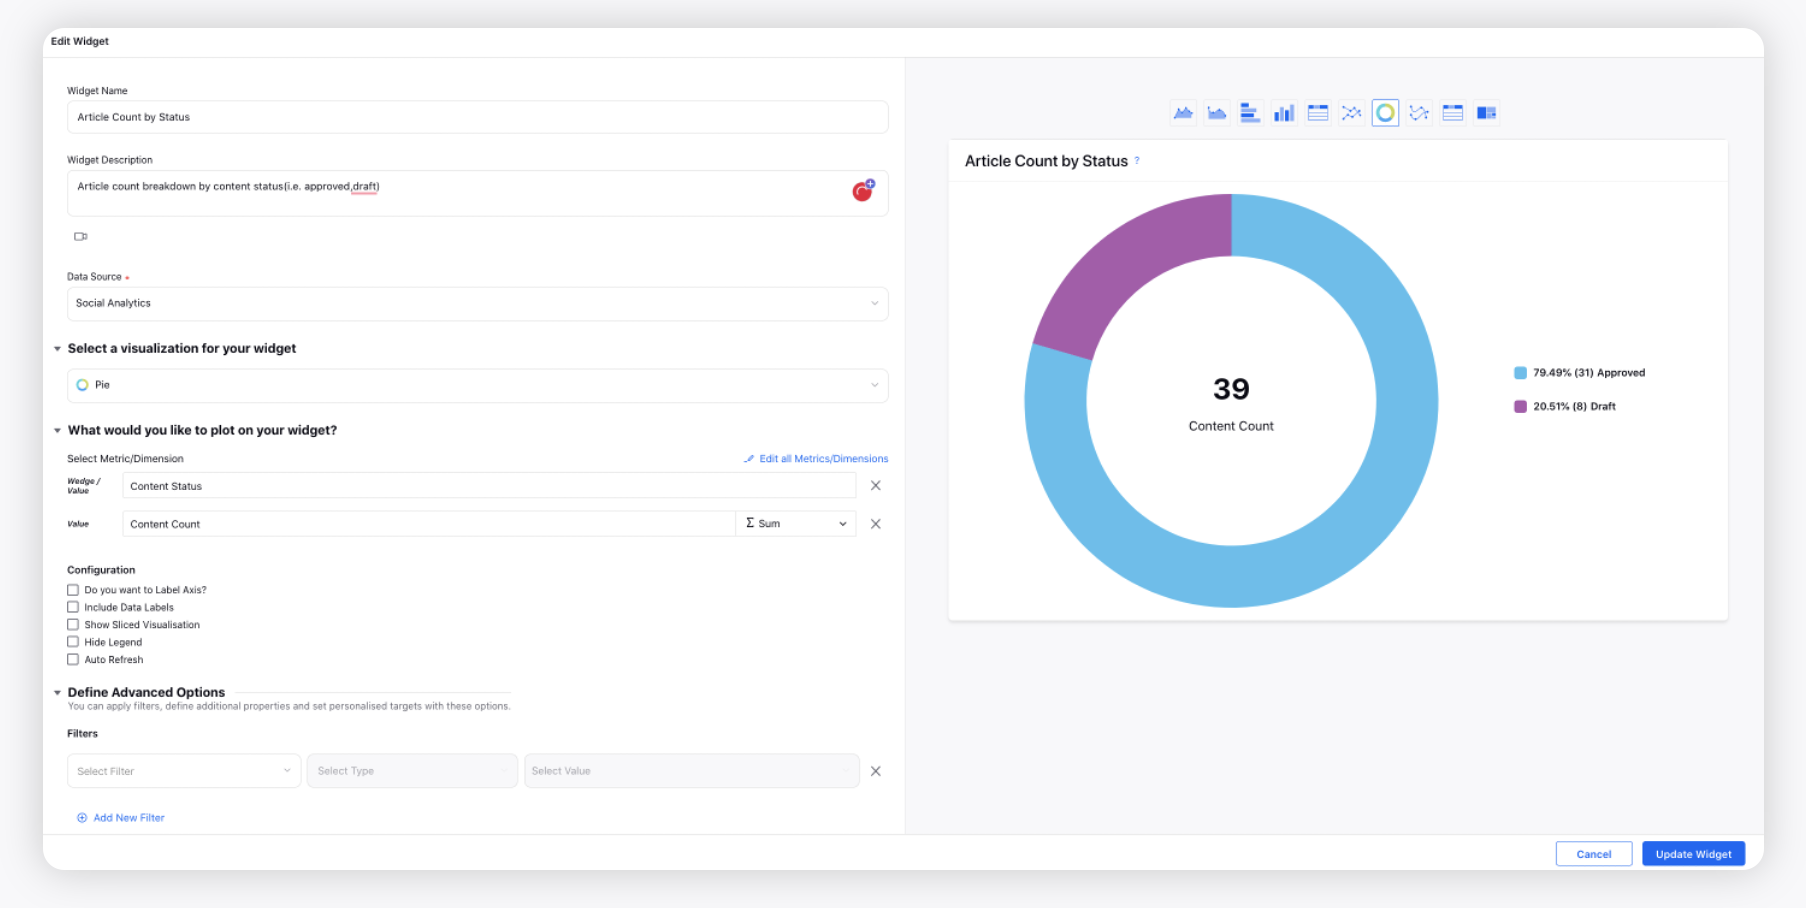
Article Count by Tags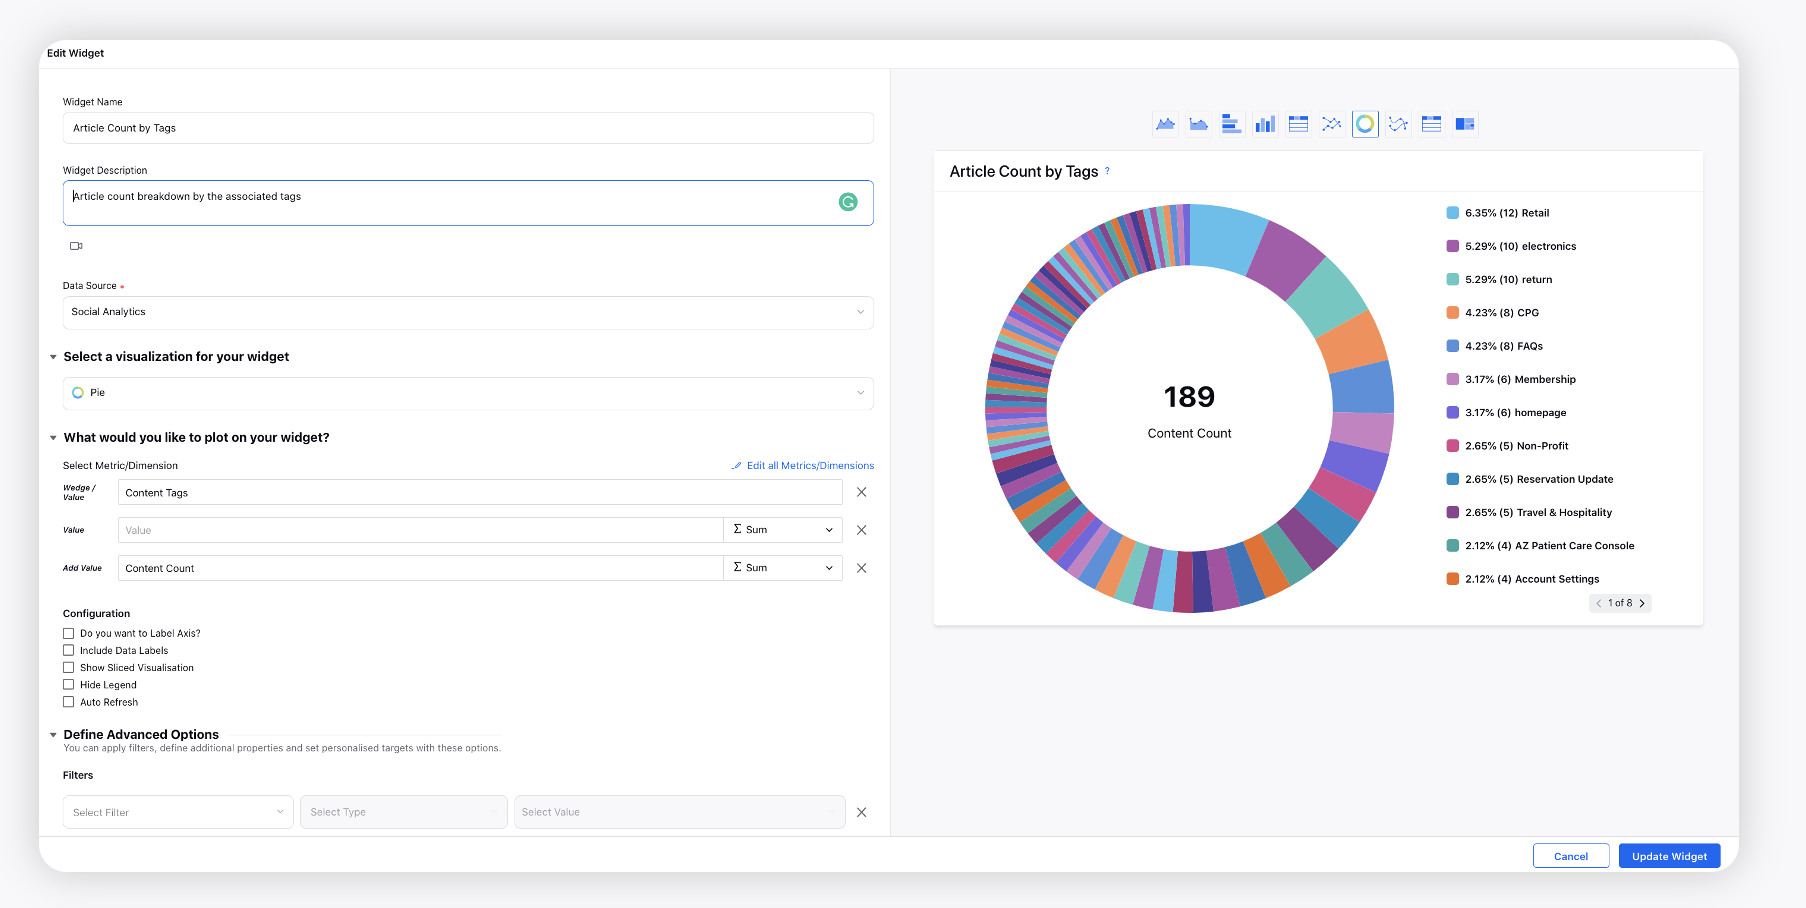
Article Count by Category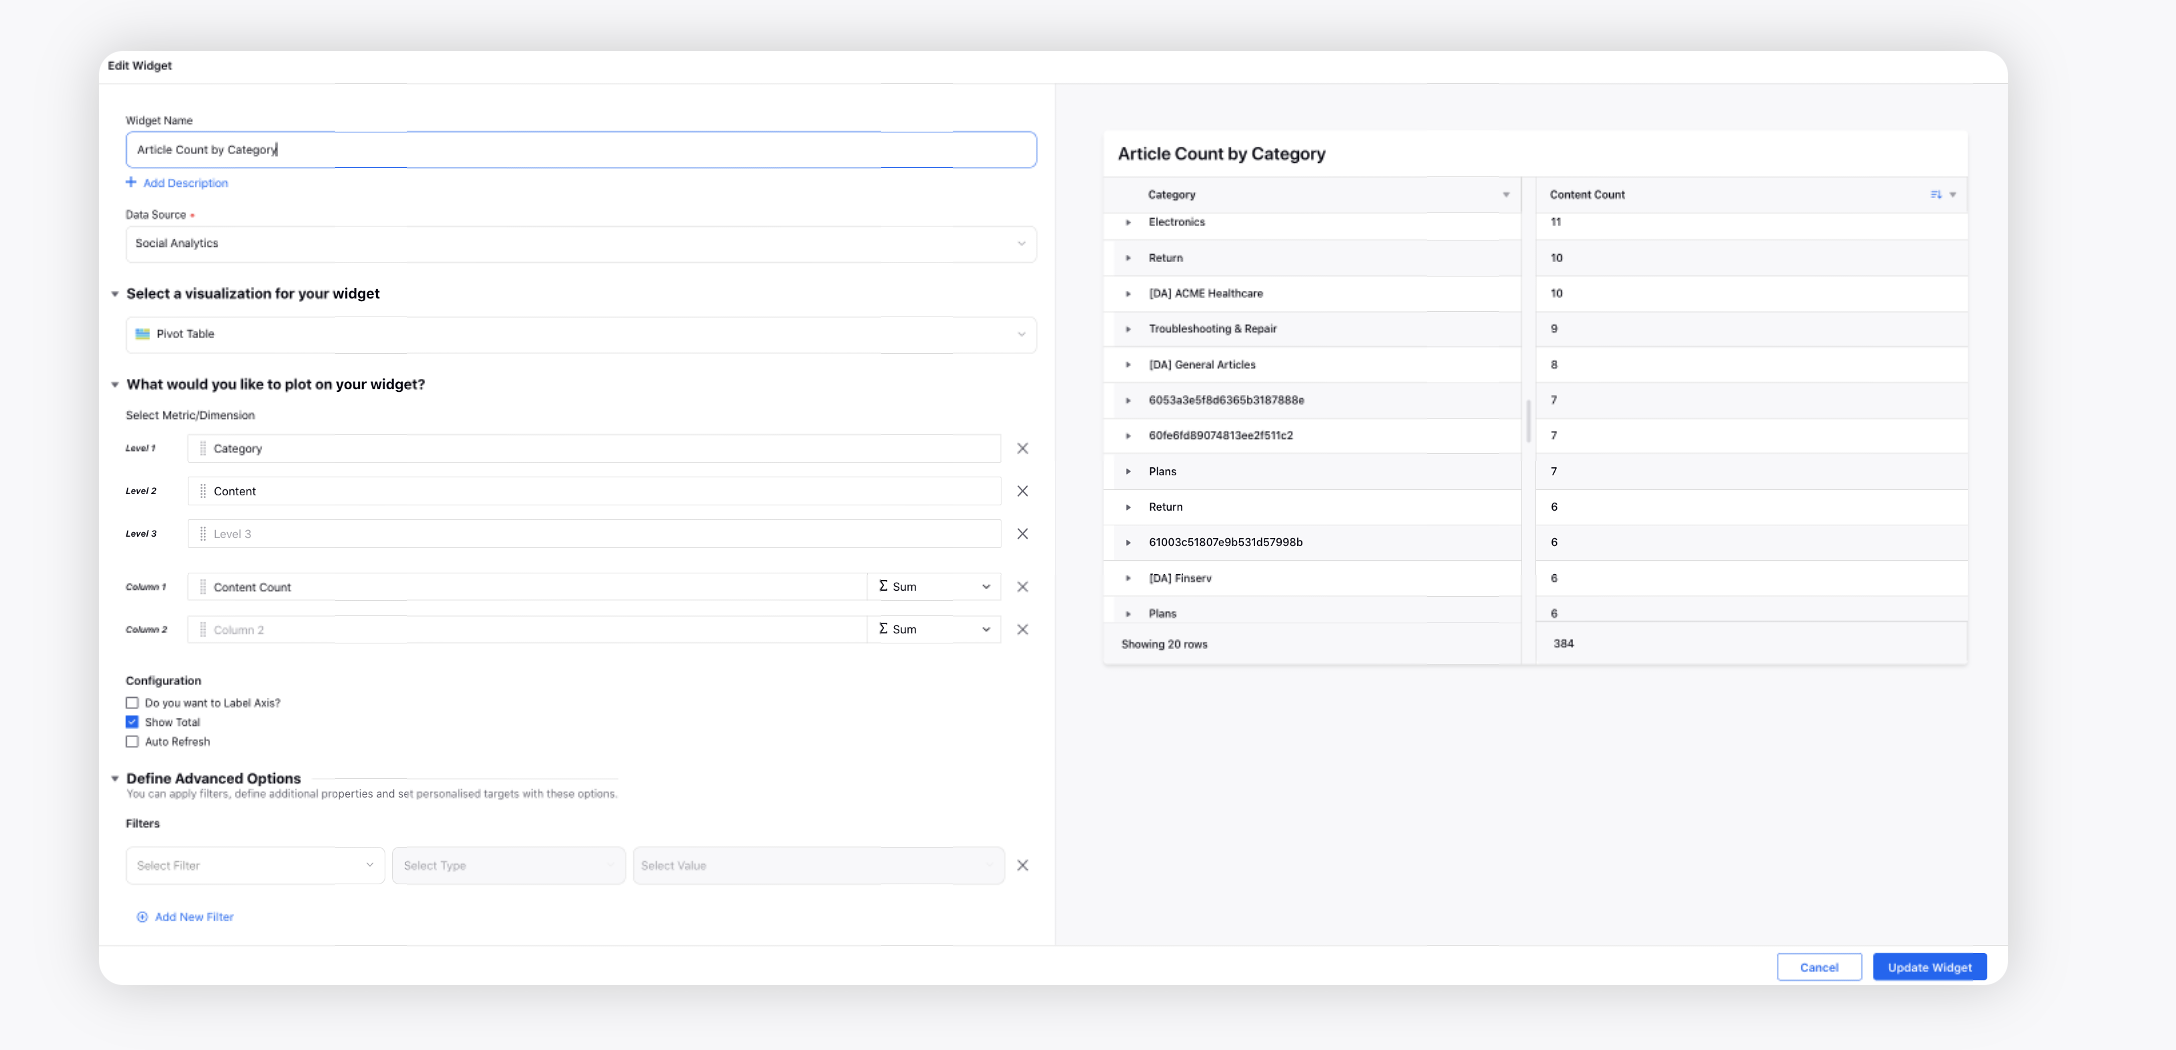
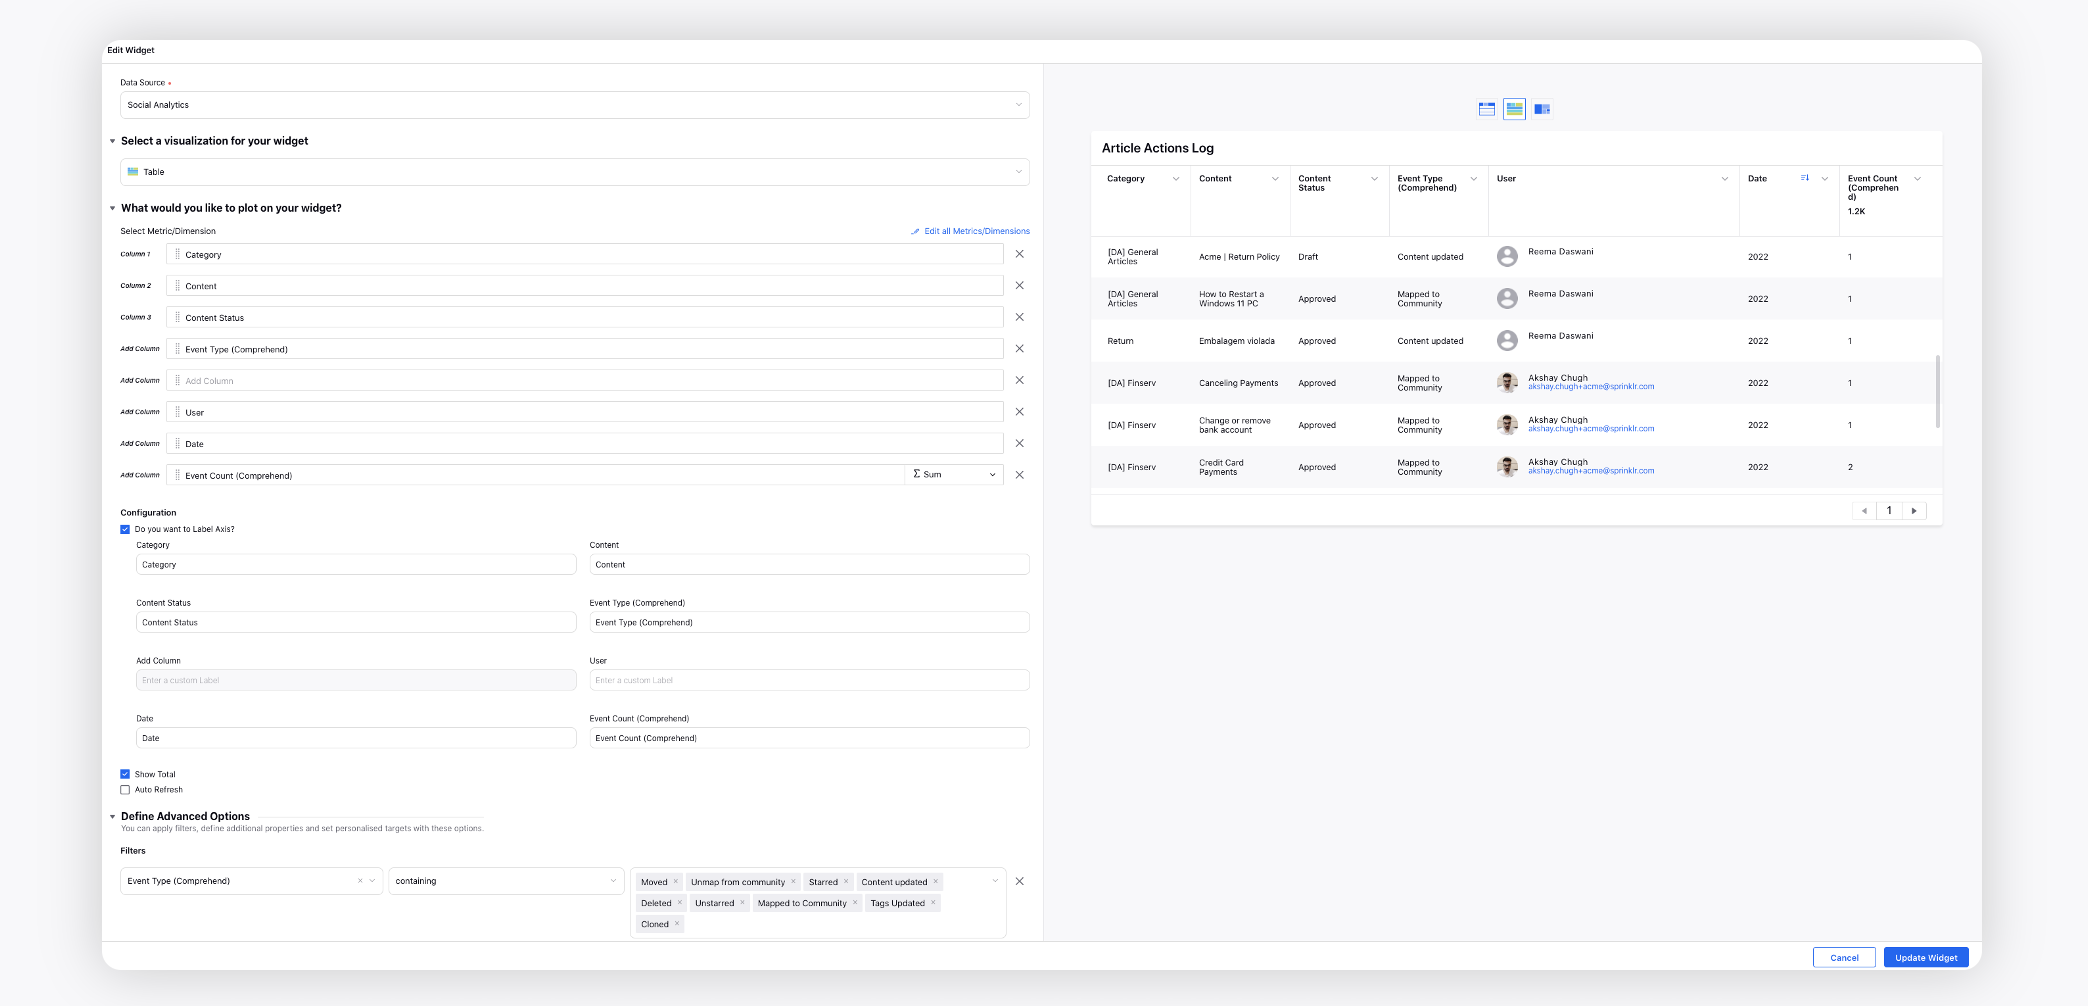
Article Actions Log
Keyword Search Filter
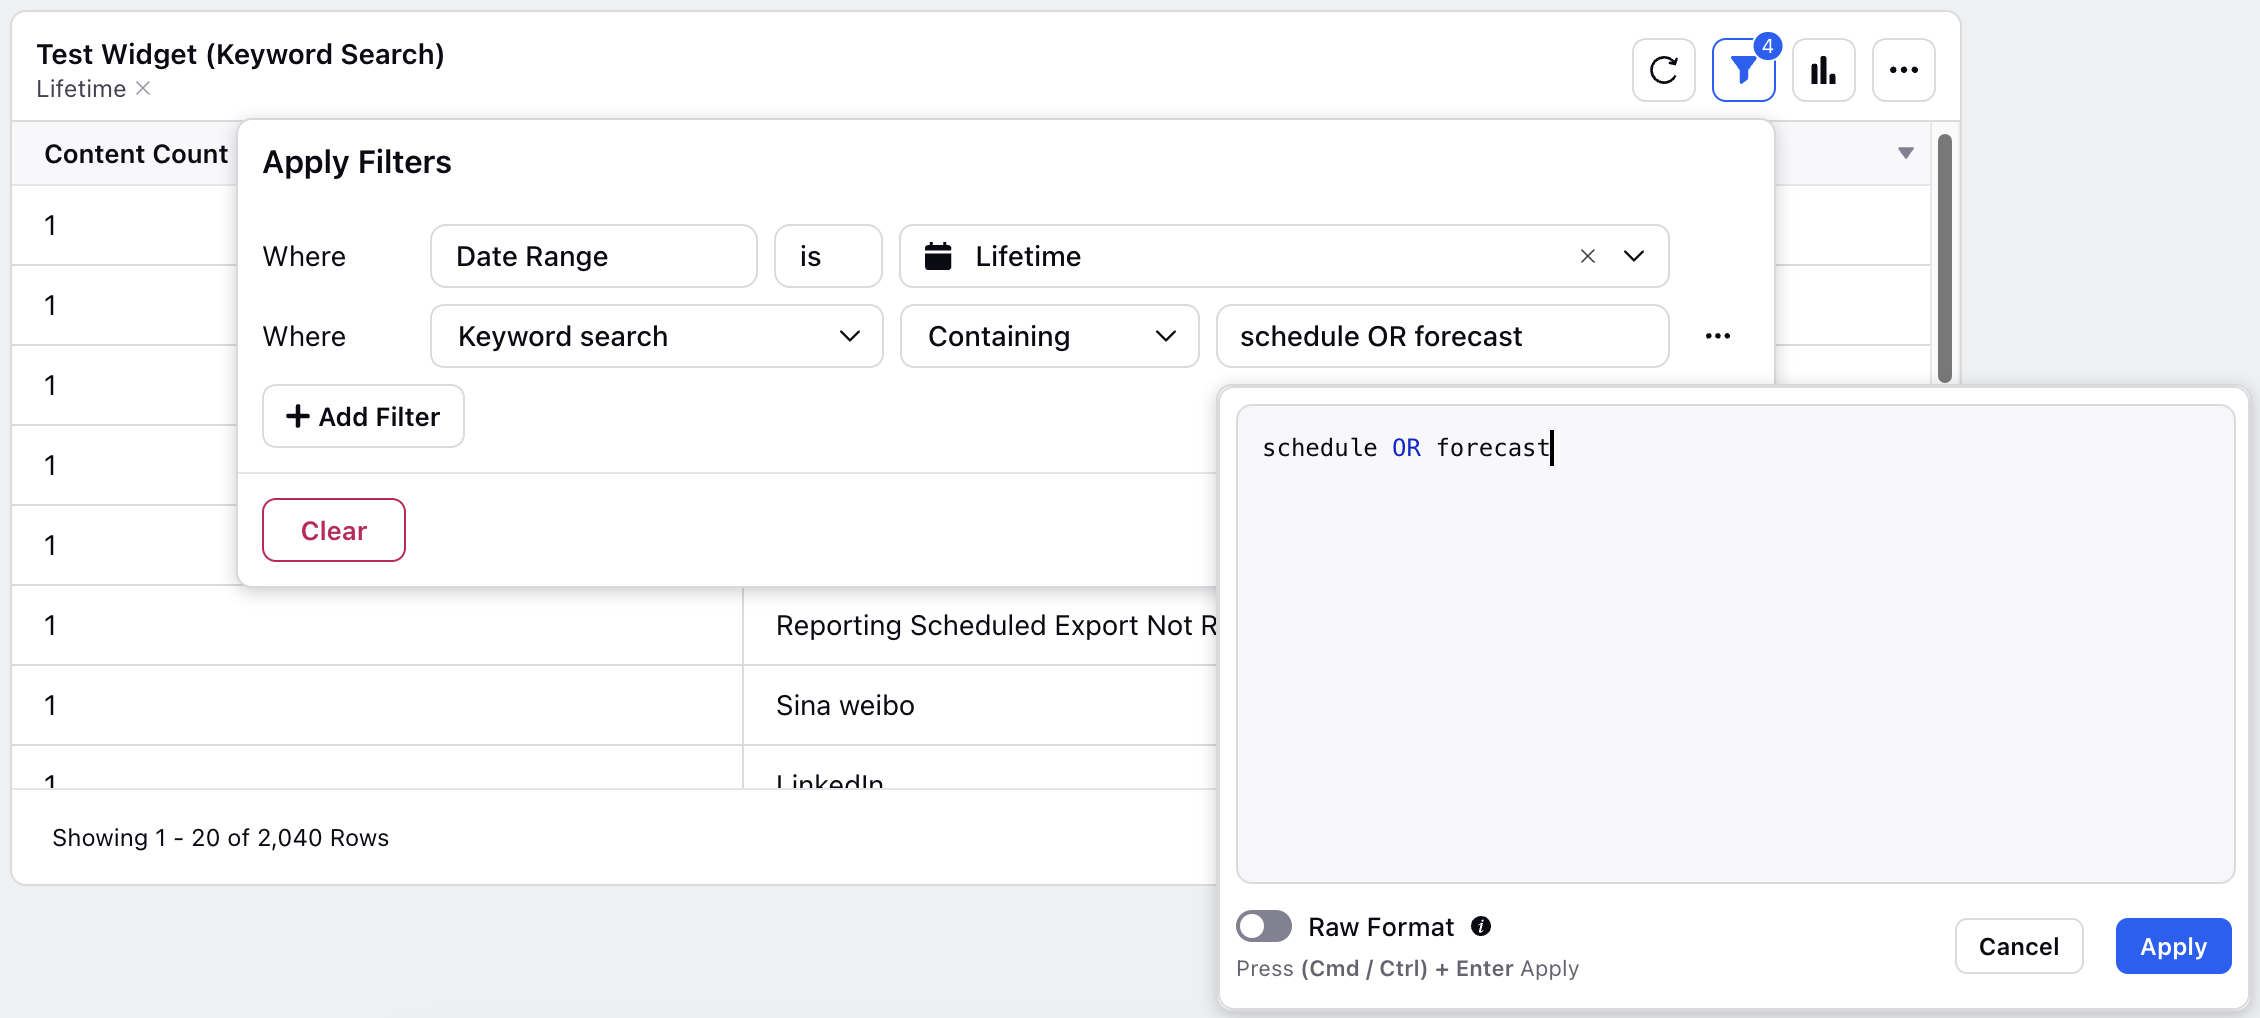
Using the Keyword Search filter, you can search for specific words in the title, description, and body of articles in the Knowledge Base. You can search for multiple keywords and use operators (AND, NOT, and OR) to configure further.
Examples:
AND: To find articles that contain both "installation" and "guide," use the search query: installation AND guide.
NOT: To find articles that contain "installation" but exclude "troubleshooting," use the search query: installation NOT troubleshooting.
OR: To find articles that contain either "installation" or "setup," use the search query: installation OR setup.
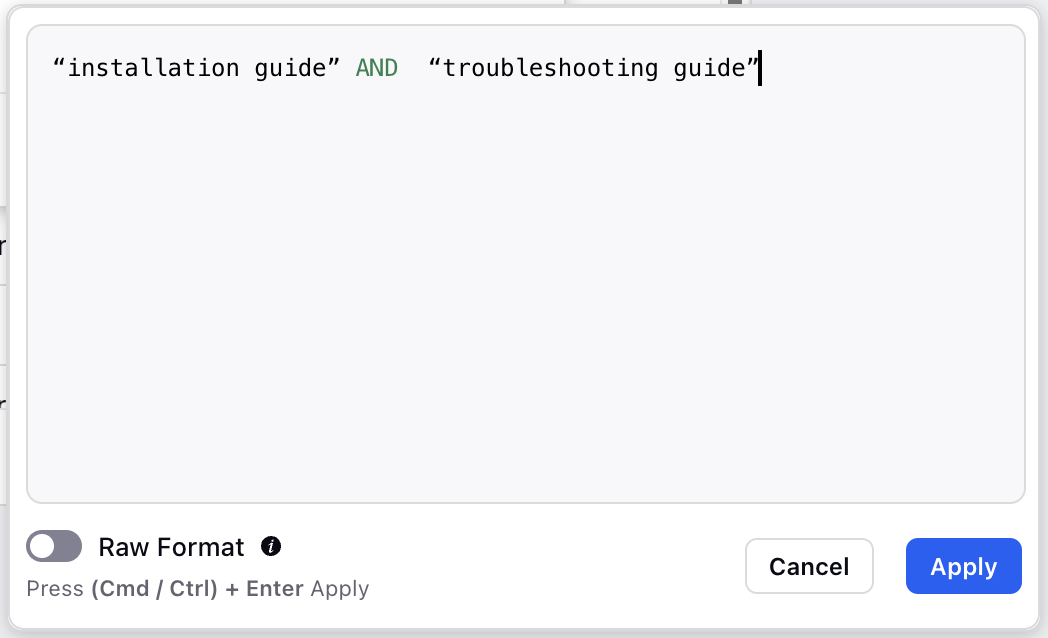
If the keyword contains multiple words, enclose the keyword in double quotes. For example, to find articles that contain both "installation guide" and “troubleshooting guide”, use the search query: “installation guide” AND “troubleshooting guide”.
Raw Format: Enable the Raw Format option to search for keywords that match accented words exactly as they are. For example, if "qué" is searched with Raw Format enabled, "qué" will be matched, but "que" will not be matched.
Nested Category Filter
Using the Nested Category filter, you can configure the Reporting Widgets to display articles within the selected category and any sub-categories. When this filter is applied, categories and articles preceding the selected category in the hierarchy will not be displayed in the Widget.

For example, you have a “Customer Support" category, which has "Technical Support" and " Billing Inquiries" sub-categories. If you select “Customer Support" in the Nested Category filter, the Reporting Widgets will show articles not only in "Customer Support" but also in the "Technical Support" and " Billing Inquiries" sub-categories. However, articles in categories preceding "Customer Support" in the hierarchy, such as "General Inquiries" or "Account Management," will not be displayed.
View the Category Hierarchy of Articles
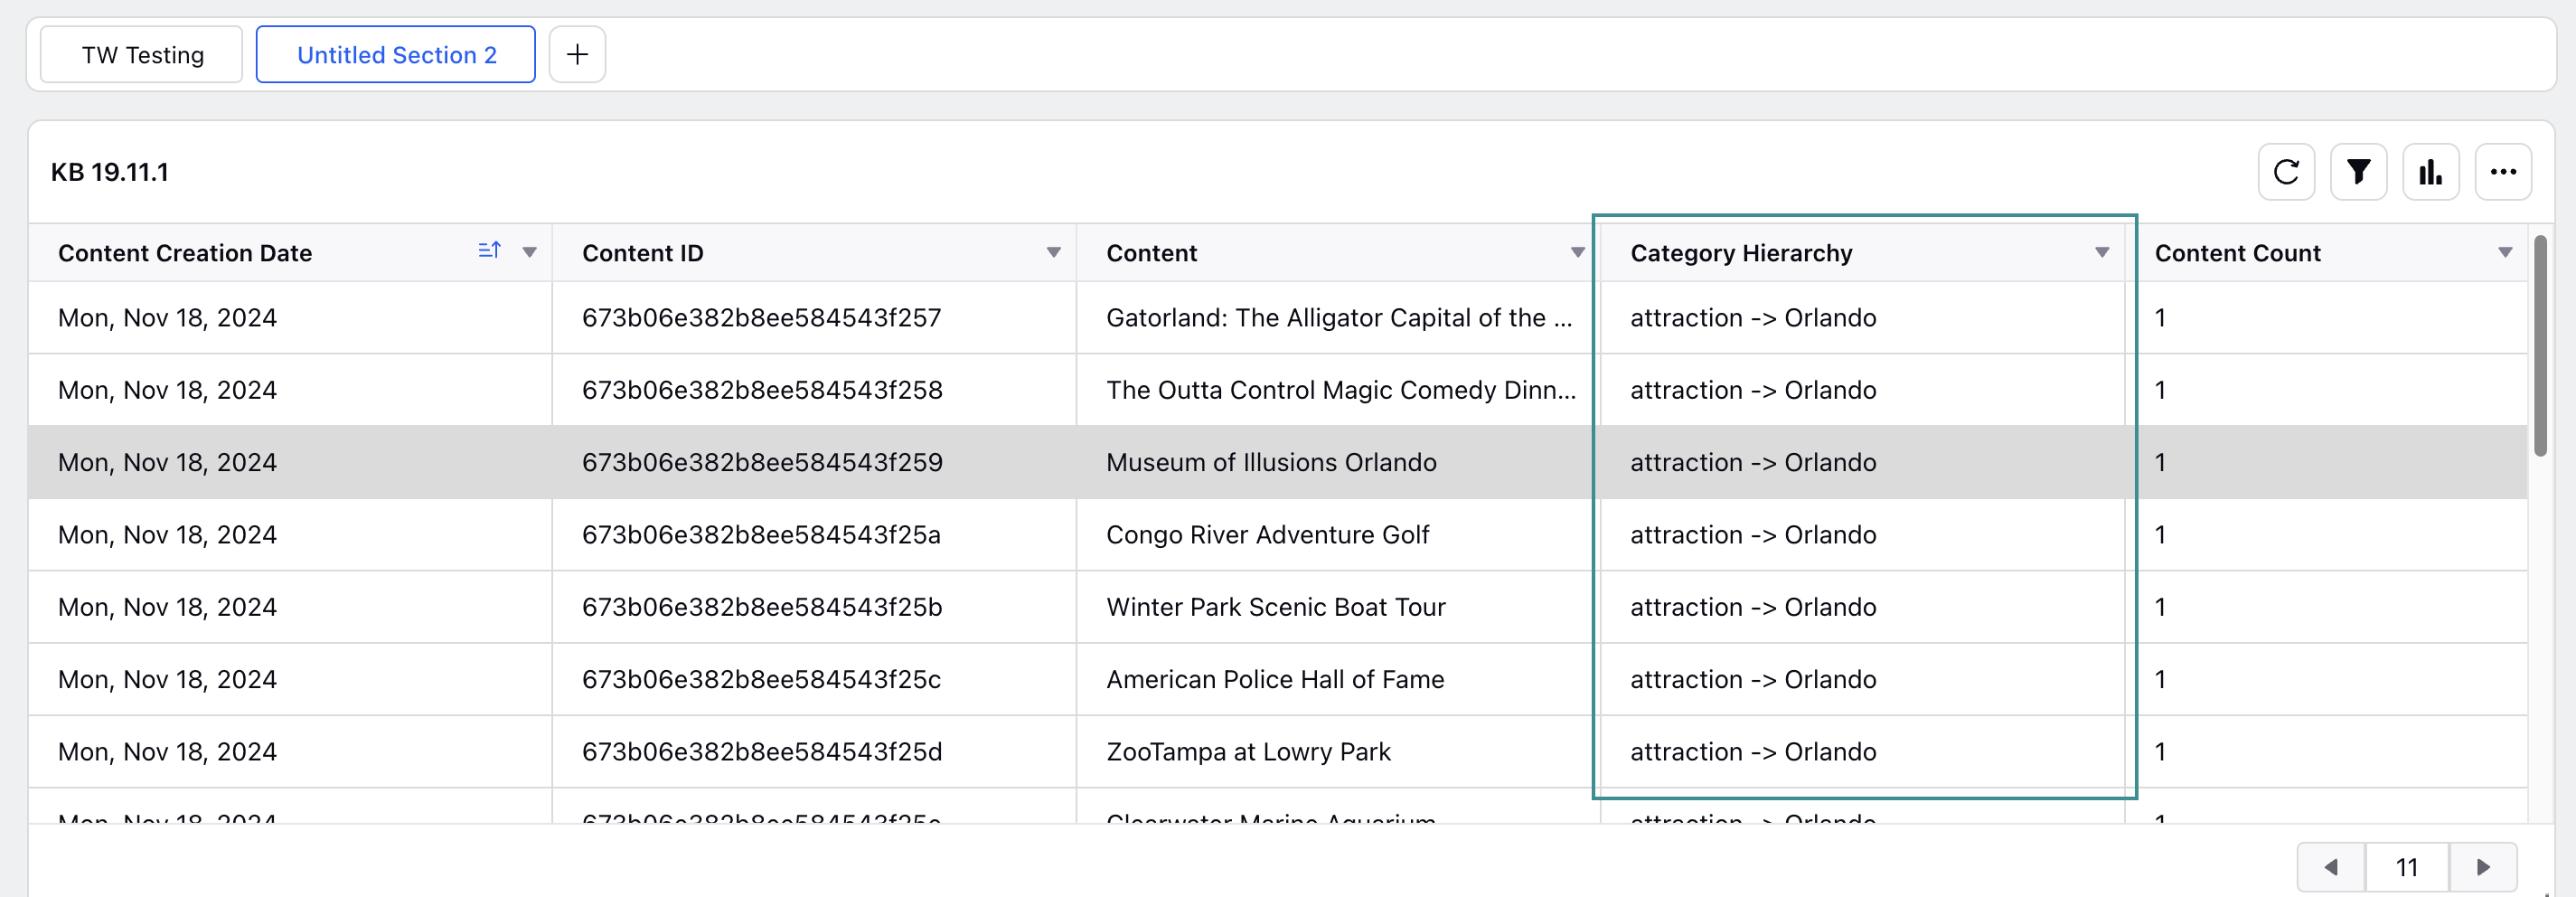
Select the following Metrics and Dimensions in the Widget Builder to view the Category hierarchy of articles:
Metrics | Dimensions |
Content Count | Category Hierarchy |
- | Content Creation Date |
- | Content ID |
- | Content |
Note: Even if the Category is deleted, the Category ID will be visible in the hierarchy.
Note: The category ID will be visible even if you do not have visibility to a parent category in the category hierarchy.
Note: The parent category and sub-hierarchy will be visible even if you do not have access to a sub-category in the category hierarchy.
Content Modified Time
The “Content Modified Time” dimension reflects when the author has modified an article's content. It is updated only when the article's content, such as the title or body, is modified.

Note: Changes to the article’s properties or other non-content elements will not update this dimension.
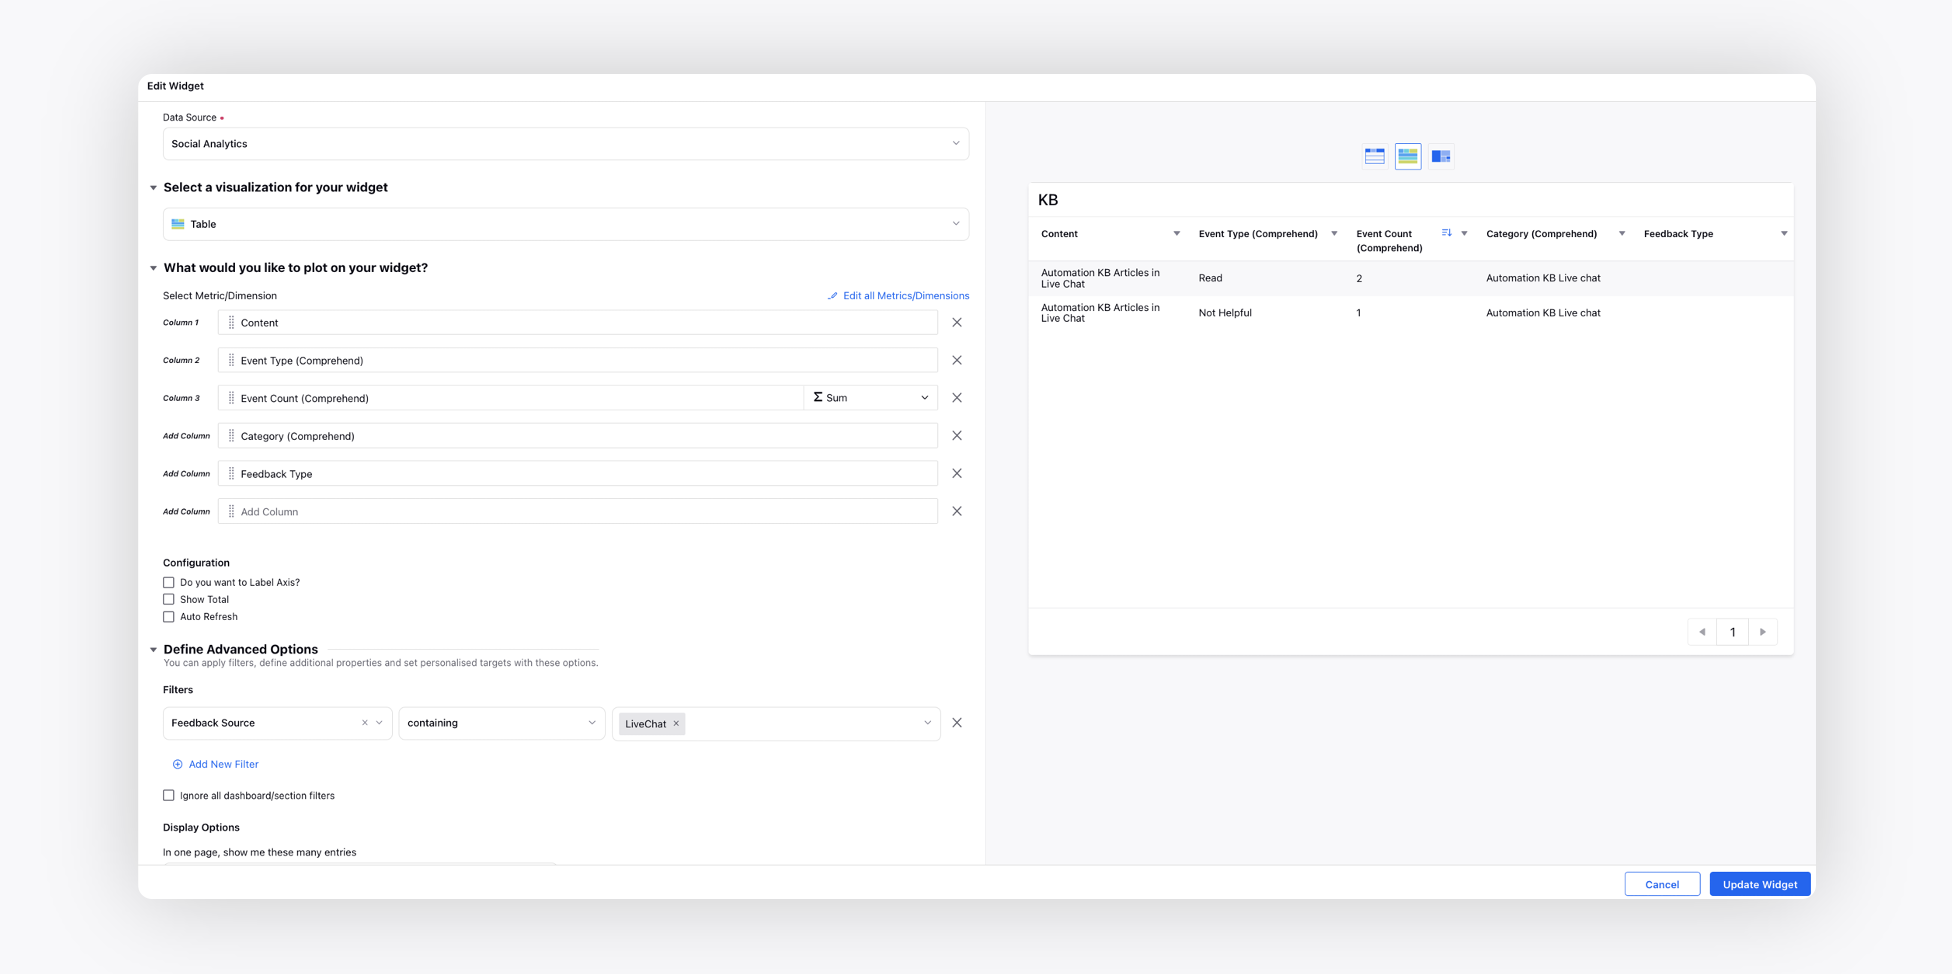
KB Views on Live Chat
Select the Feedback Source filter as LiveChat.
Linked Asset Type and ID
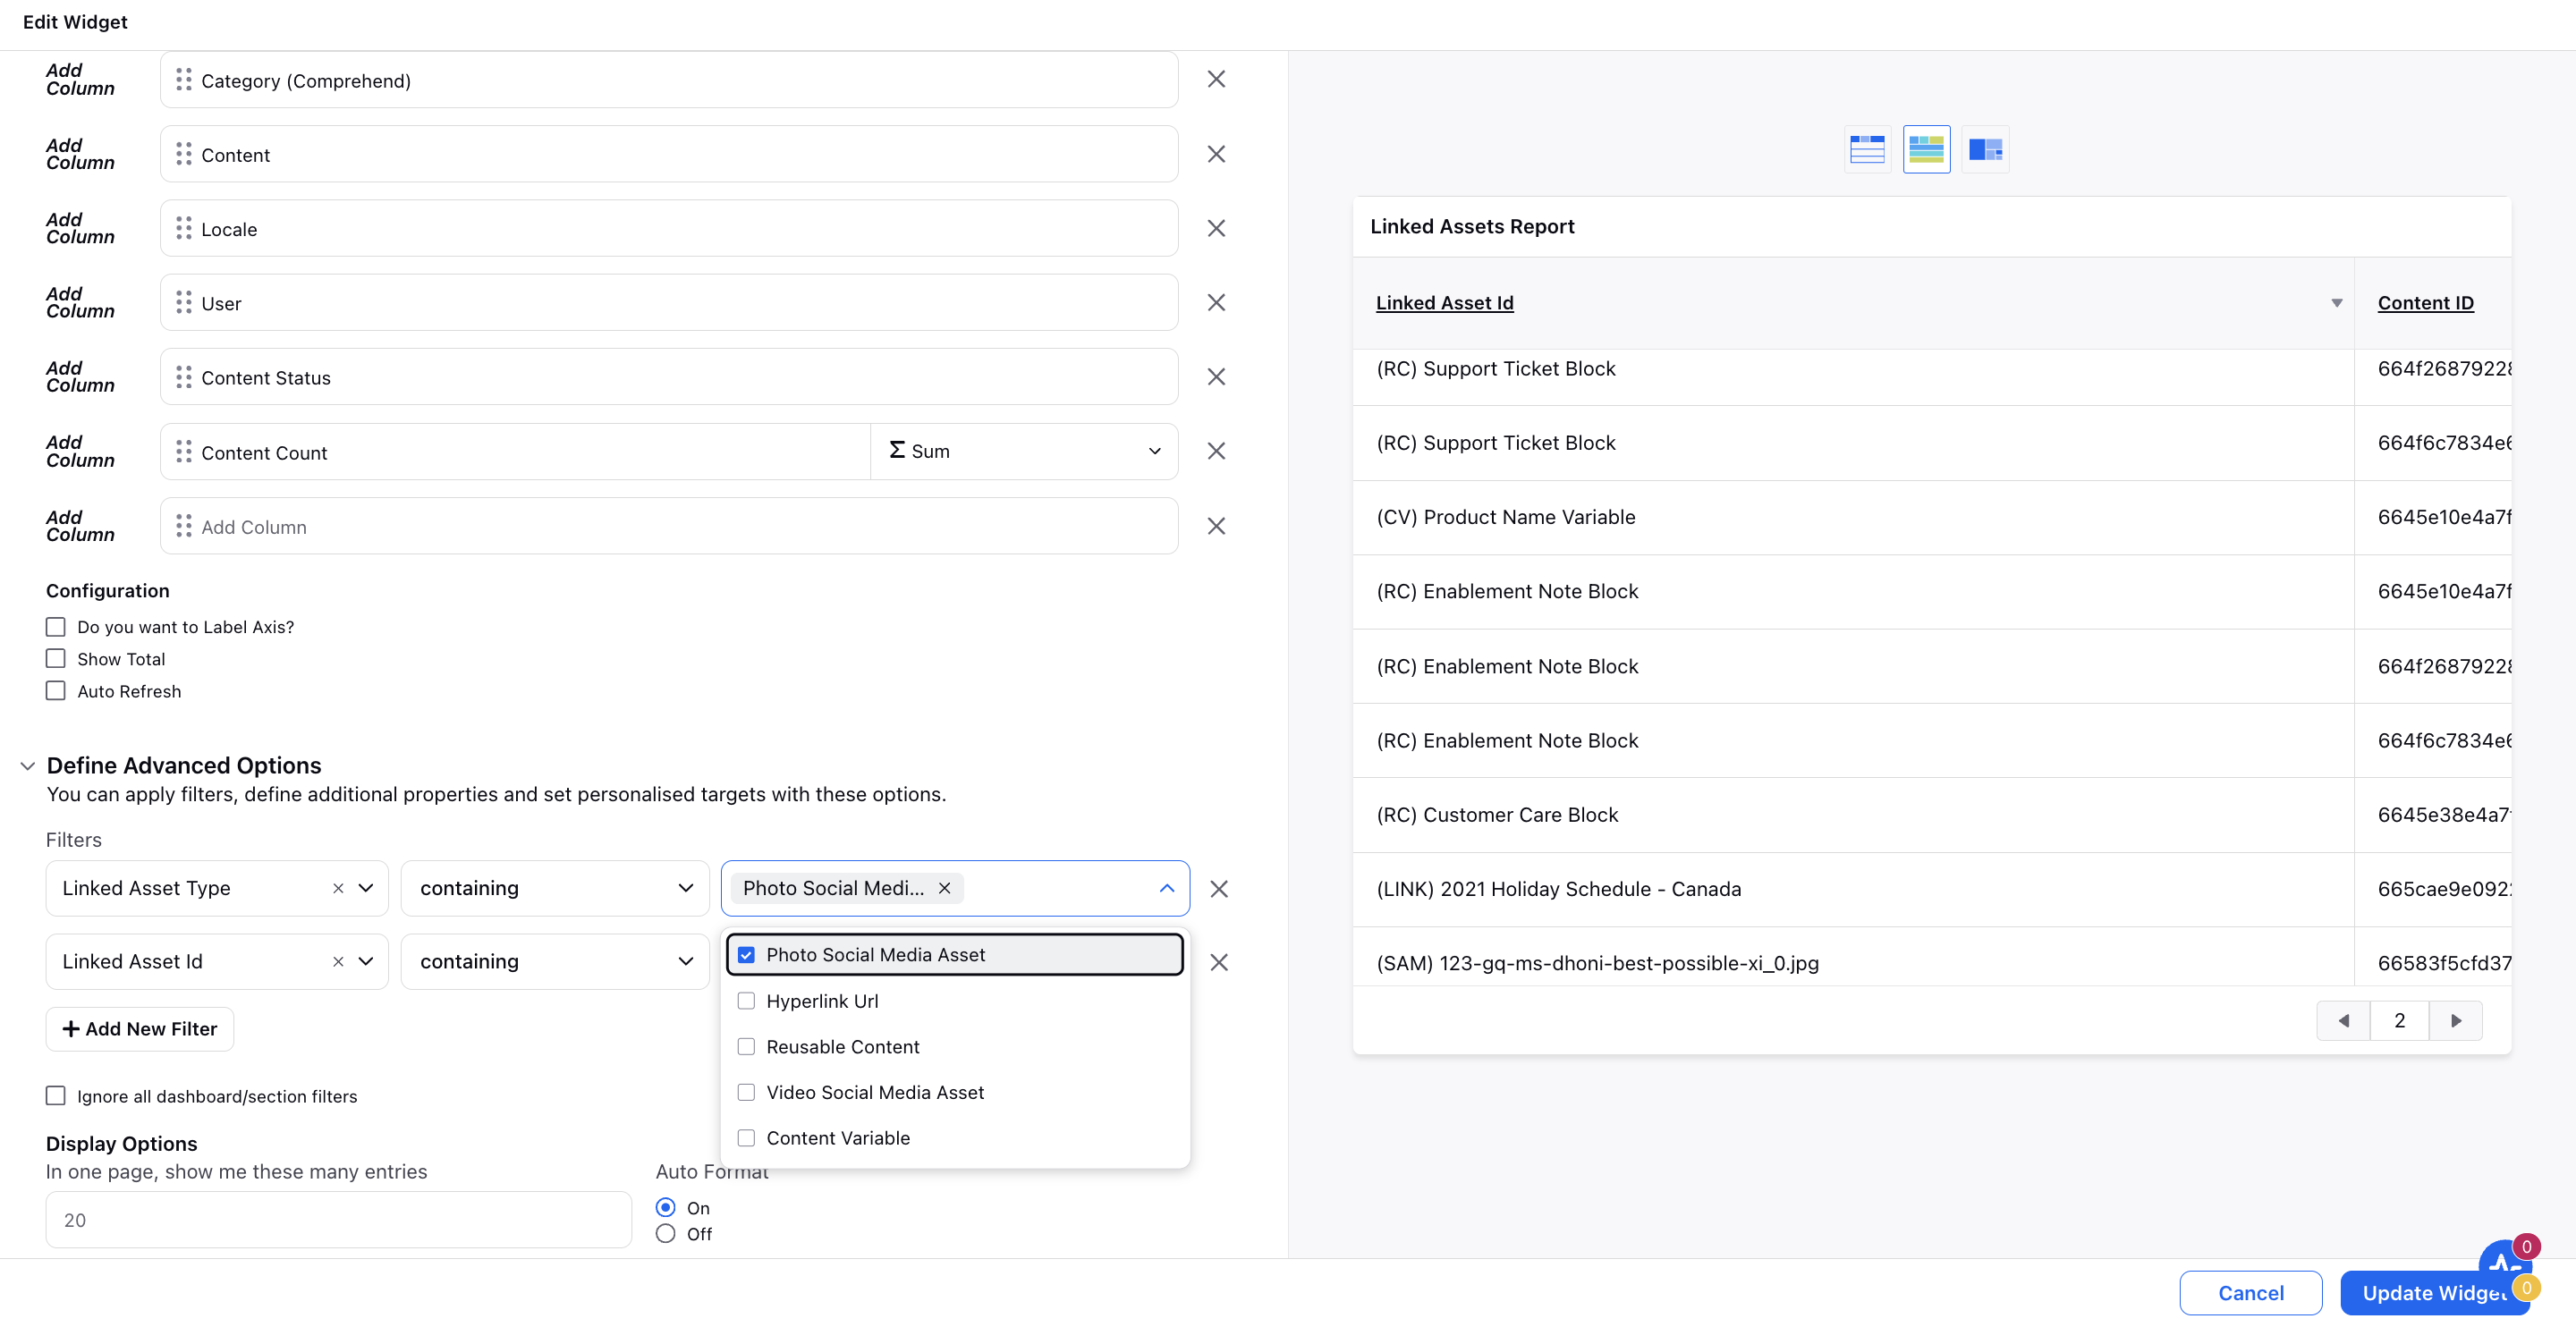
While managing articles, it's crucial to know where different components such as content blocks, content variables, DAM (Digital Asset Management) assets (like images and videos), and article hyperlinks are used within your articles.
To track the articles where these specific components are referenced, add the "Linked Asset Type" and "Linked Asset ID" dimensions to your report. You can also use these dimensions as filters with specific values, such as content block name, DAM asset ID, to narrow down the results.
In order to see where a particular asset is used you can filter by "Linked Asset Id" for different formats
Media Asset: (SAM) <Name of Media file>
Article: (Link) <Article Title>
Content Block: (CB) <Name of Content Block>
Content Variable: (CV) <Name of Content Variable>
Note: The filter options you see in a report will depend on the data that's currently displayed. It's recommended to first apply the desired time range or any other filter, the choices in the next filter will automatically update to show only what's relevant and compatible to the current results.
