Proactive Prompts Reporting
Updated
In Care Reporting, you can view reporting on proactive prompts by creating a widget using various metrics and dimensions.
To Configure a Reporting Widget
Click the New Tab icon. Under the Sprinklr Service tab, click Care Reporting within Analyze.
On the Reporting Home window, select the desired dashboard within the Dashboards section.
On the selected Reporting Dashboard window, click Add Widget in the top right corner.
On the Create Custom Widget window, enter a Name for the widget, and select the Data Source as Audience Activity.
Select a Visualization for your widget from the available visualization types. For more information, view Visualization Type — Field Descriptions.
Next, within the What would you like to plot on your widget section, select the desired dimensions and metrics for which you want to view the reporting. View some common use cases.
Set the Configuration for your custom widget as desired. You can select from the following:
Do you want to Label Axis? - Provide a custom name to your reporting widget axes.
Show Total - Shows the sum total of the data at the top of the selected metric column.
Auto Refresh - Specify a timeframe to automatically refresh your widget data.
Add Pivots/Grouping - Select a dimension to group your reporting data for ease.
Next, under the Define Advanced Options section, add the filters as desired.
Check the box alongside Ignore all Dashboard Filters to ignore all the dashboard filters for this widget and set the widget Display Options as desired.
Click Add to Dashboard in the bottom right corner to add your widget to the dashboard.
Common Use Cases
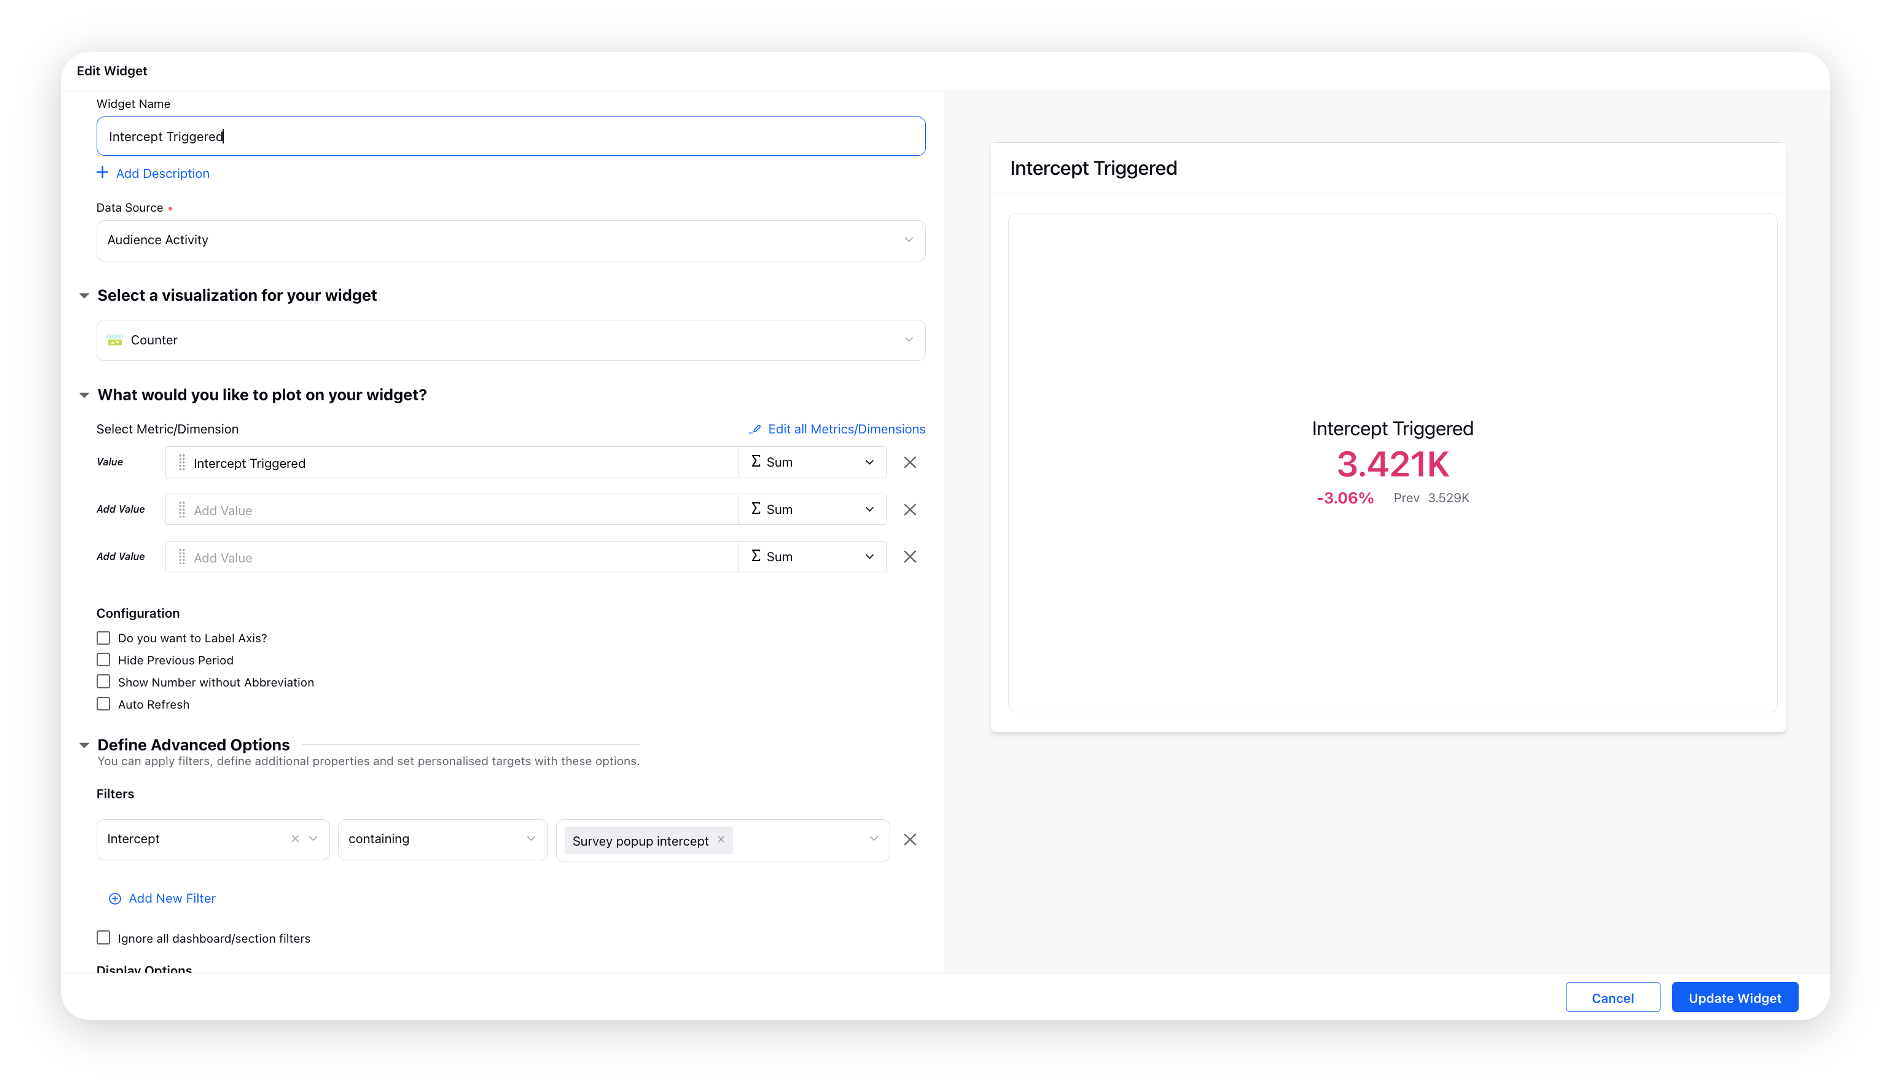
Intercept Triggered
The number of times the prompt was triggered after the configured intercept conditions are met.
Create a Counter widget. Select the Intercept Triggered custom metric and the desired Survey Intercept from the Filters dropdown.
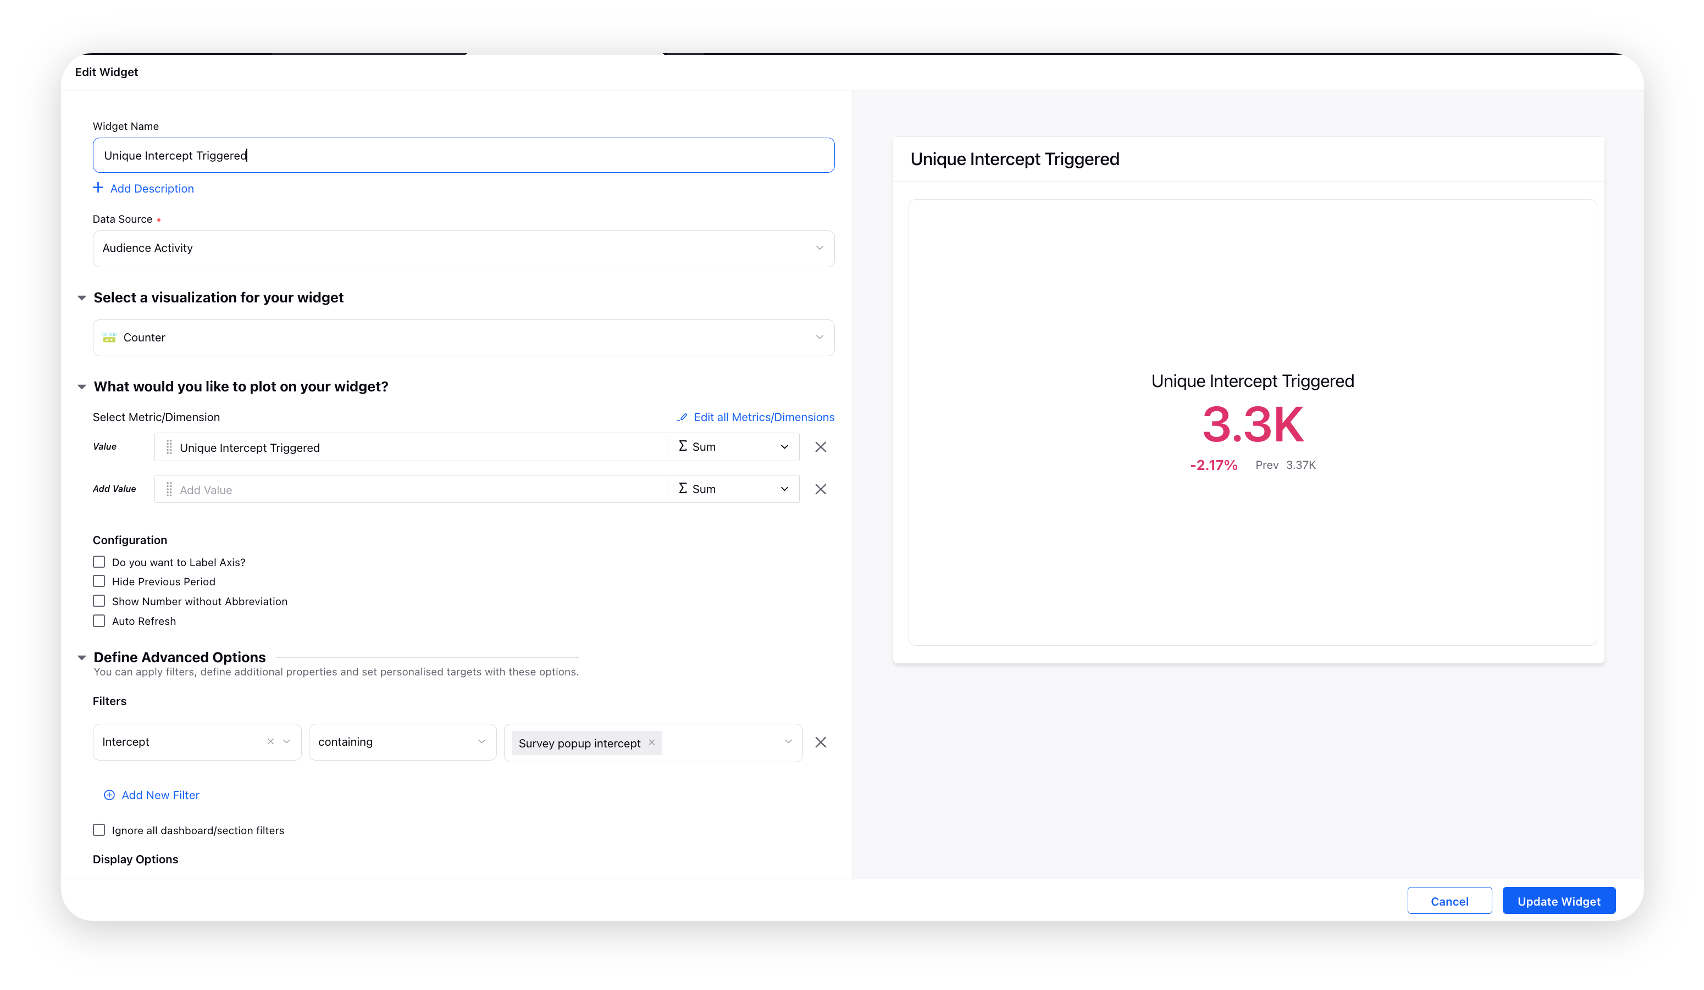
Unique Intercept Triggered
The unique number of times the prompt was triggered after the configured intercept conditions are met.
Create a Counter widget. Select the Unique Intercept Triggered custom metric and the desired Survey Intercept from the Filters dropdown.
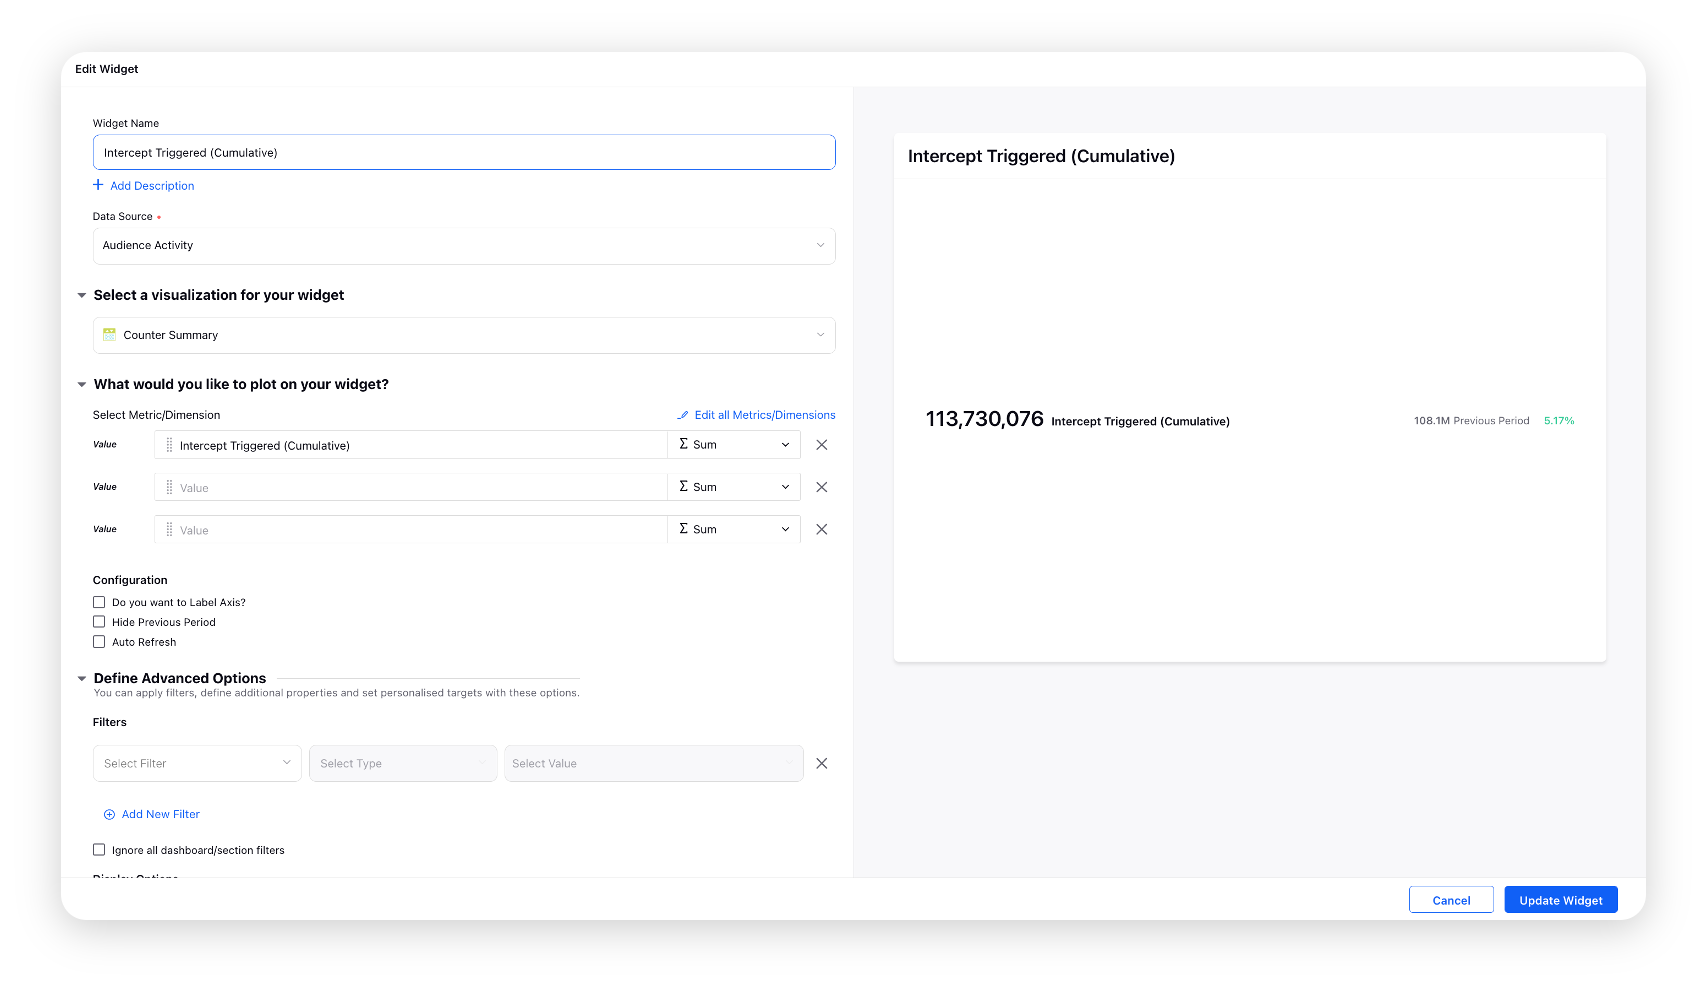
Intercept Triggered (Cumulative)
The cumulative number of times the prompt was triggered after the configured intercept conditions are met.
Create a Counter Summary widget and select the Intercept Triggered (Cumulative) custom metric.
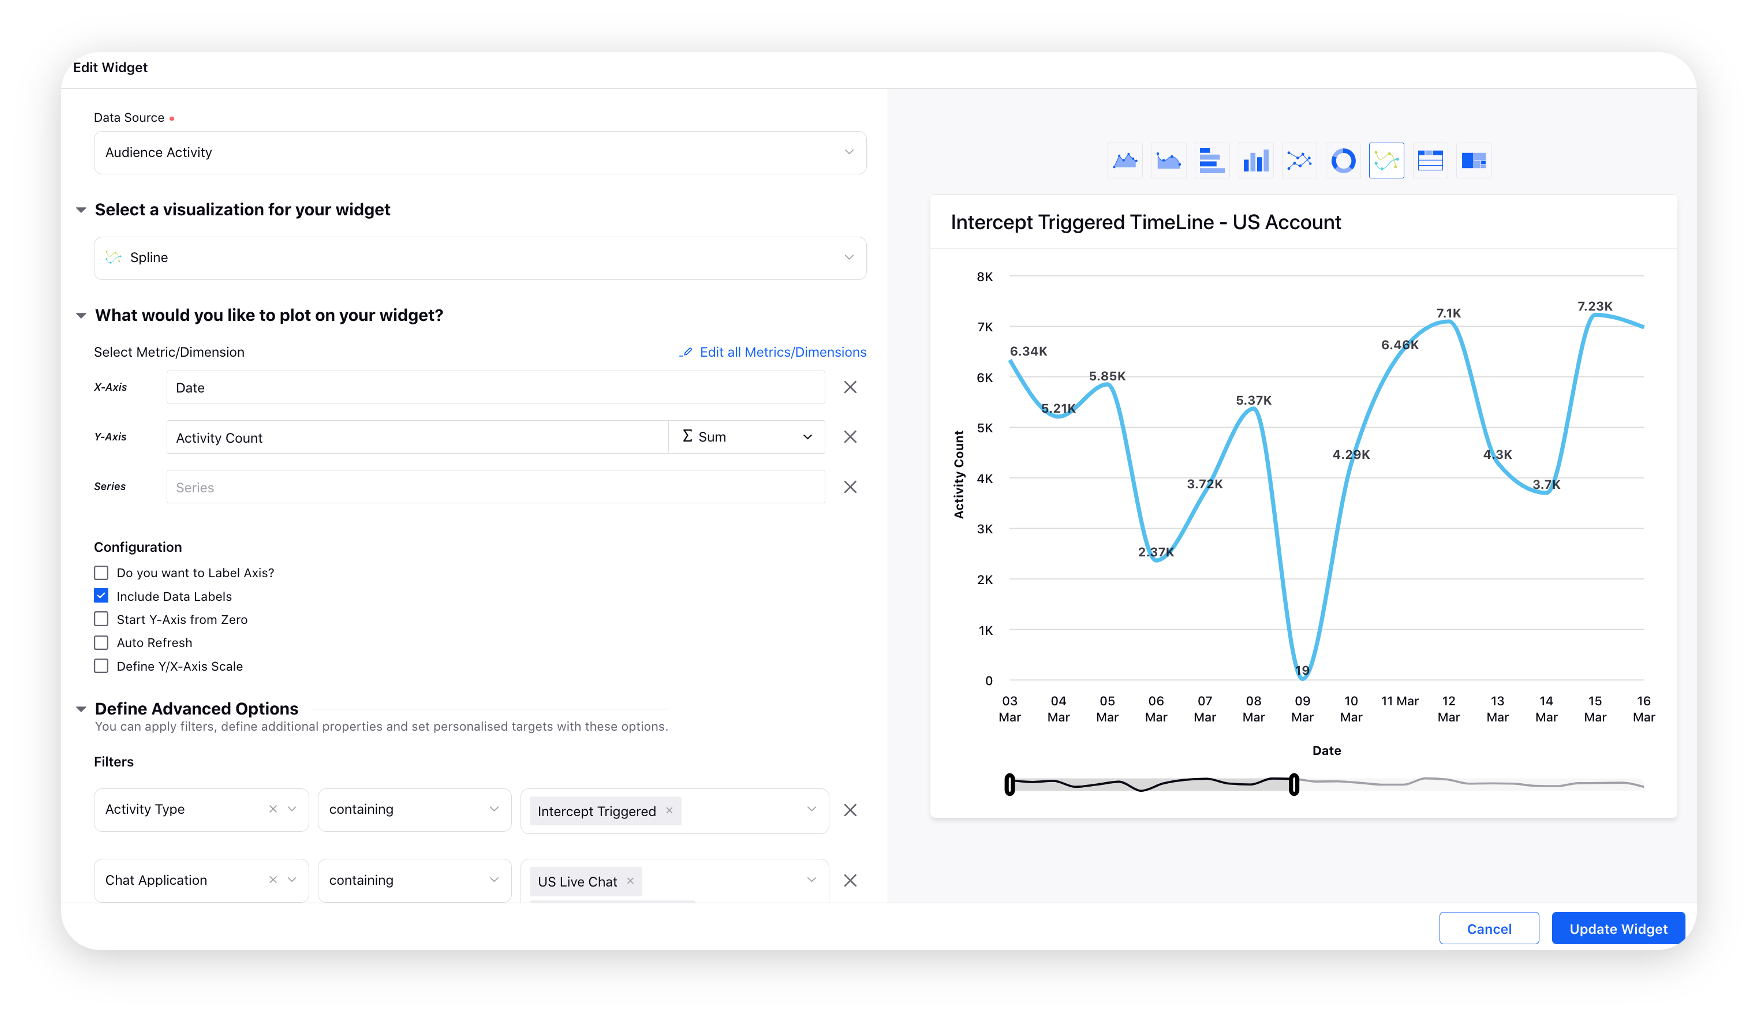
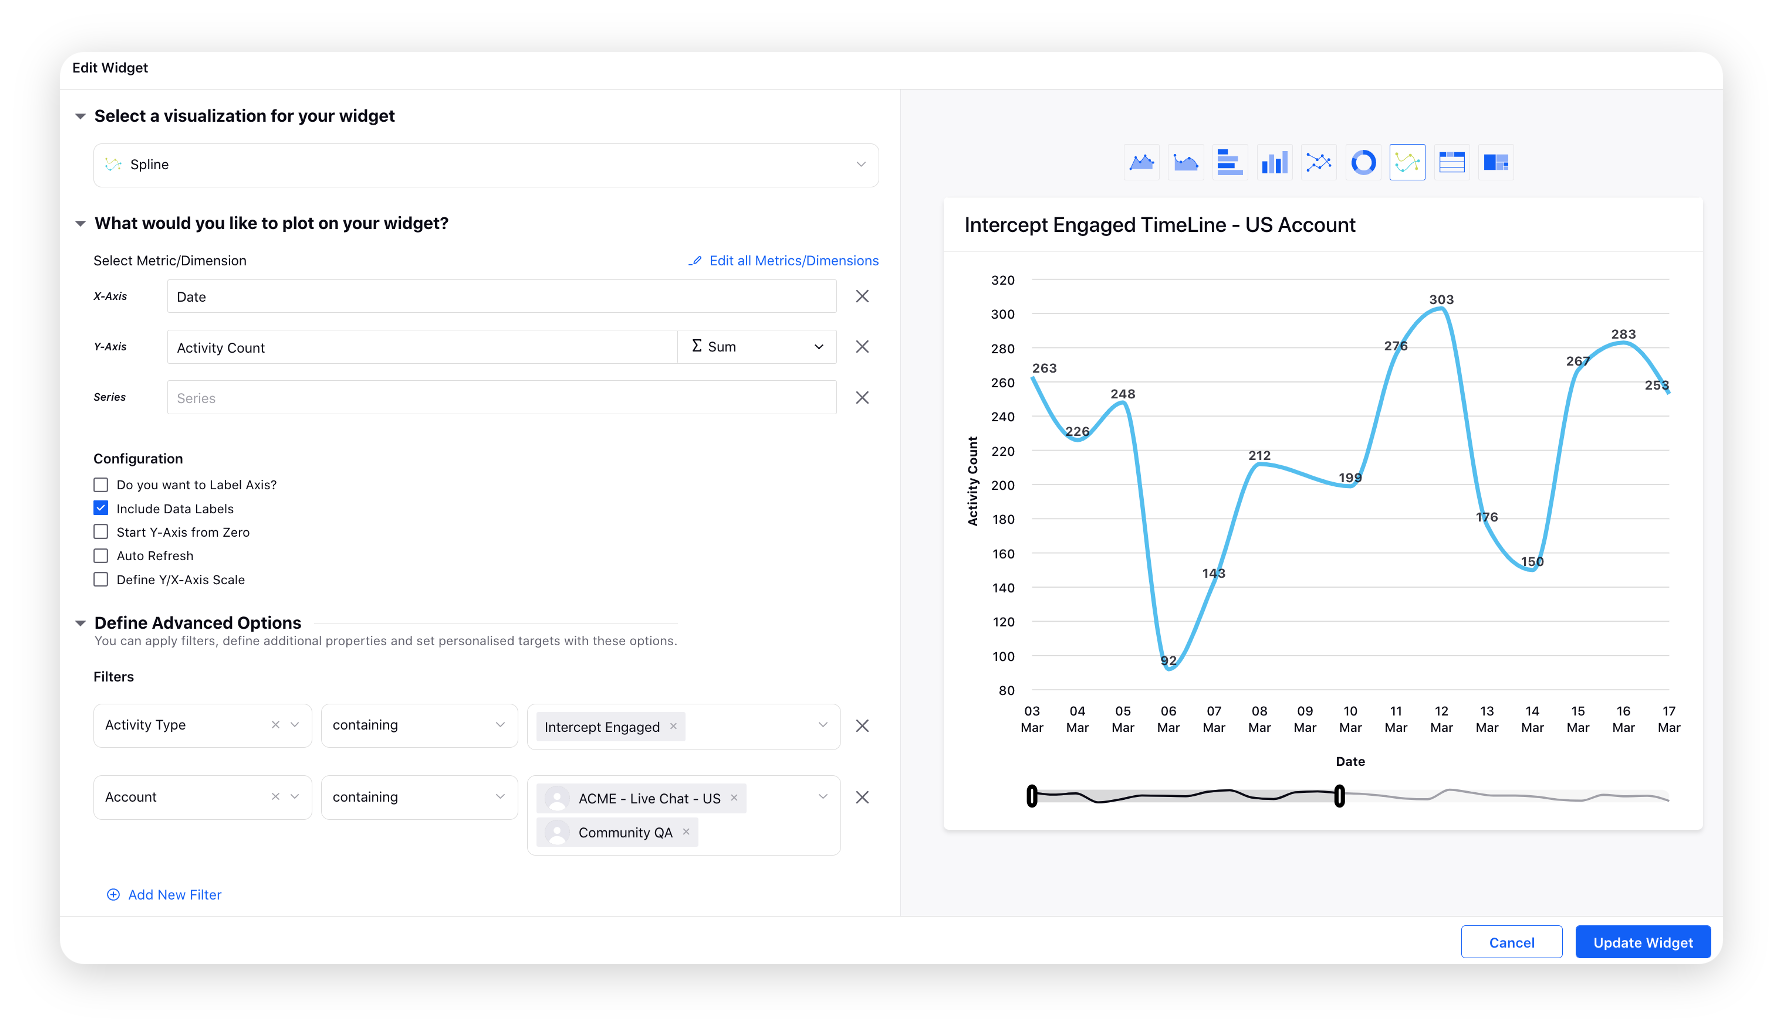
Intercept Triggered Timeline
The visualization of time vs the number of intercepts for a brand.
Create a Spline widget. Select the Activity Count metric with the Date dimension. Next, select the Activity Type as Intercept Triggered and the desired Chat Application from the Filters dropdown.
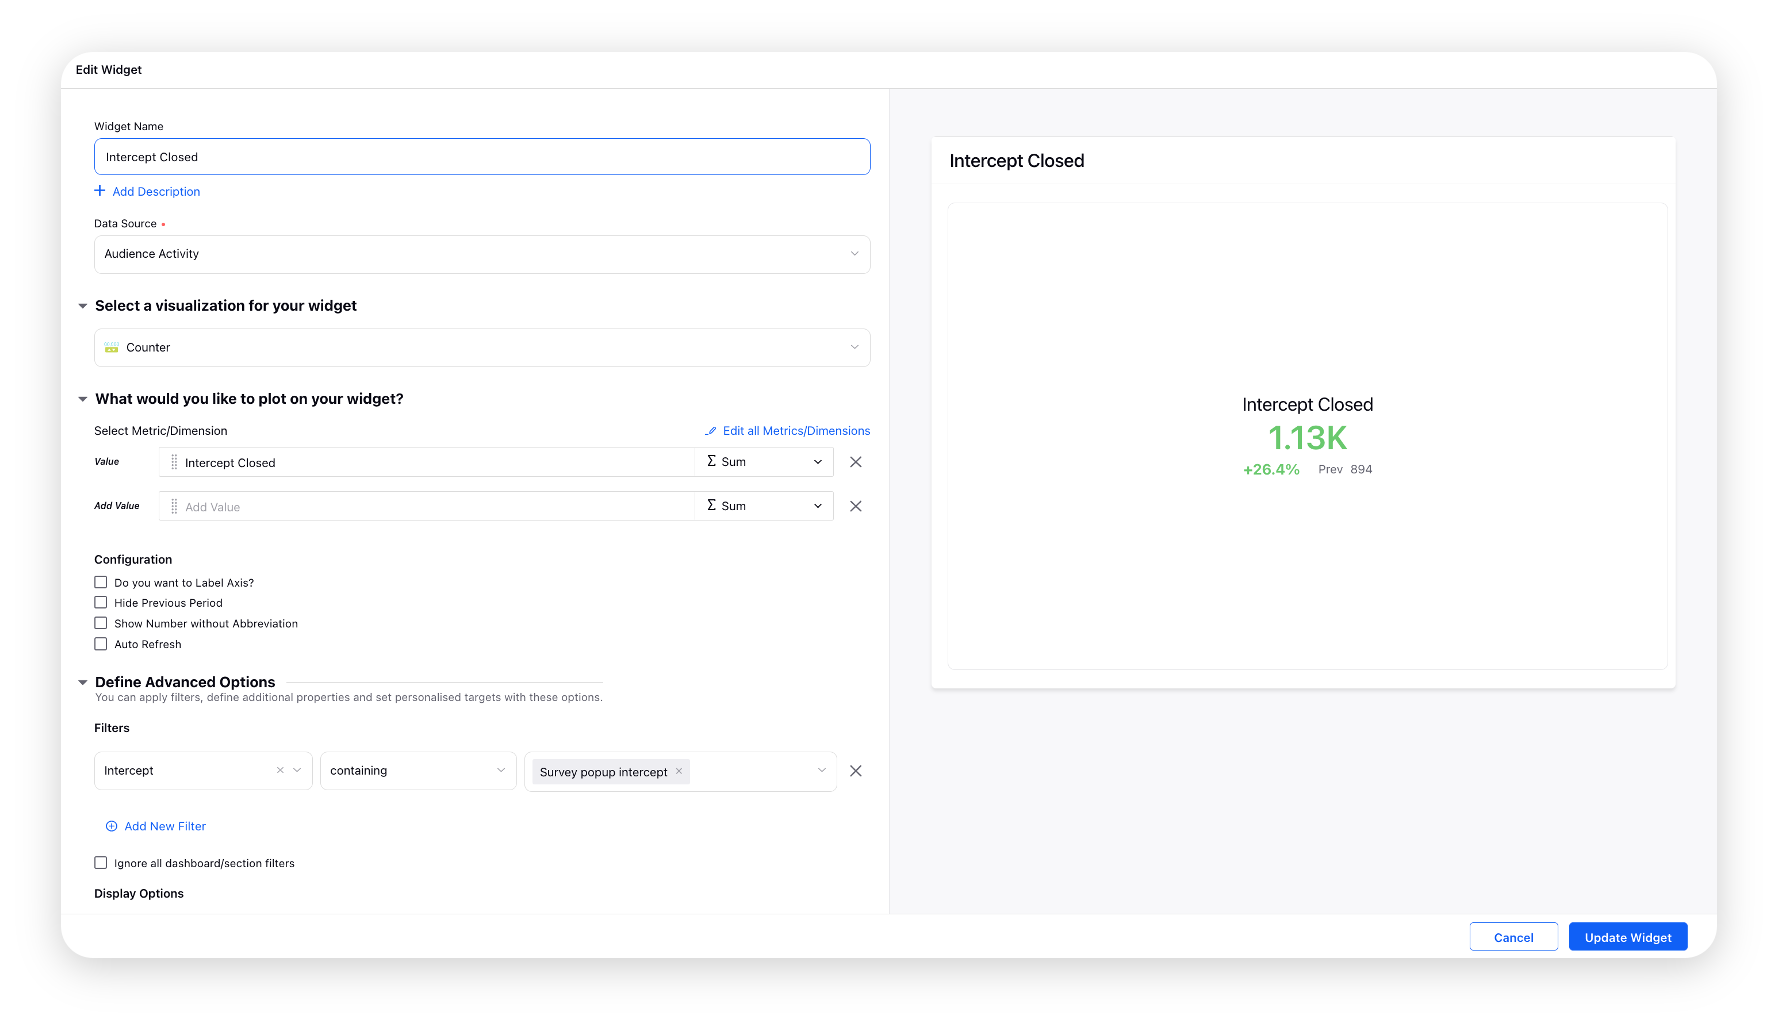
Intercept Closed
Number of times the popups/intercepts were closed (when you click cross or click close button in the popup).
Create a Counter widget. Select the Intercept Closed custom metric and the desired Survey Intercept from the Filters dropdown.
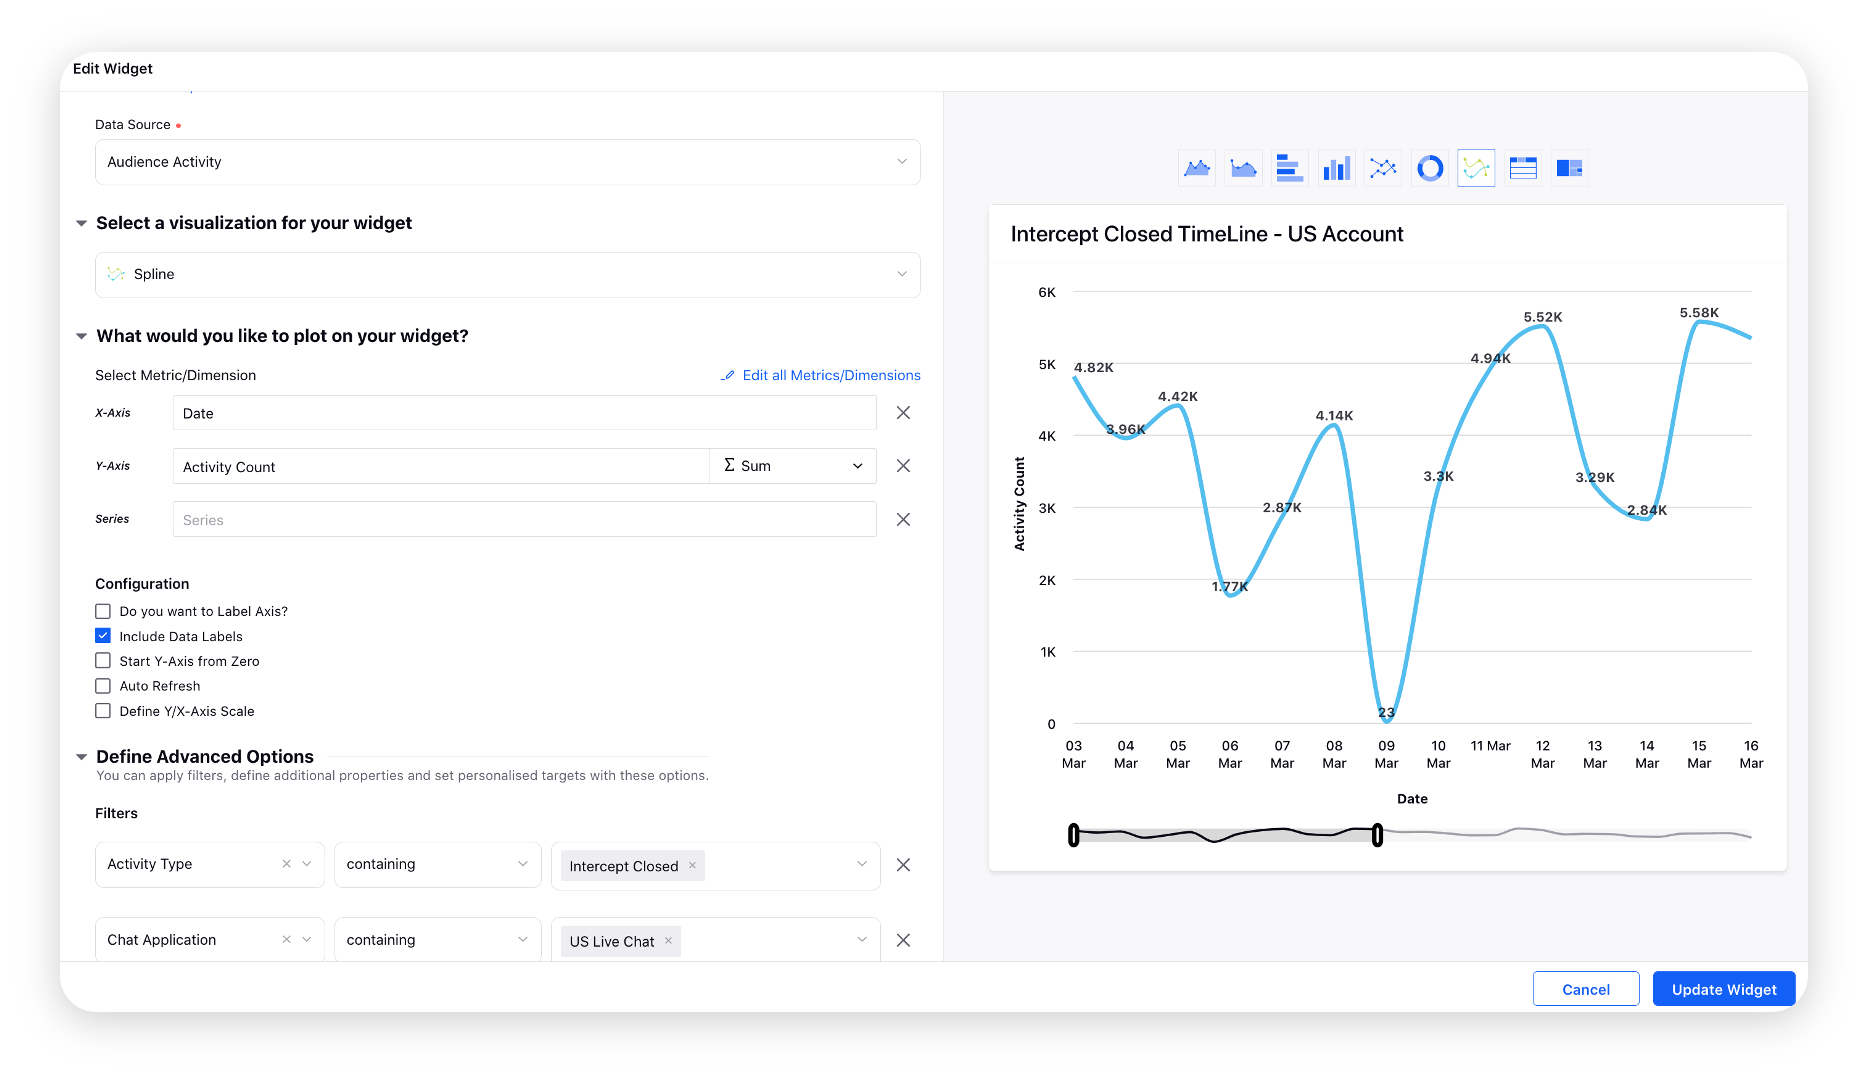
Intercept Closed Timeline
The visualization of time vs the no. of intercepts closed for a brand by a customer.
Create a Spline widget. Select the Activity Count metric with the Date dimension. Next, select the Activity Type as Intercept Closed and the desired Chat Application from the Filters dropdown.
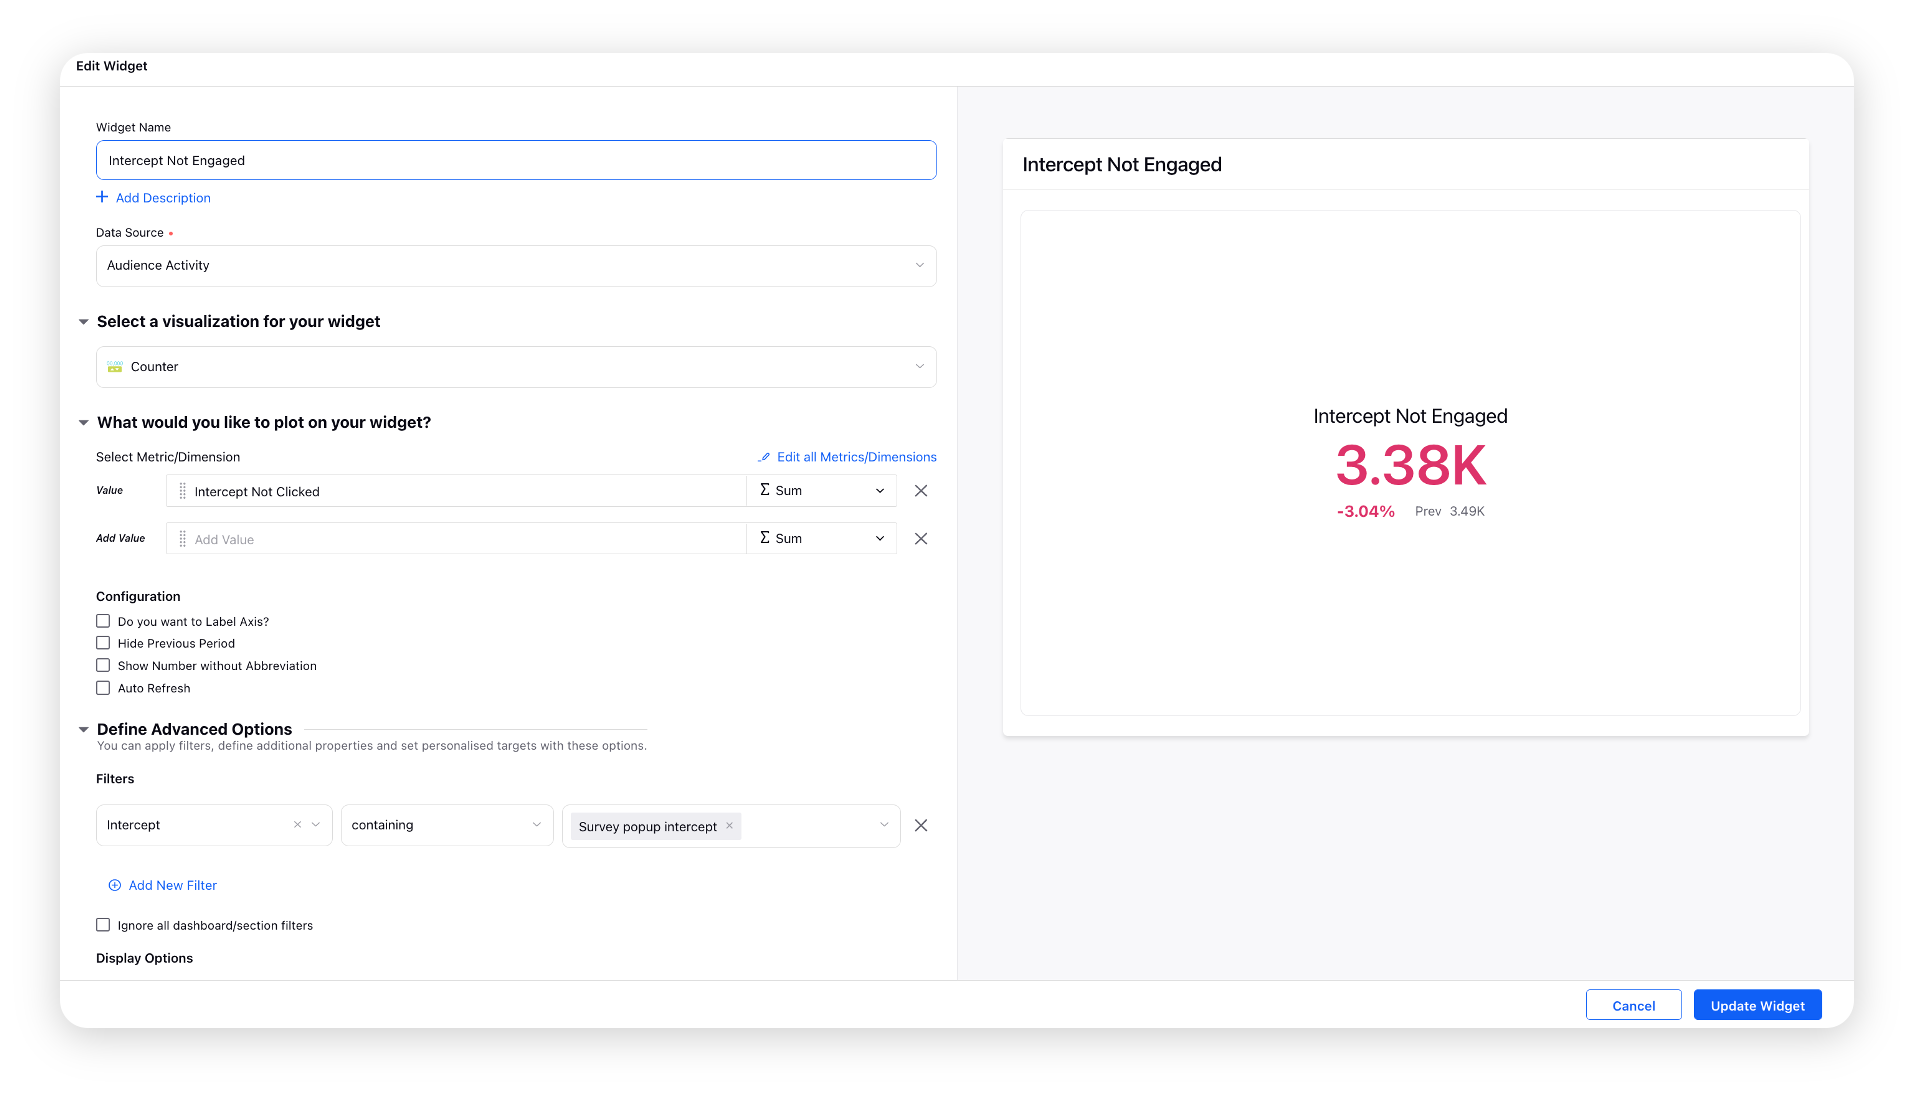
Intercept Not Engaged
Sum of all the CTAs on which any engagements (CTAs) were not done by the customer.
Create a Counter widget. Select the Intercept Not Clicked custom metric and the desired Survey Intercept from the Filters dropdown.
Intercept Engaged
Sum of all the CTAs on which any engagements (CTAs) were done by the customer.
Create a Counter widget. Select the Intercept Engaged custom metric and the desired Survey Intercept from the Filters dropdown.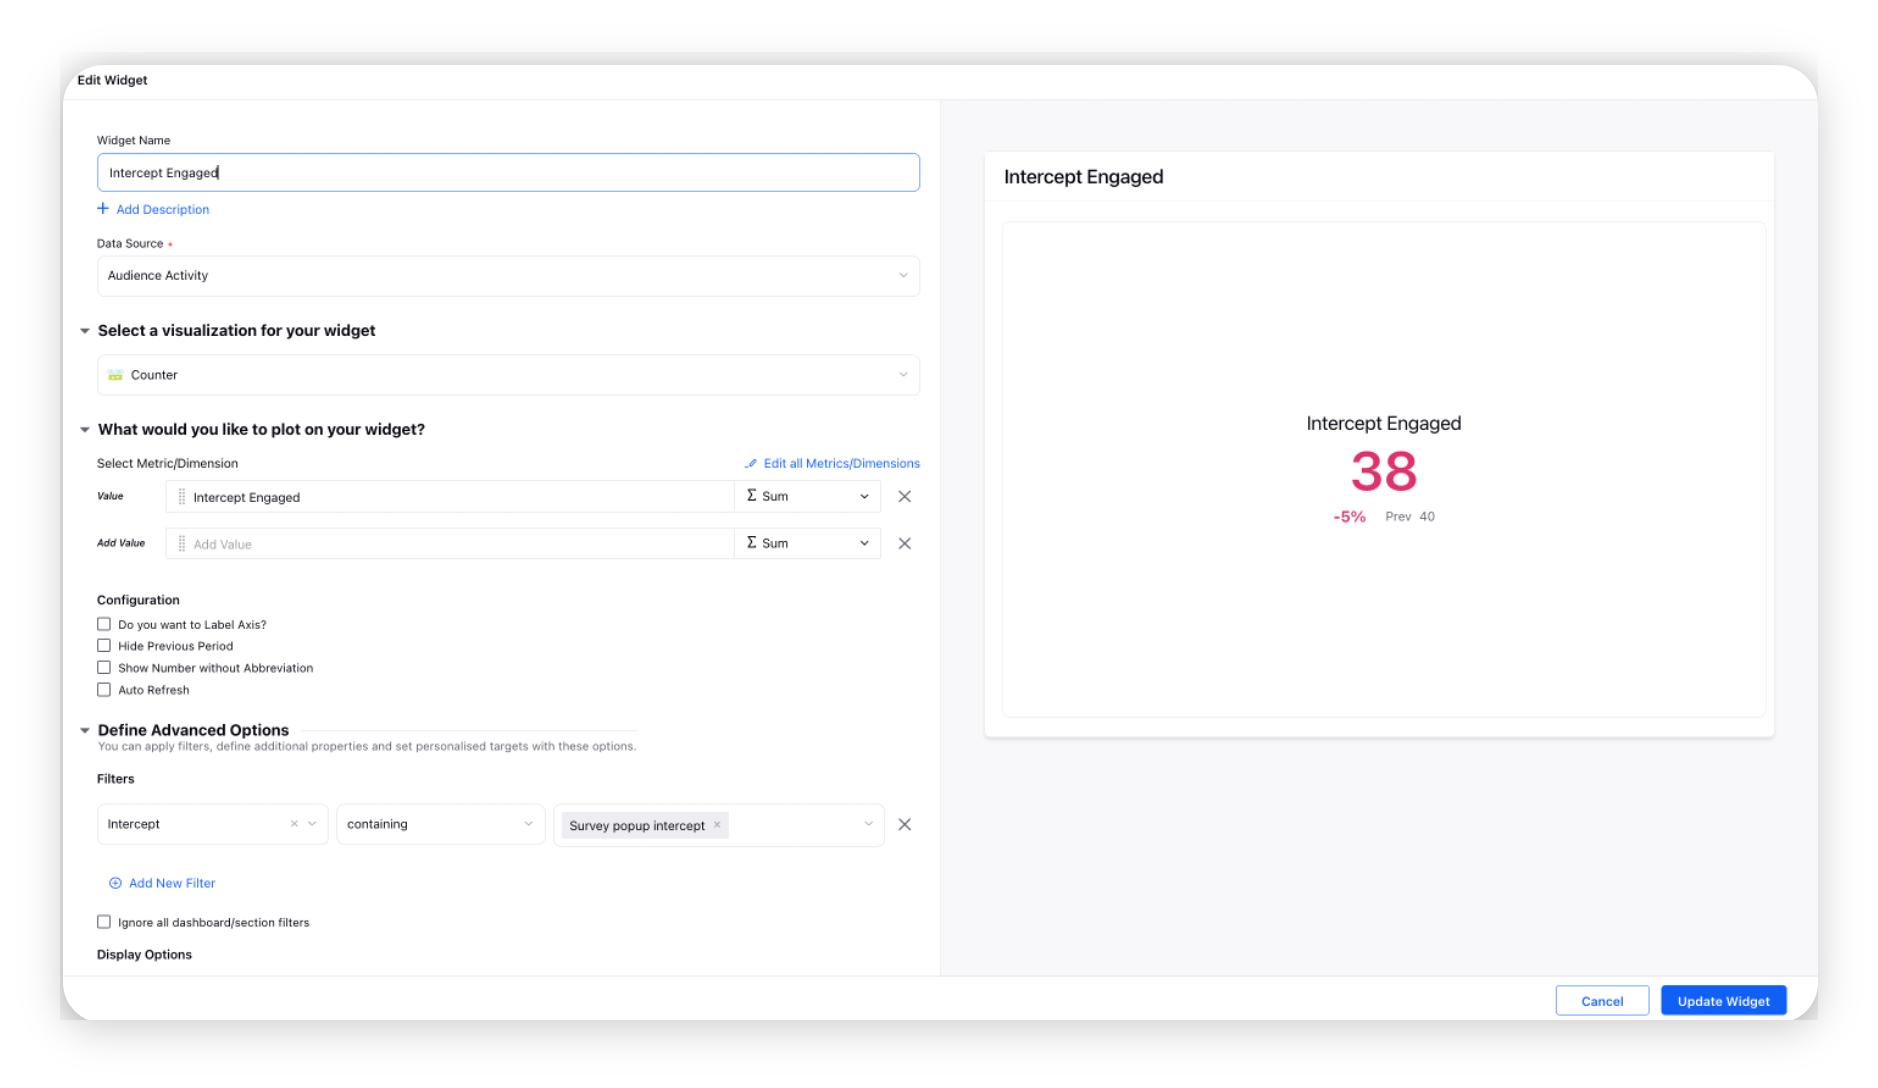
Intercept Engaged Timeline
The visualization of time vs Sum of engaged intercepts for a brand by a customer.
Create a Spline widget. Select the Activity Count metric with the Date dimension. Next, select the Activity Type as Intercept Engaged and the desired Chat Application from the Filters dropdown.
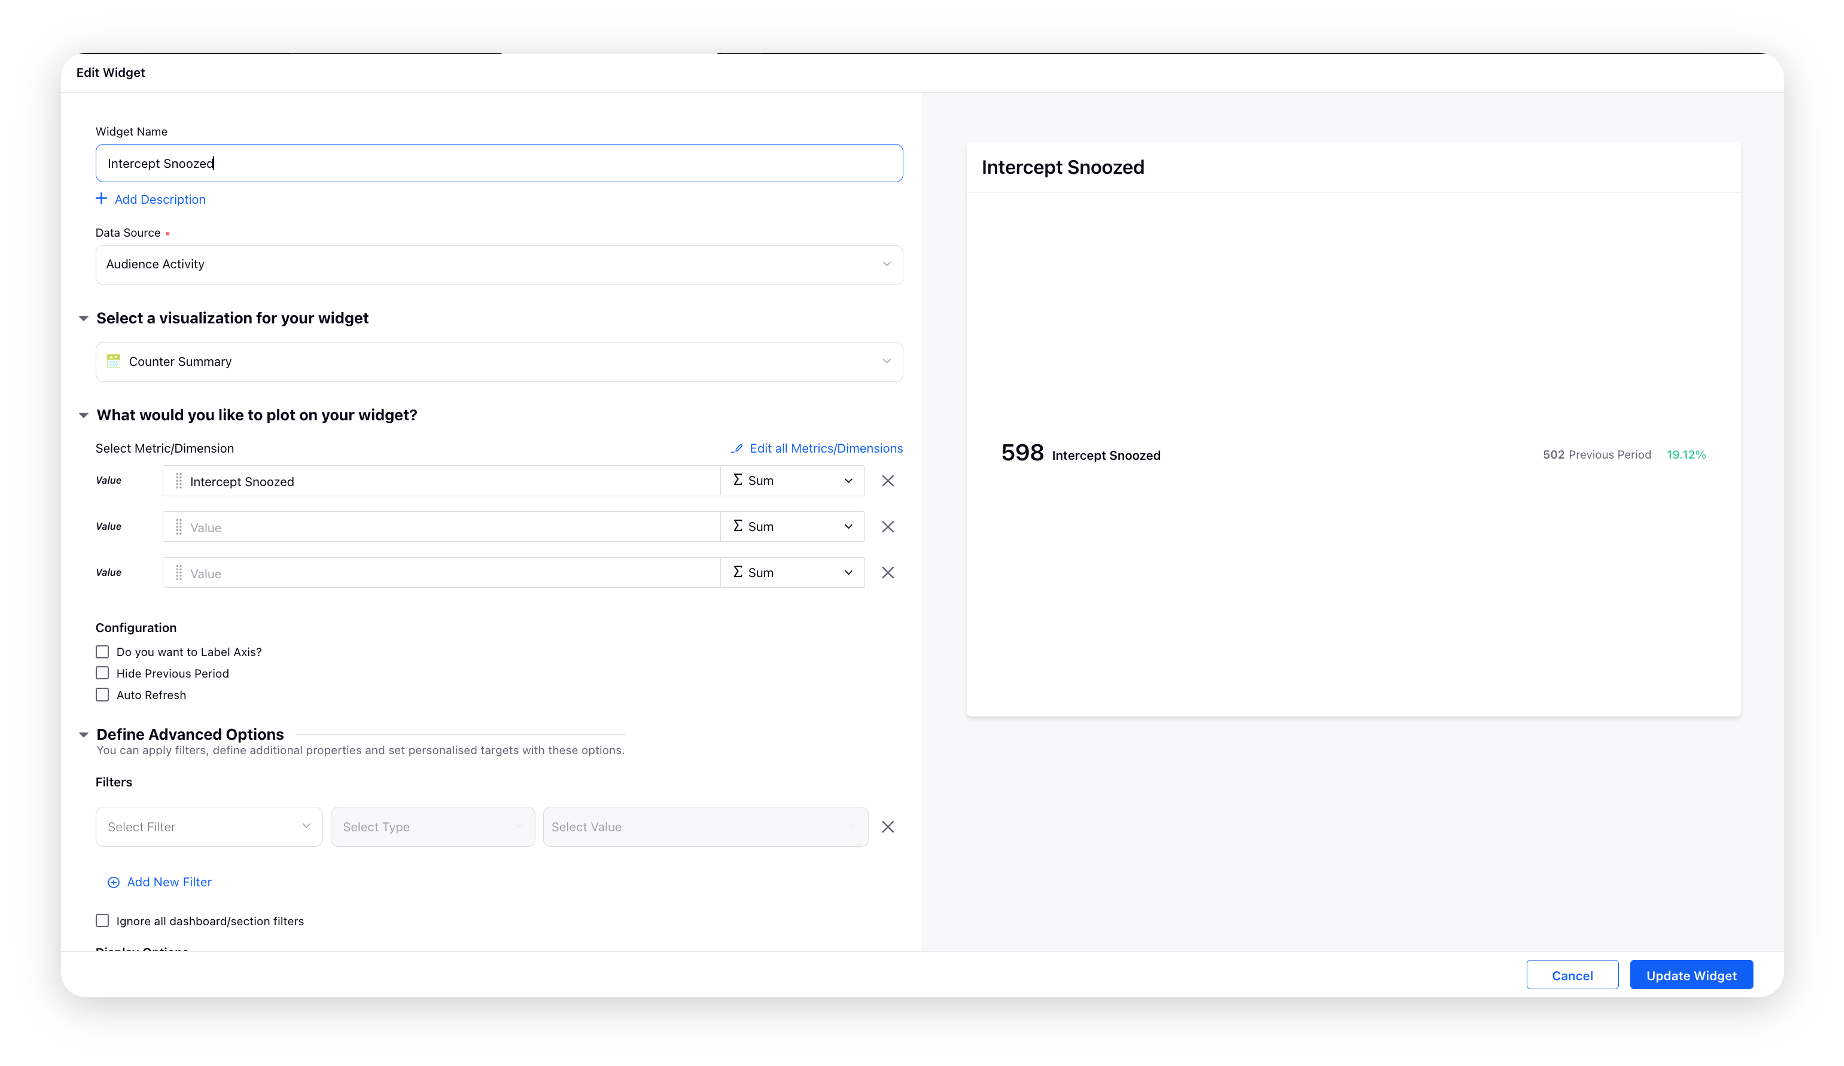
Intercept Snoozed
Number of times the Intercept was snoozed (when the user clicks on Snooze button in popup).
Create a Counter Summary widget and select the Intercept Snoozed custom metric.
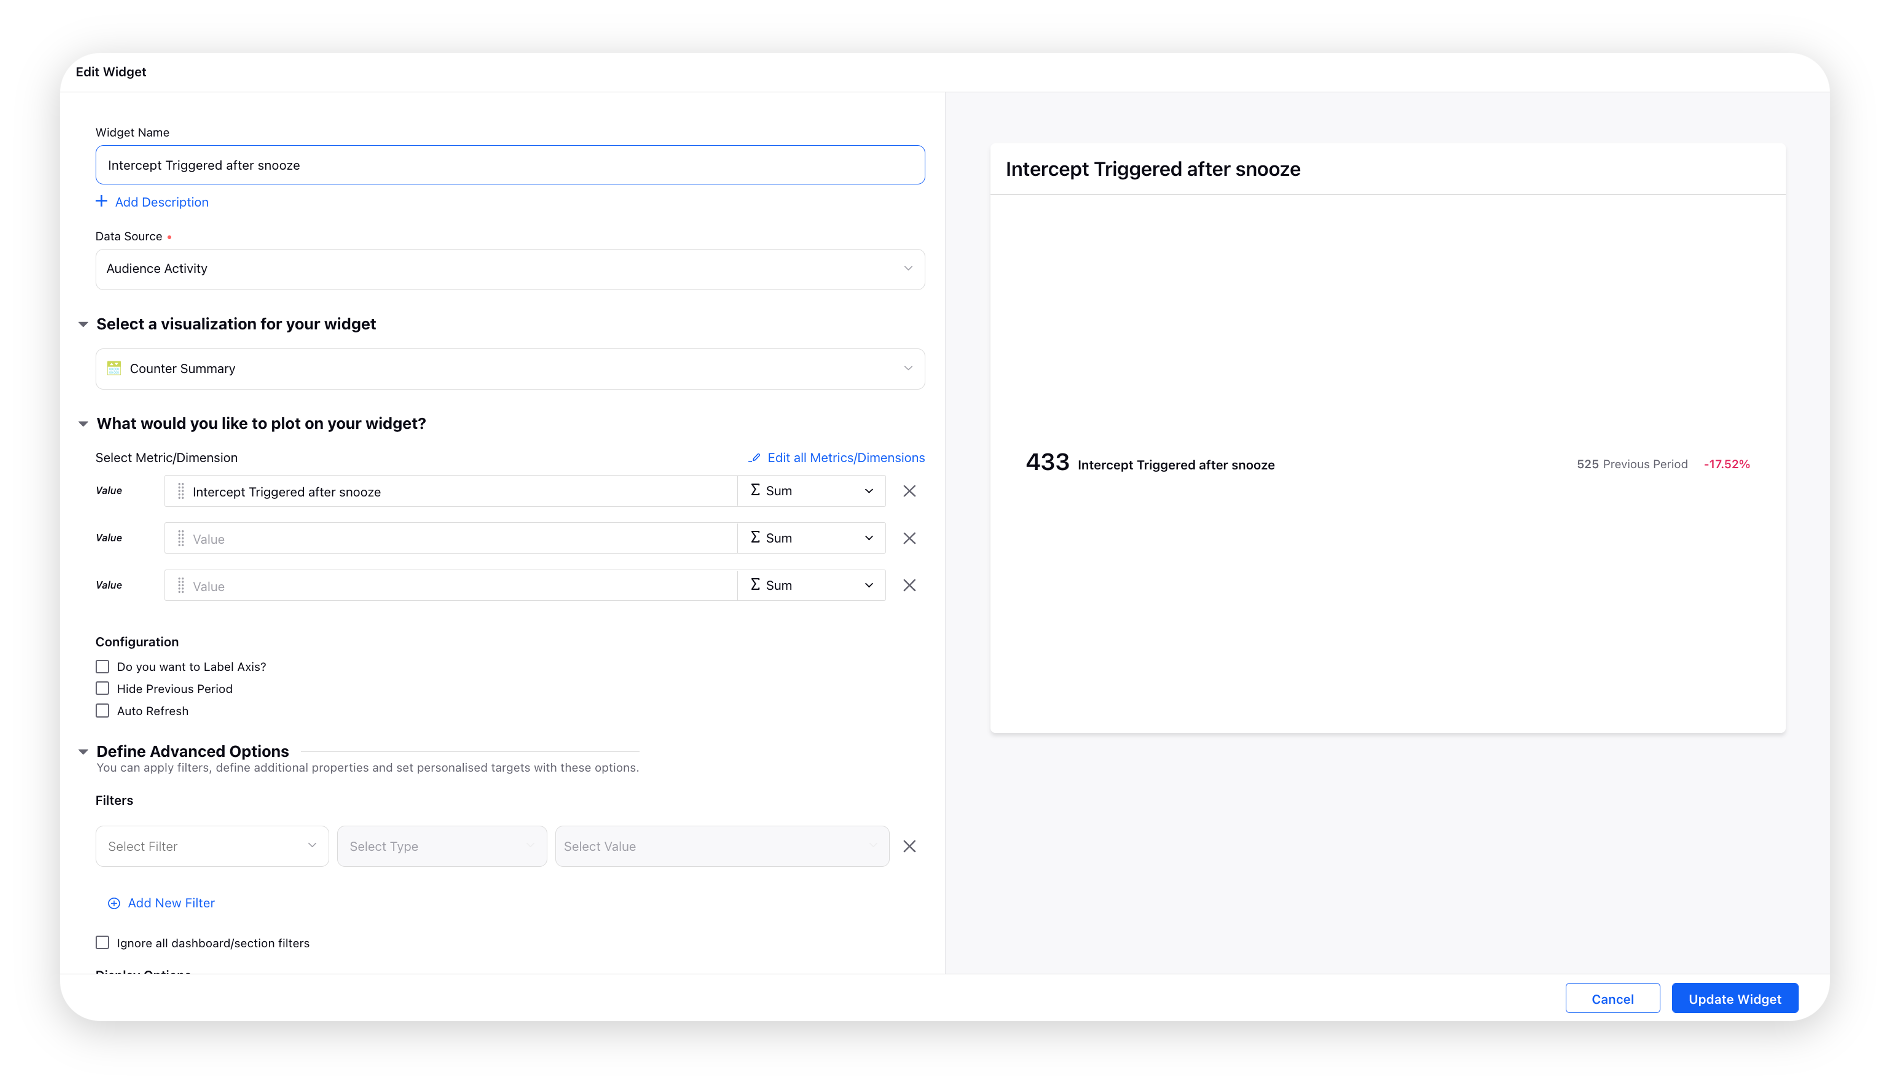
Intercept Triggered after Snooze
Number of times the Intercept is shown after the user has pressed the Snooze button.
Create a Counter Summary widget and select the Intercept Triggered after snooze custom metric.
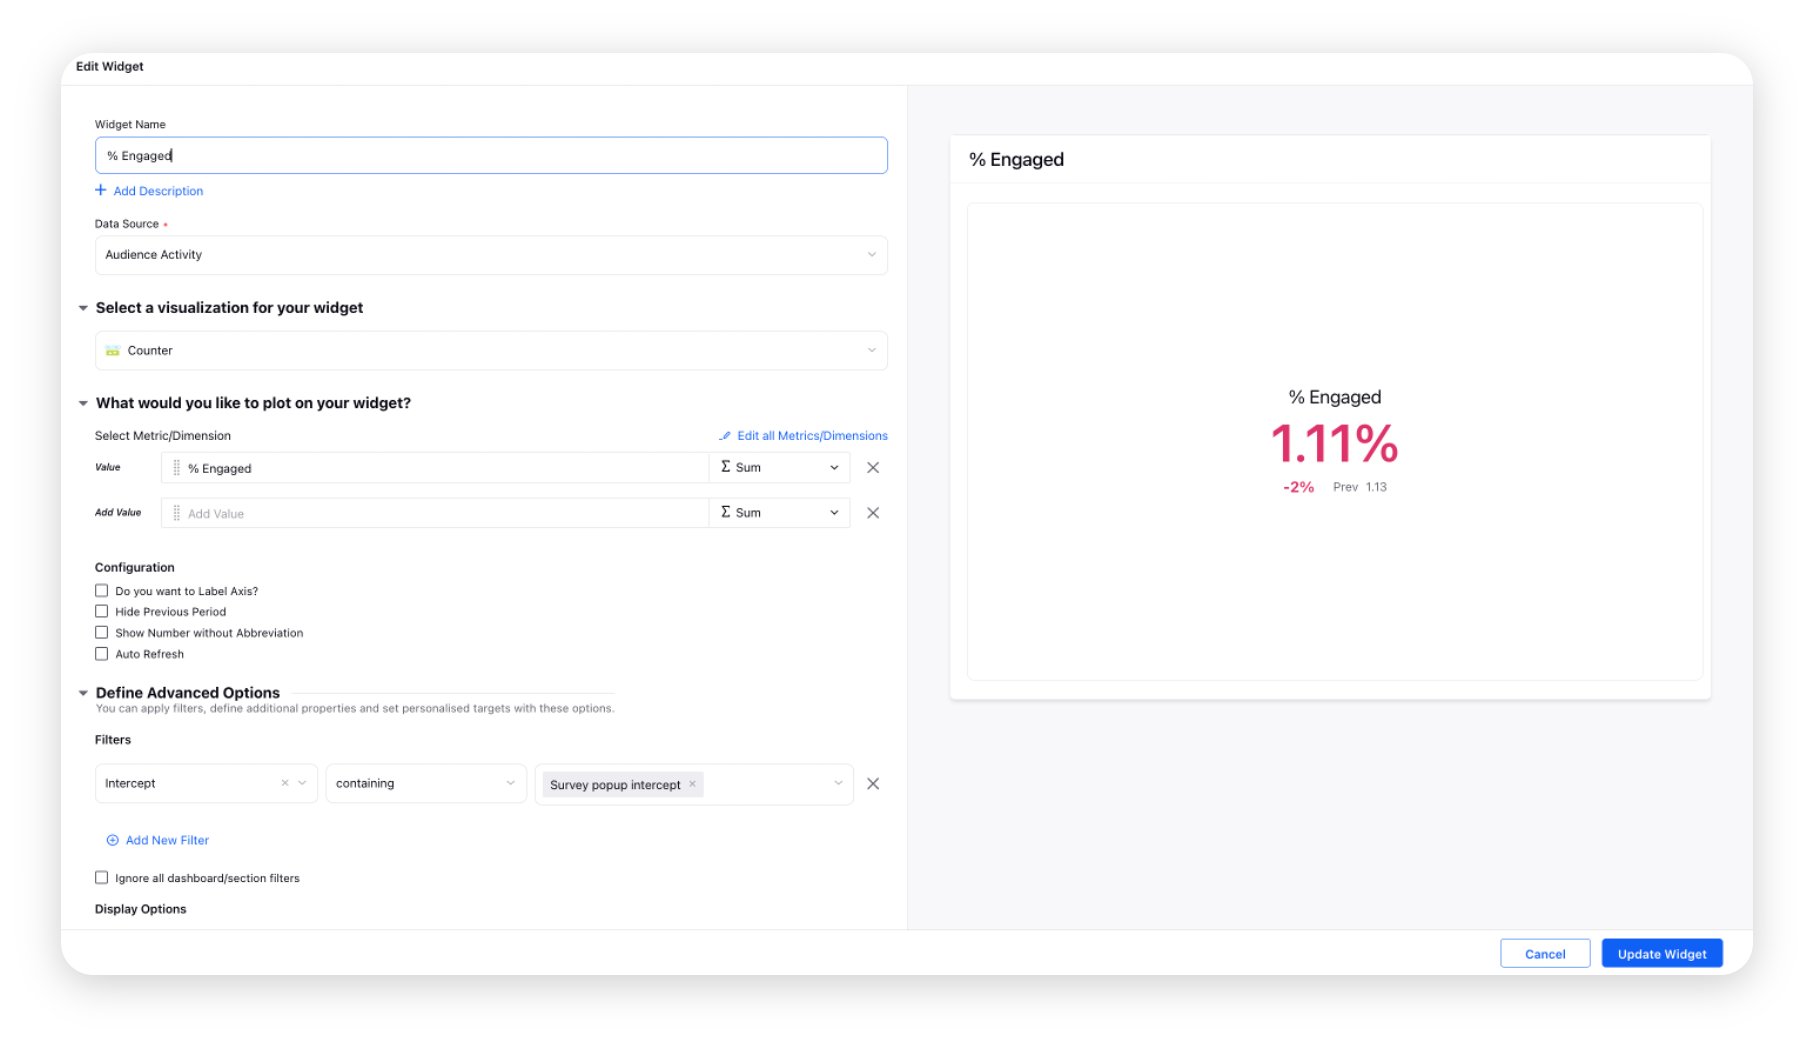
% Engaged
% of CTAs on which any engagement (CTAs) were performed by the customer.
Create a Counter widget. Select the % Engaged custom metric and the desired Survey Intercept from the Filters dropdown.
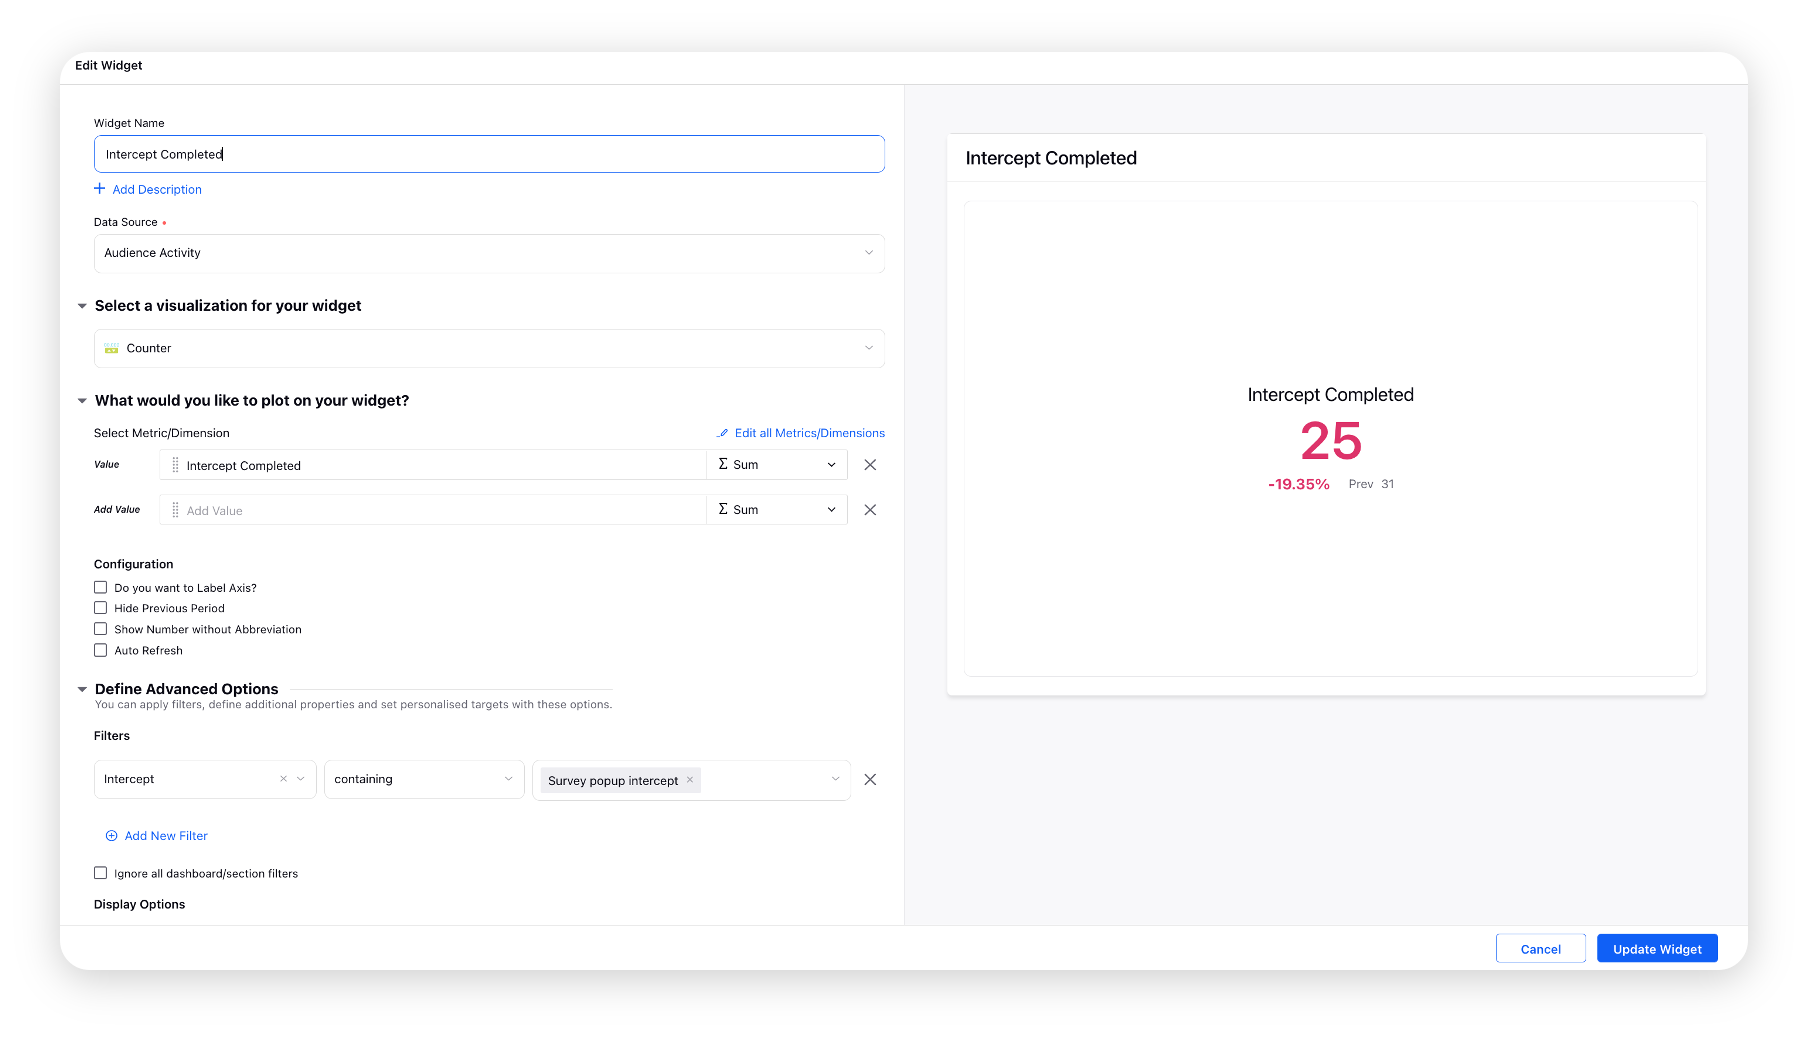
Intercept Completed
Number of surveys completed by users (only applicable in case of survey intercepts).
Create a Counter widget. Select the Intercept Completed custom metric and the desired Survey Intercept from the Filters dropdown.
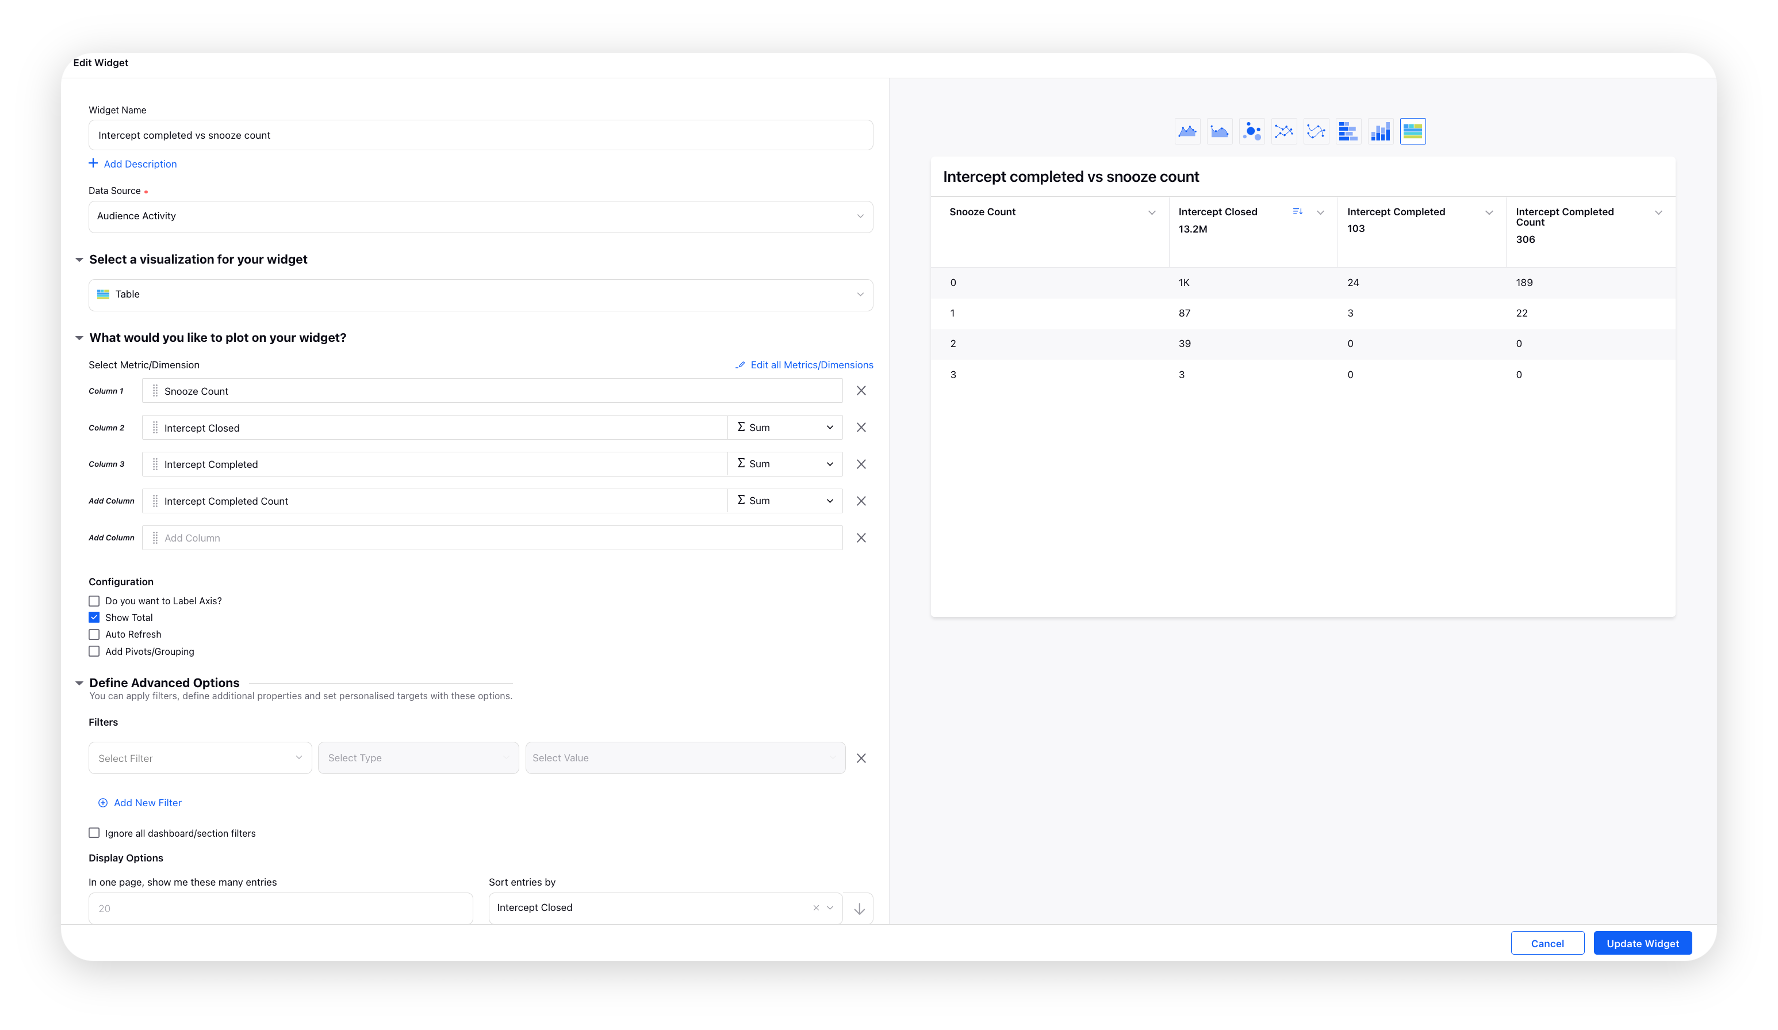
Intercept Completed vs Snooze Count
The number of intercepts distributed by its completion and the snooze count.
Create a Table widget and select the Snooze Count dimension with Intercept Closed, Intercept Completed, and Intercept Completed Count custom metrics.
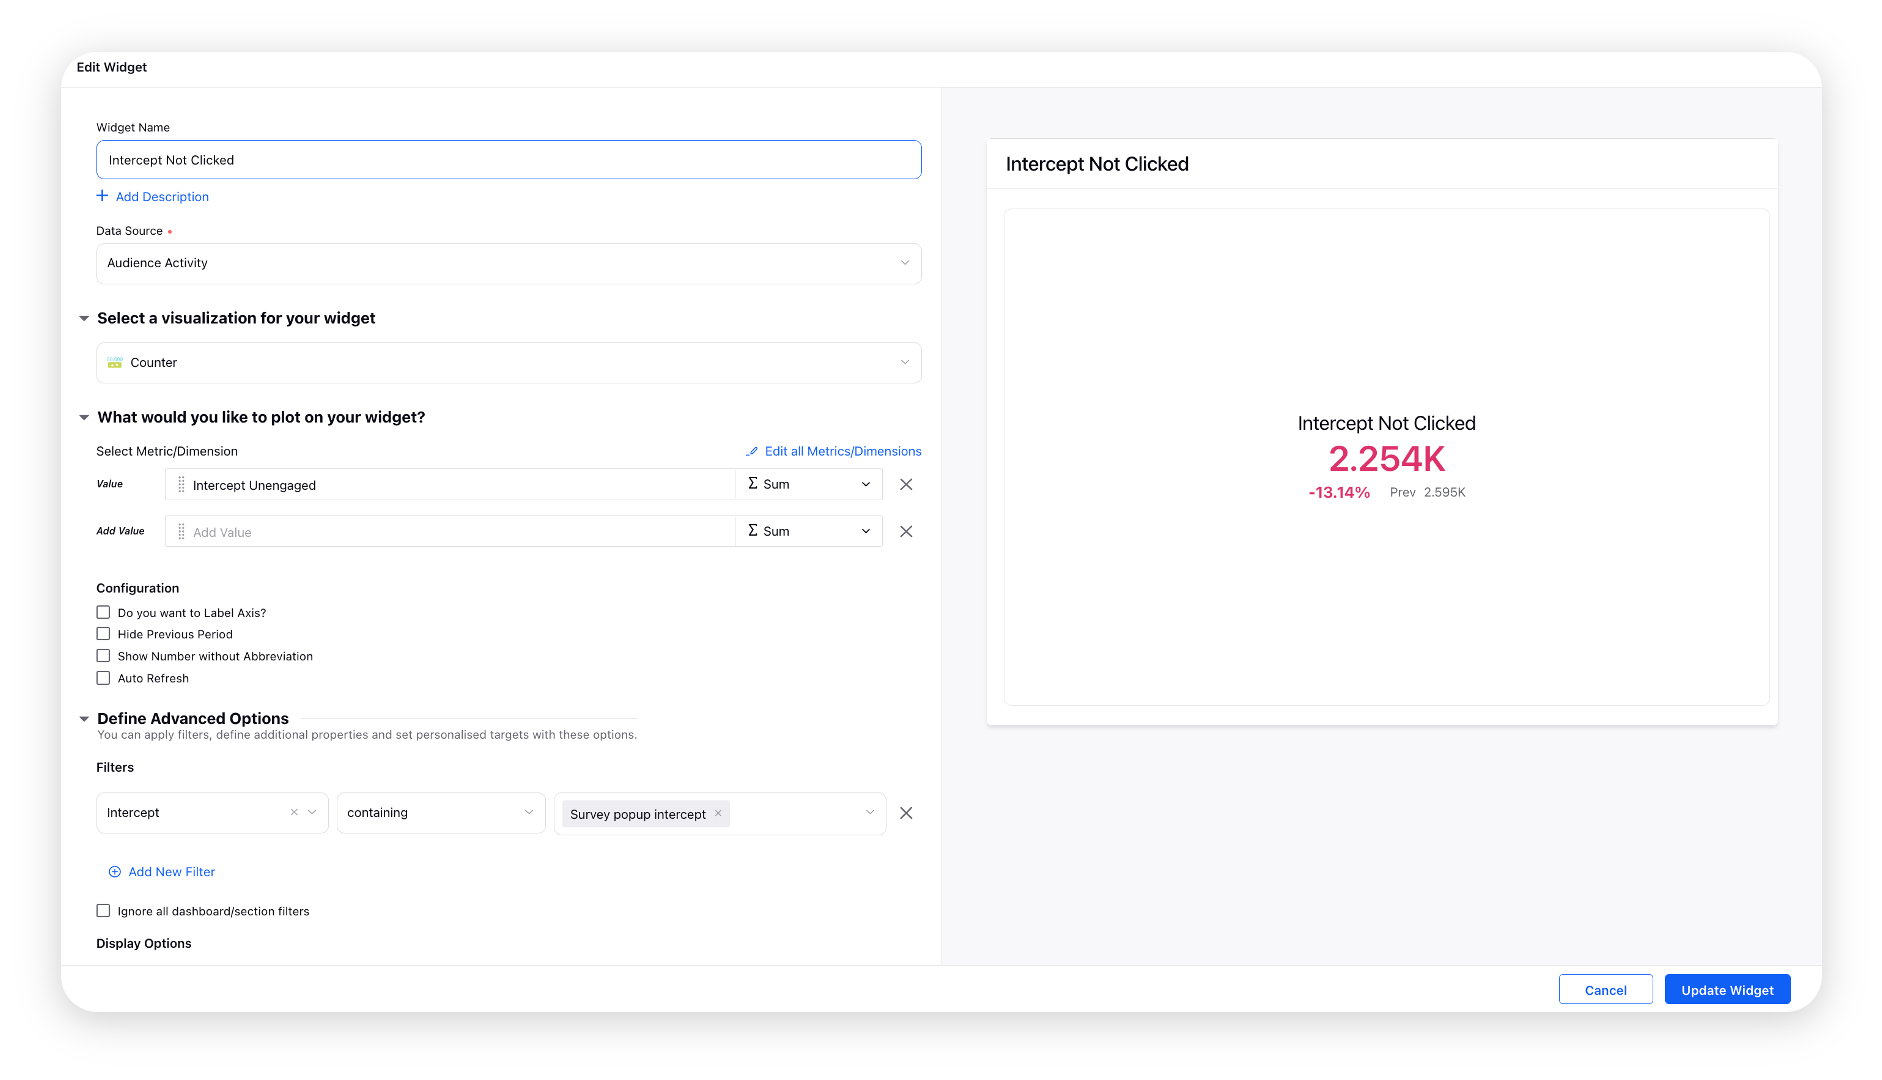
Intercept Not Clicked
The number of times the Intercepts were not clicked.
Create a Counter widget. Select the Intercept Unengaged custom metric and the desired Survey Intercept from the Filters dropdown.
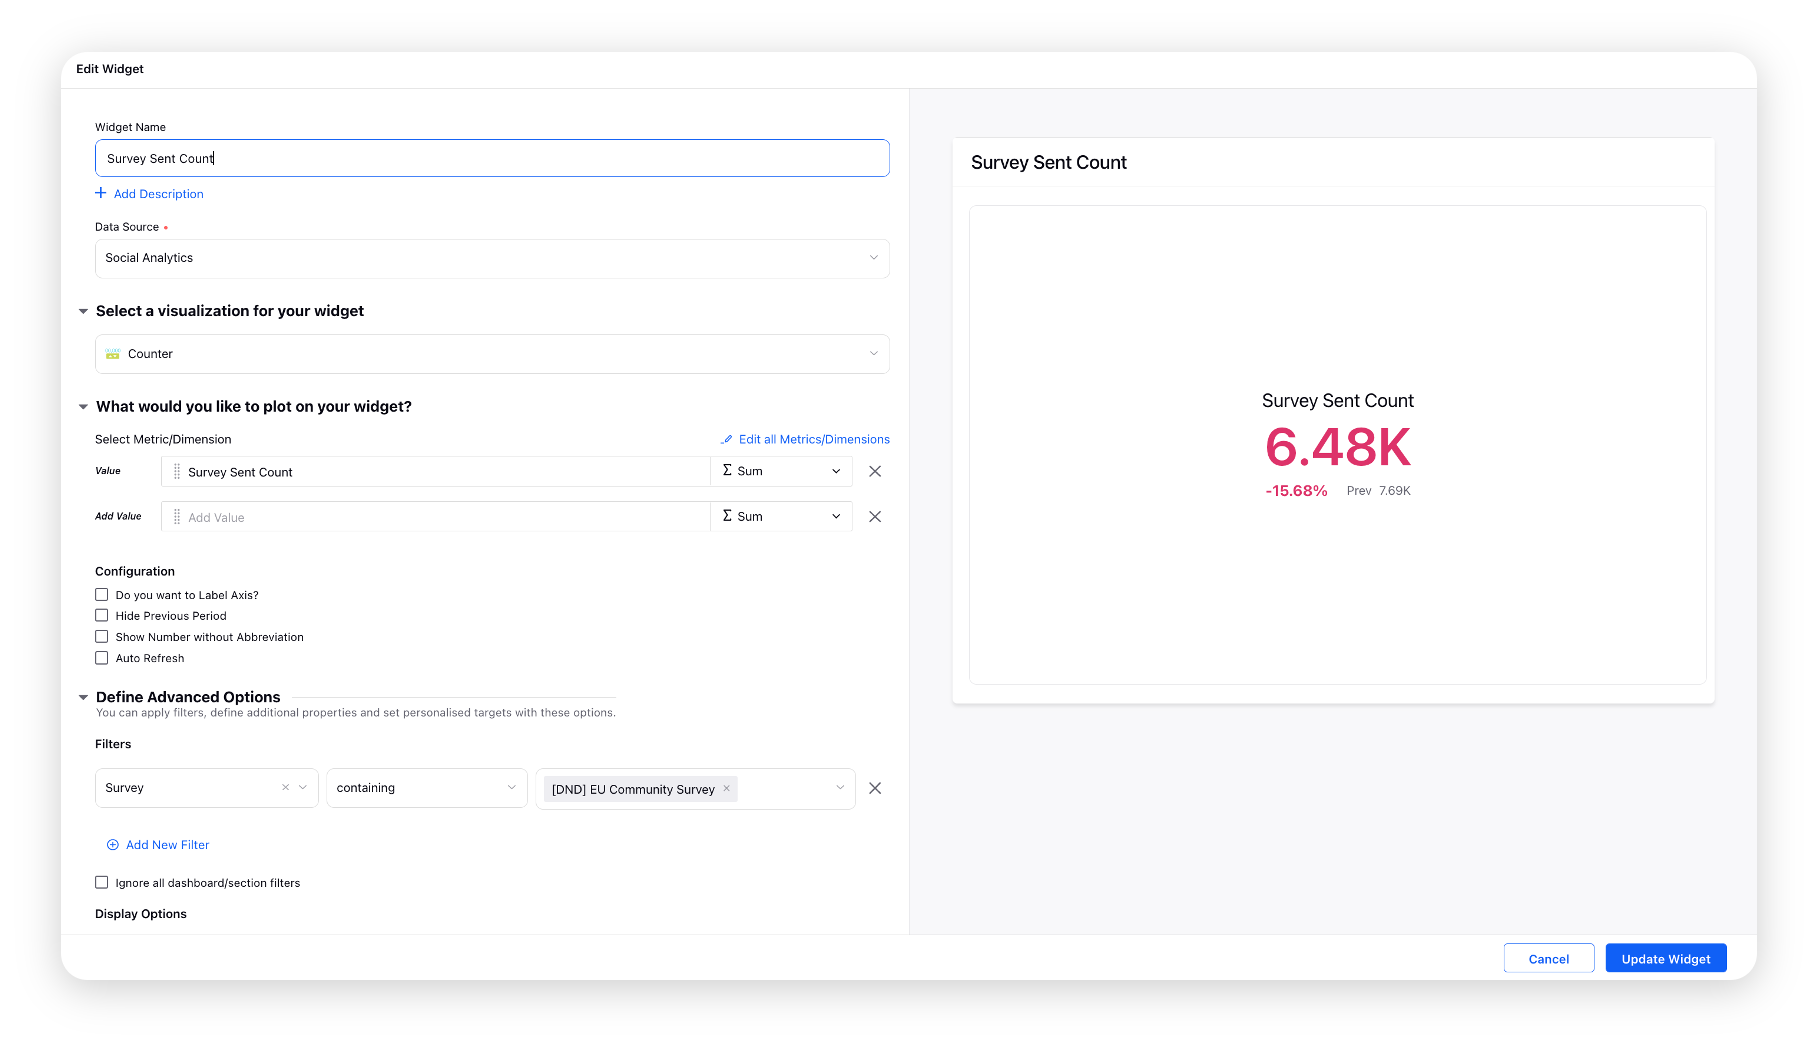
Survey Sent Count
Number of Surveys sent to the customer.
Create a Counter widget. Select the Survey Sent Count metric and the desired Survey from the Filters dropdown.
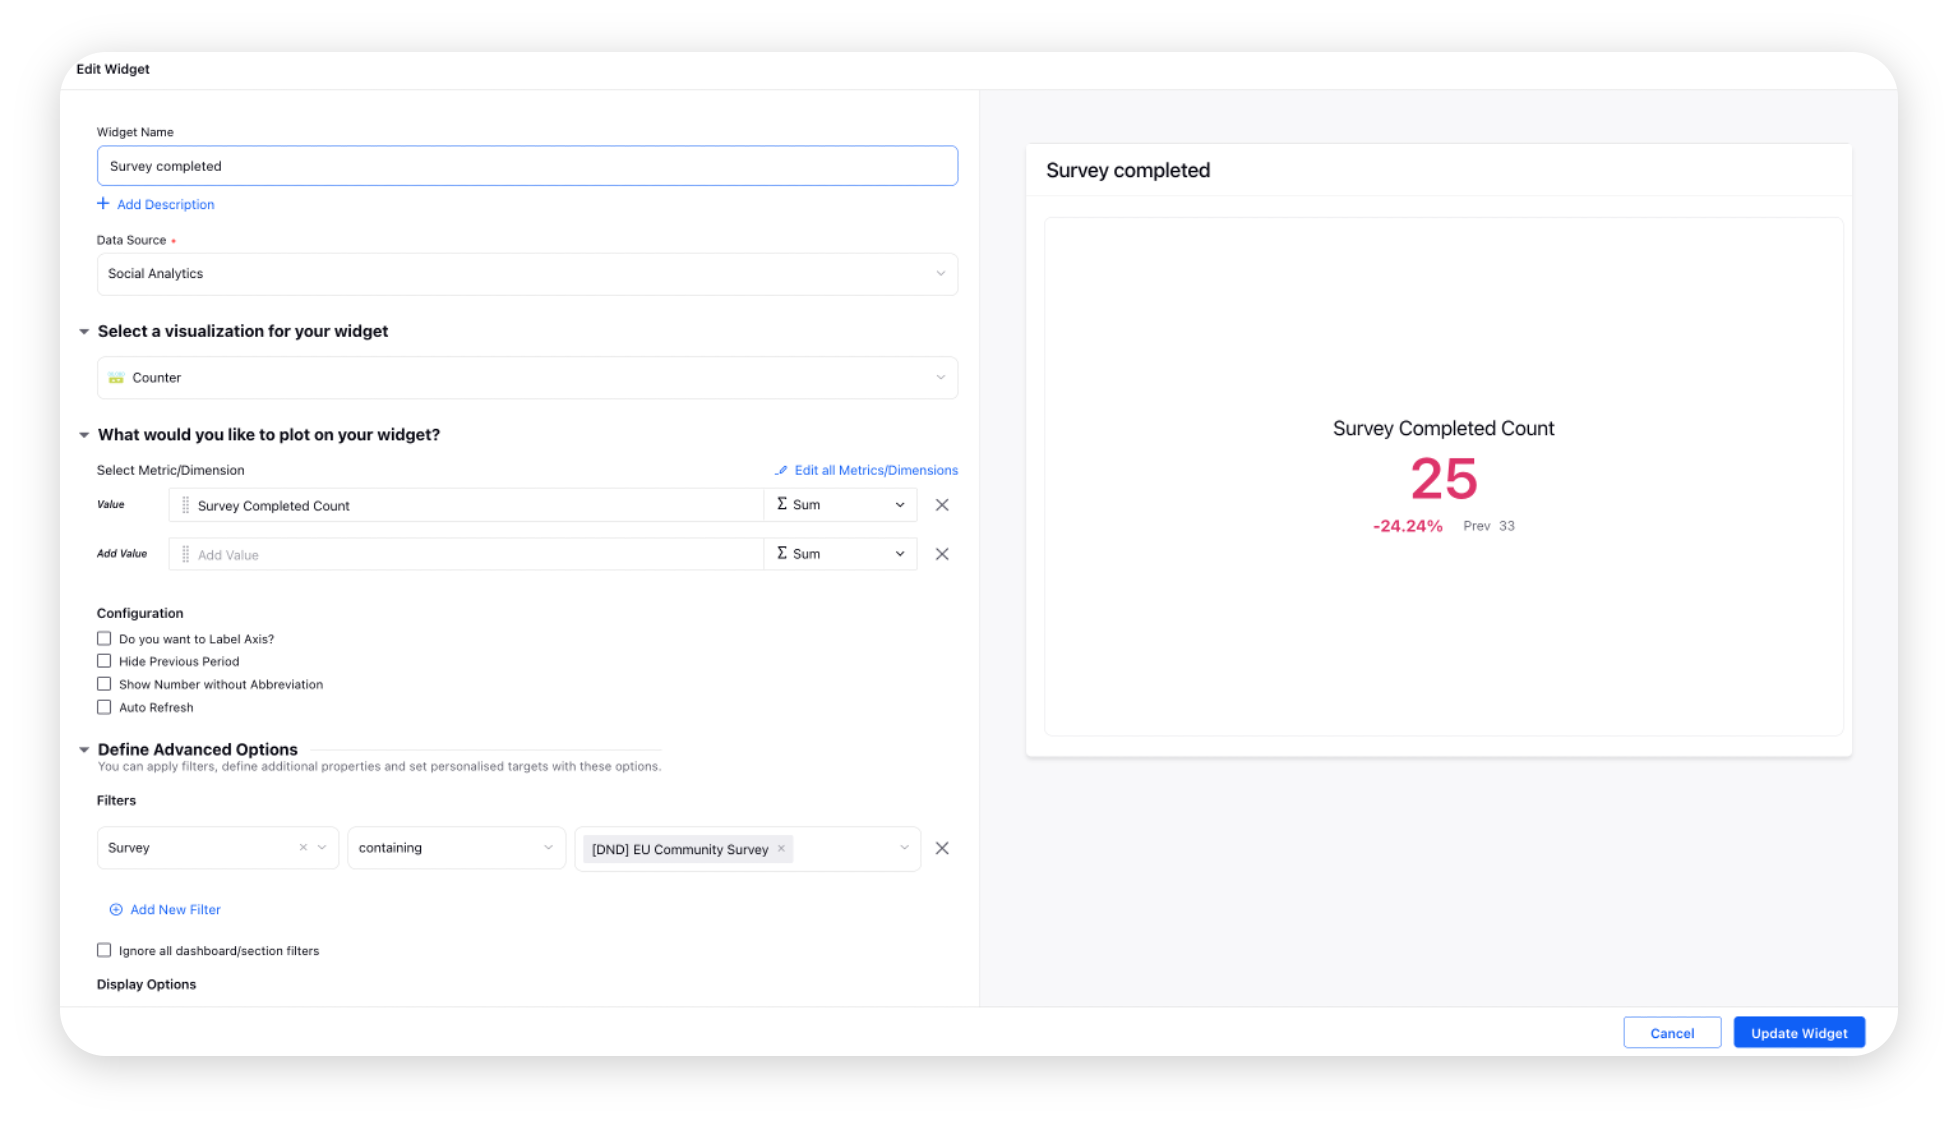
Survey Completed
Number of Surveys completed by the users after using the Live Chat app to connect with an agent.
Create a Counter widget. Select the Suvey Completed Count metric and the desired Survey from the Filters dropdown.
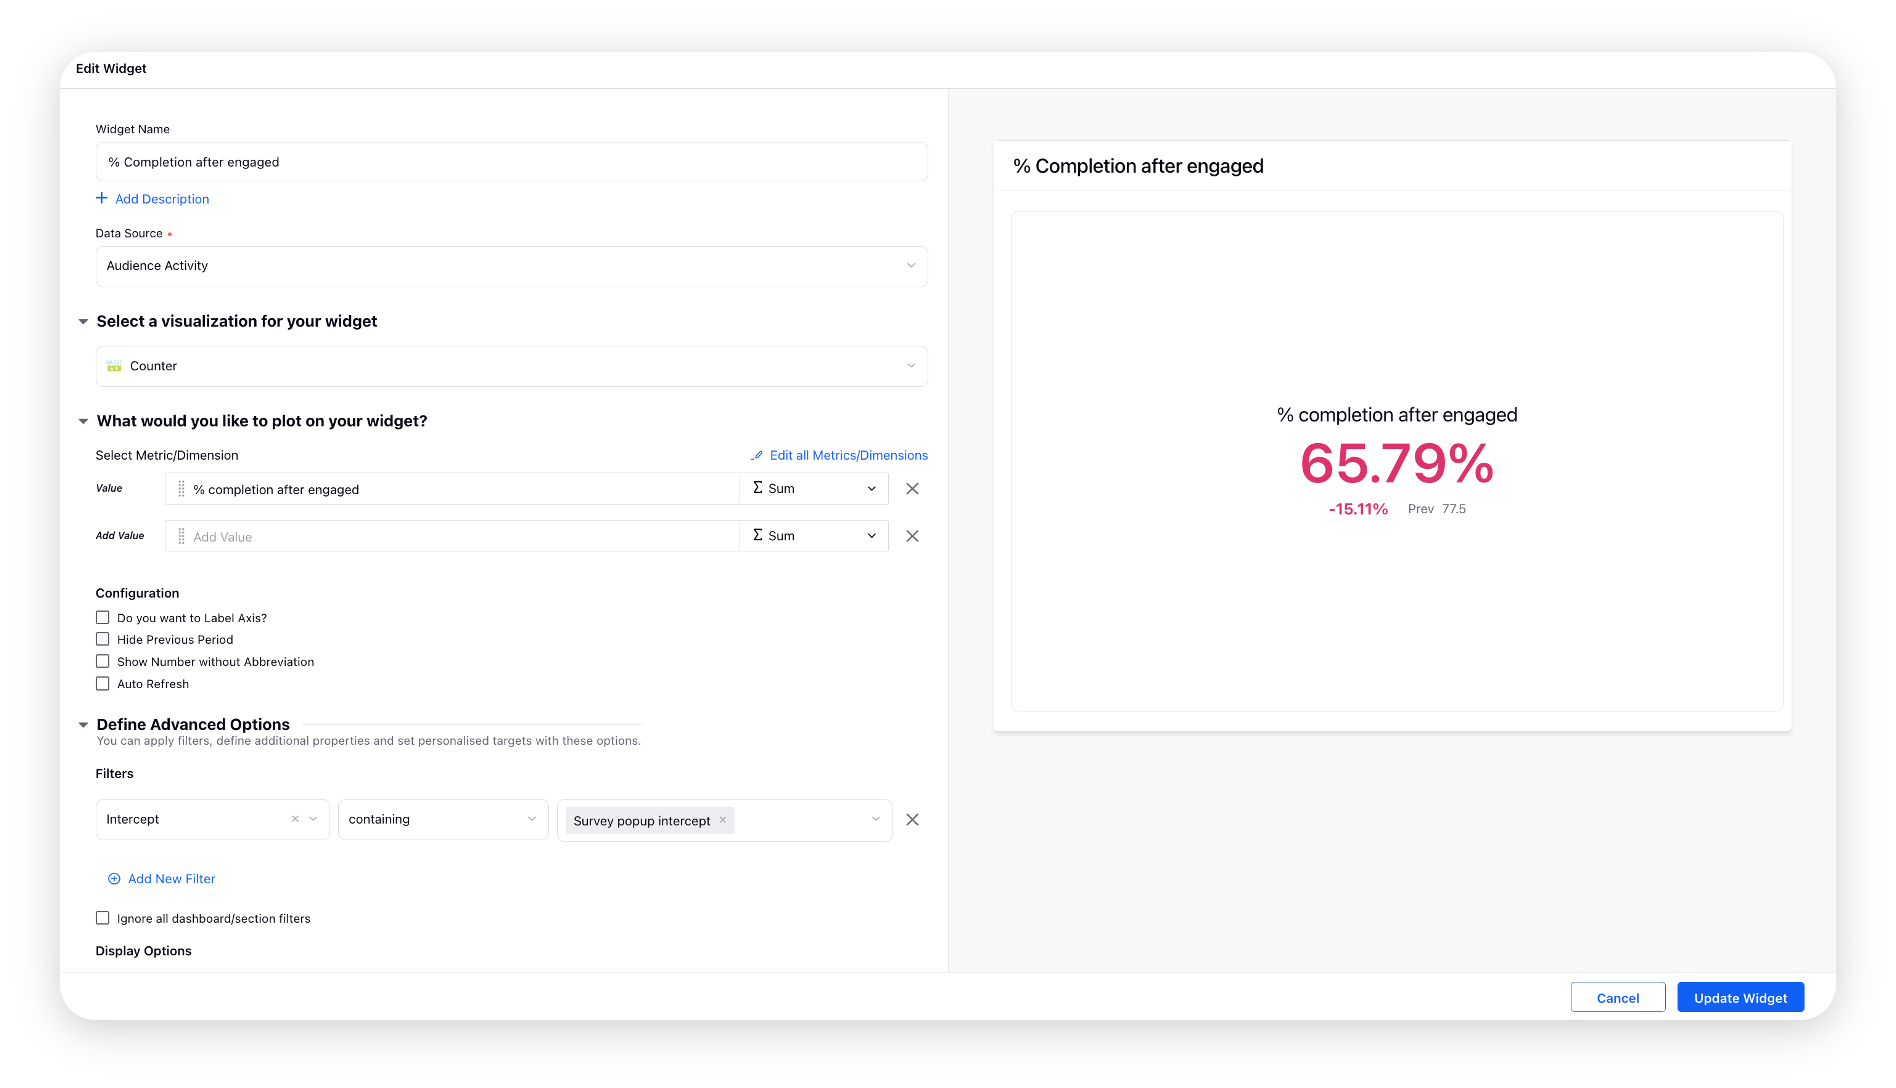
% Completion after Engaged
Percentage of users who were able to complete the Intercepts such as clicking the Live Chat application or closing it after being engaged on Live Chat.
Create a Counter widget. Select the % completion after engaged custom metric and the desired Survey Intercept from the Filters dropdown.
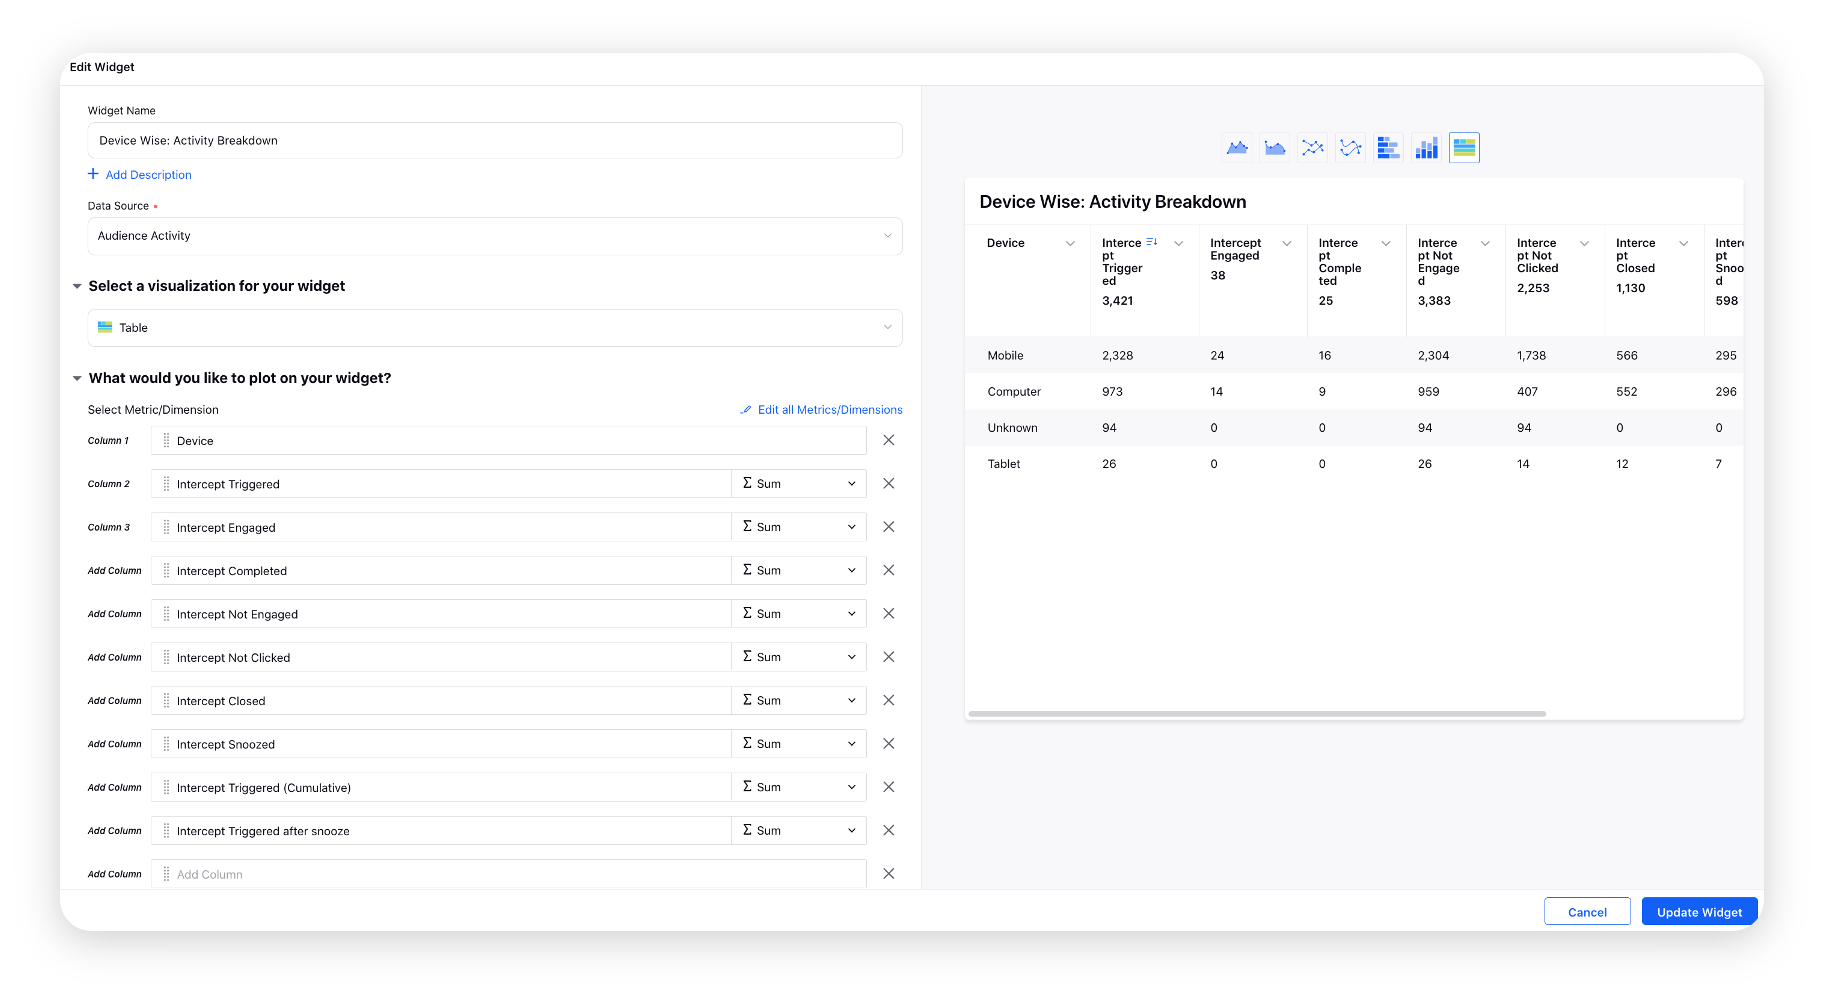
Intercept activities distributed by devices.
Create a Table widget. Select the Device dimension with Intercept Triggered, Intercept Engaged, Intercept Completed, Intercept Not Engaged, Intercept Not Clicked, Intercept Closed, Intercept Snoozed, Intercept Triggered (Cumulative), Intercept Triggered after snooze custom metrics. Next, select the desired Survey Intercept from the Filters dropdown.
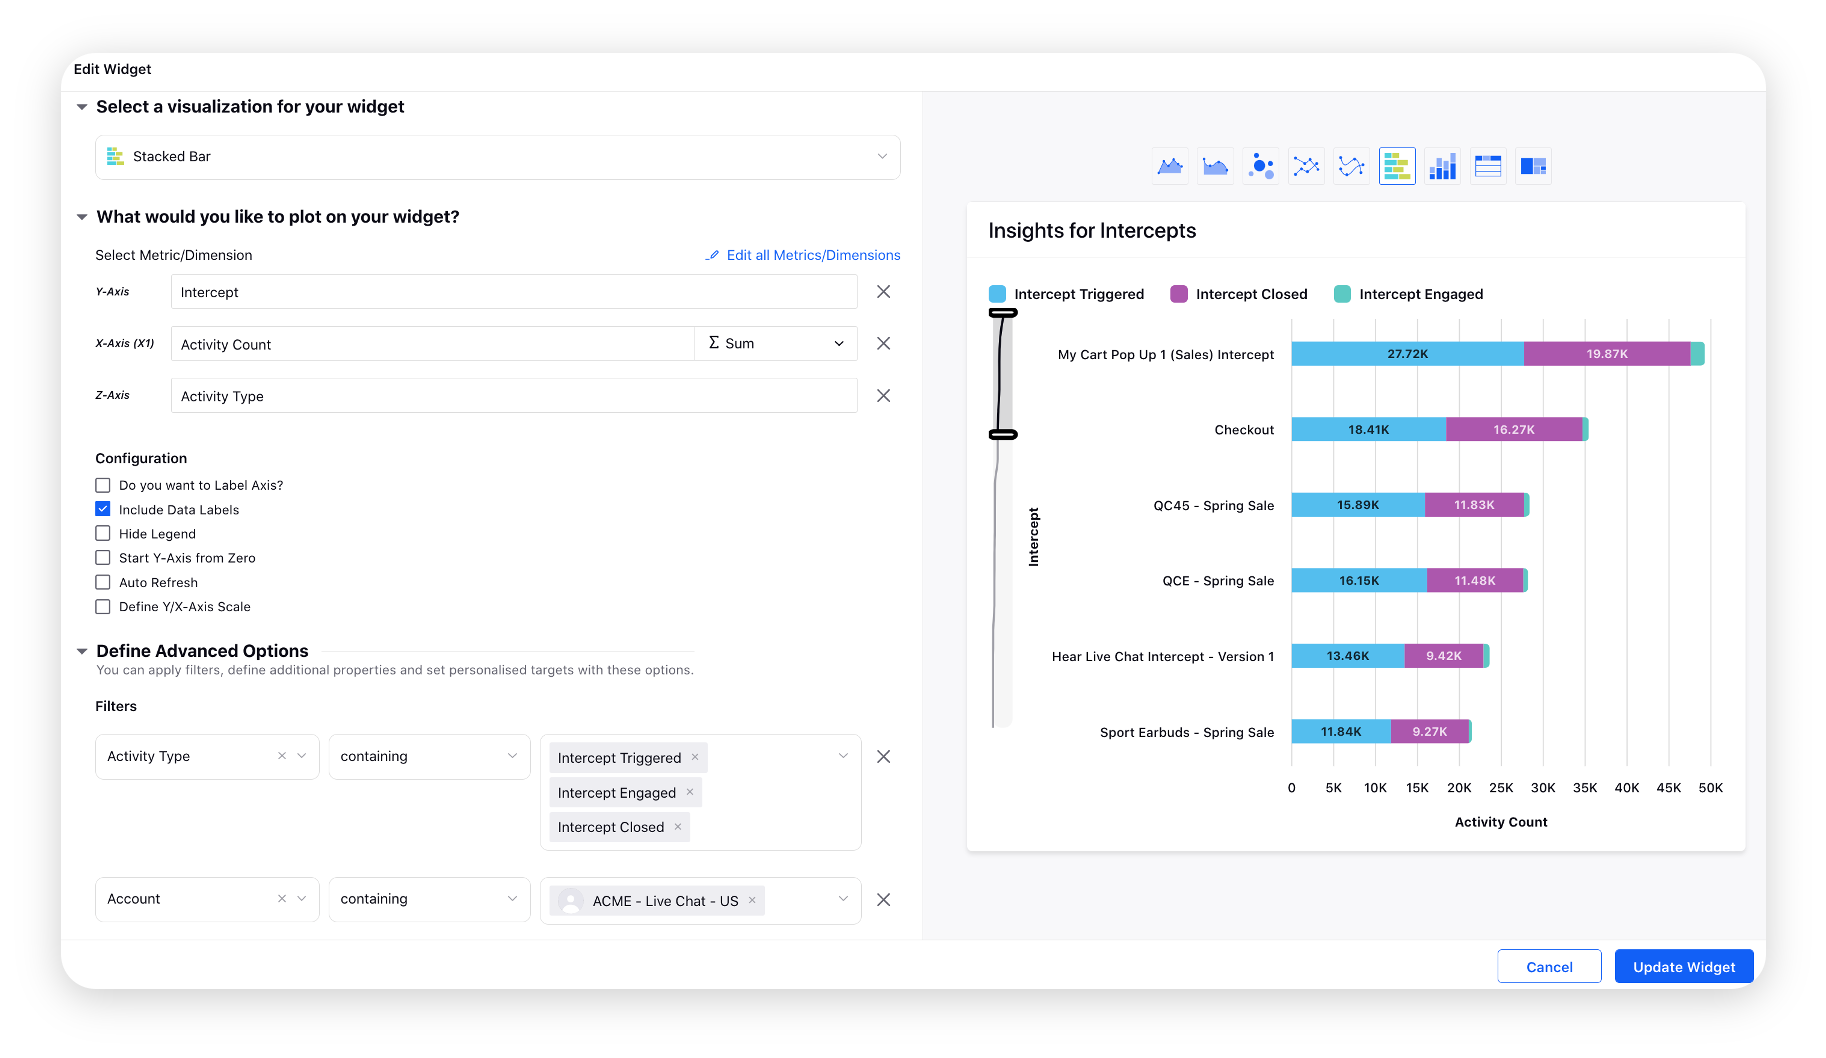
Insights for Intercepts
Intercepts distributed by insights such as triggered, closed, and engaged.
Create a Stacked Bar widget. Select the Activity Count metric with Intercept and Activity Type dimensions. Next, select the desired Activity Type and Account from the Filters dropdown.
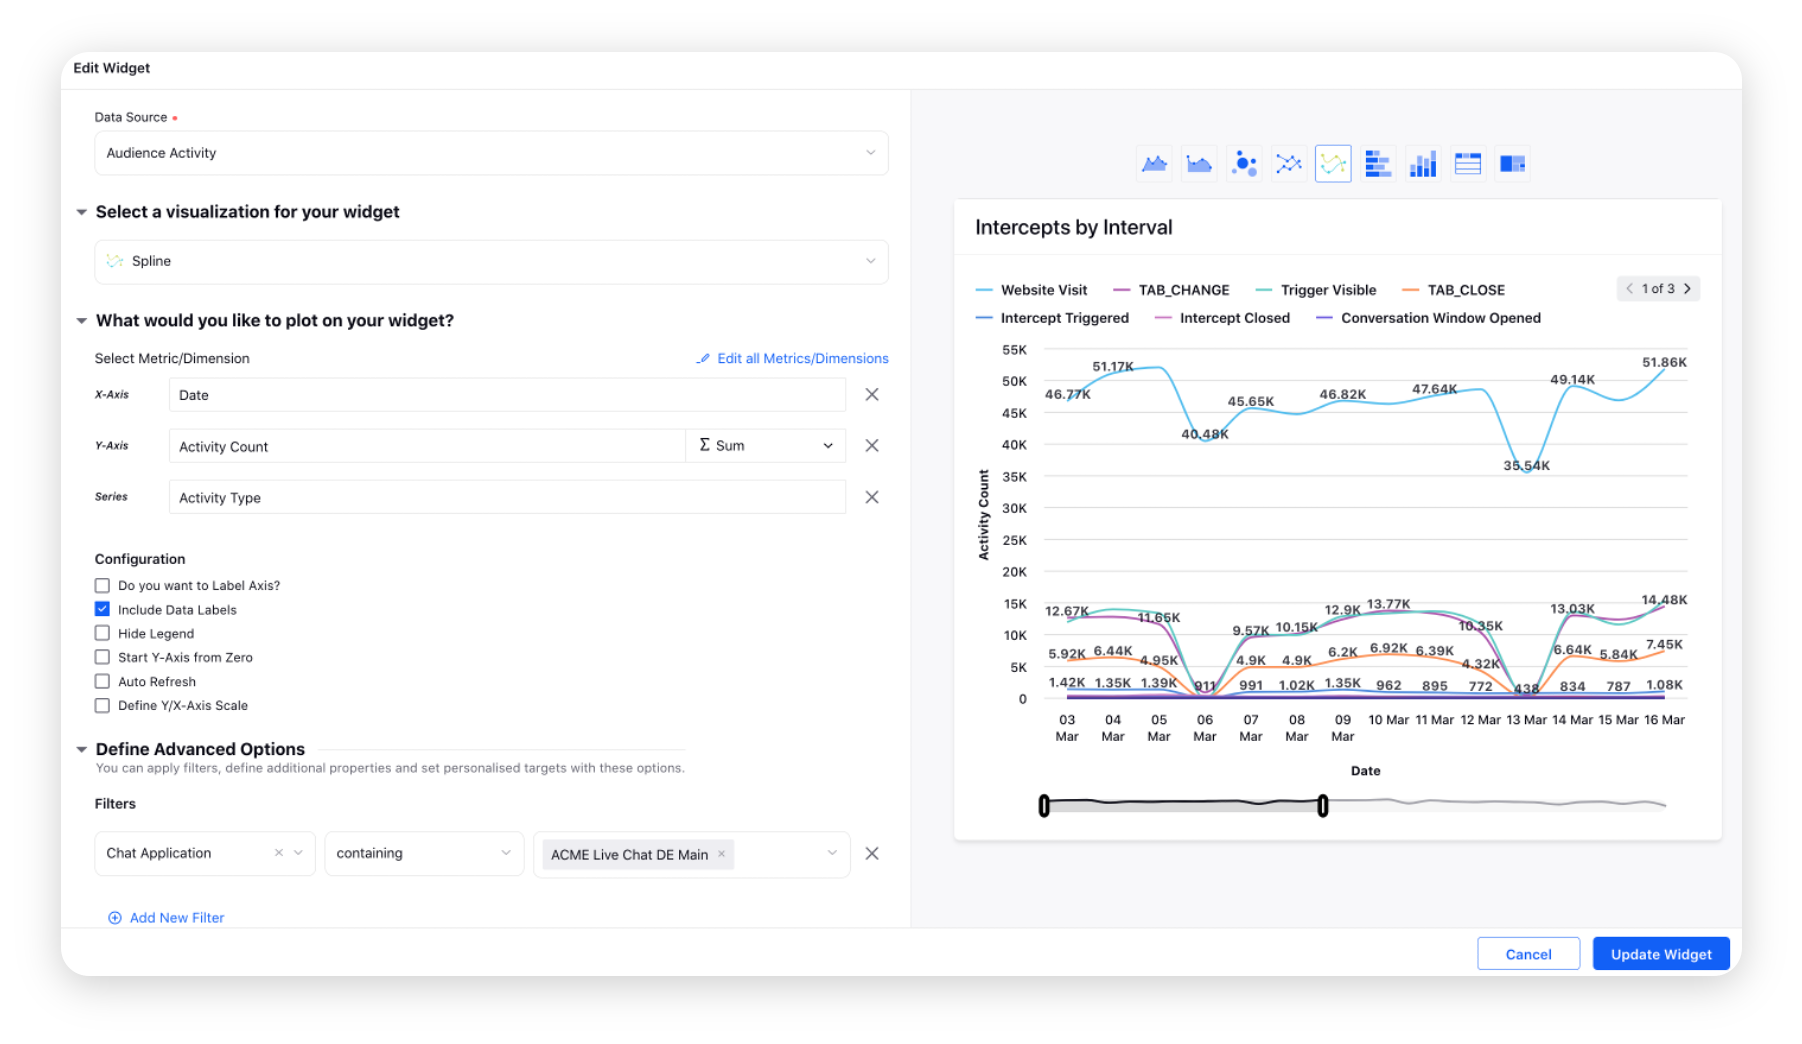
Intercepts by Interval
Number of Intercepts distributed by an interval.
Create a Spline widget. Select the Activity Count metric with Date and Activity Type dimensions. Next, select the desired Chat Application from the Filters dropdown.
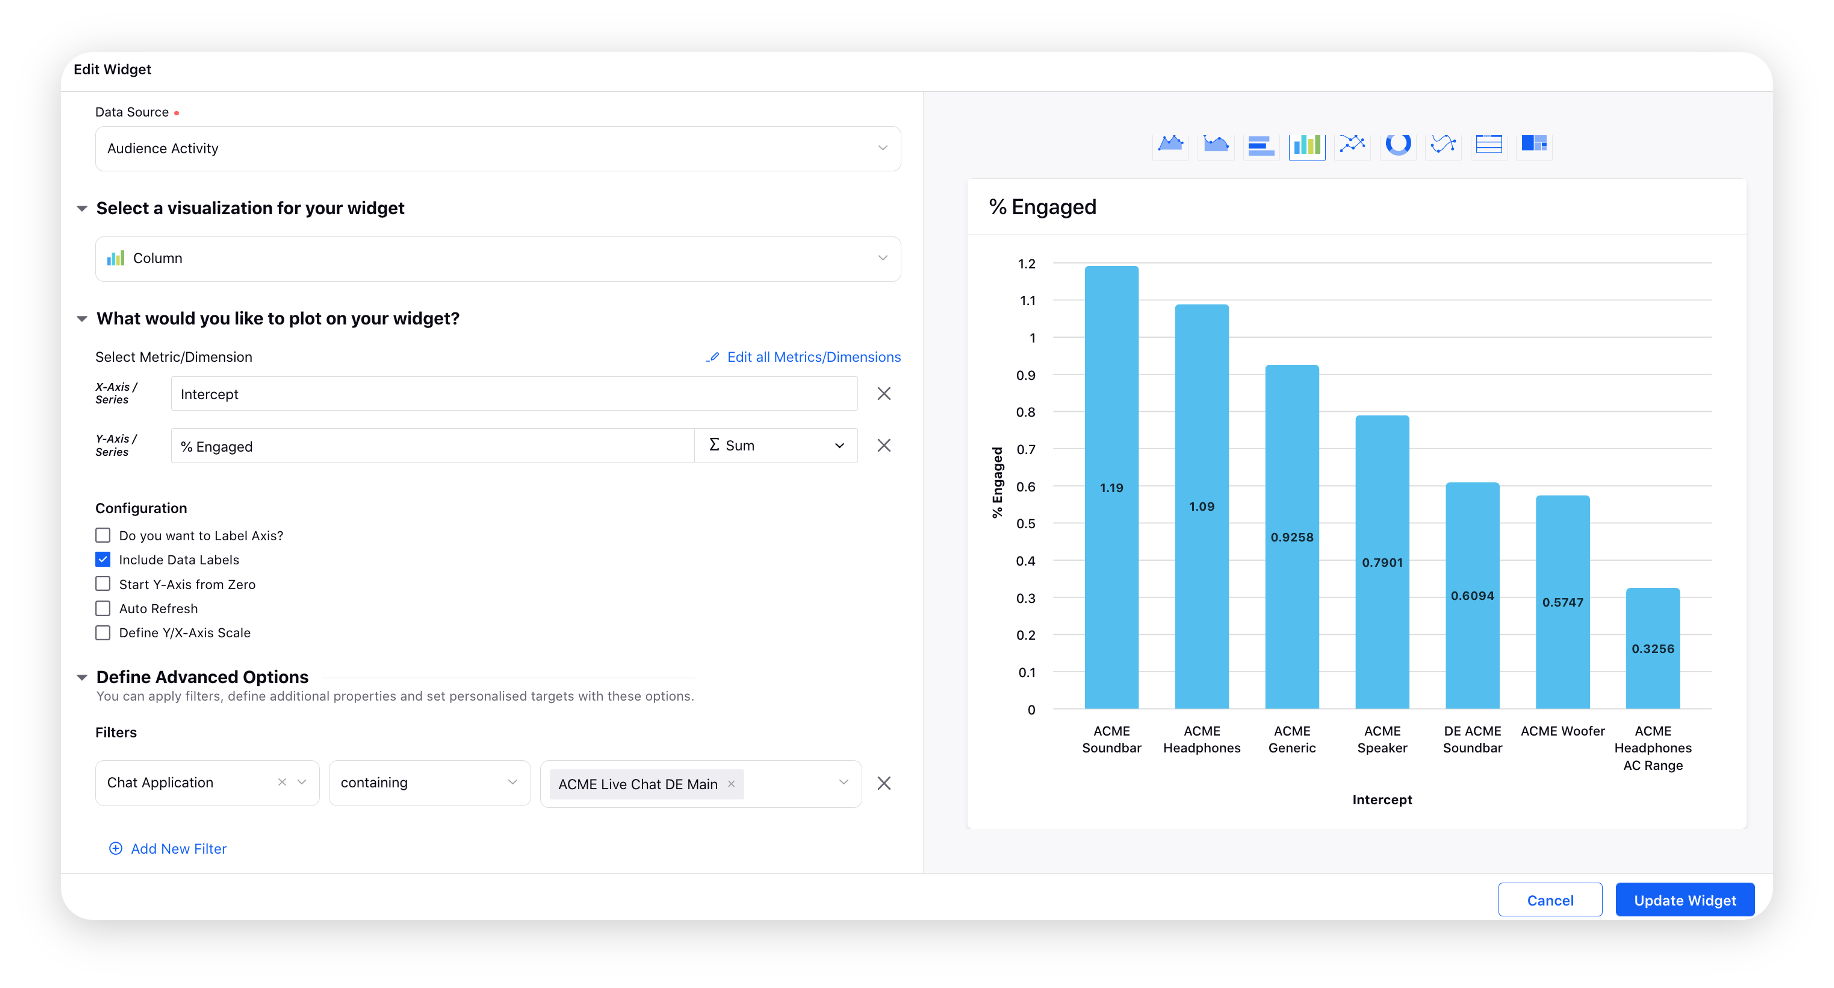
Intercept % Engaged
Percentage of users engaged on the number of Intercepts triggered.
Create a Column widget. Select the % Engaged custom metric with the Intercept dimension. Next, select the desired Chat Application from the Filters dropdown.
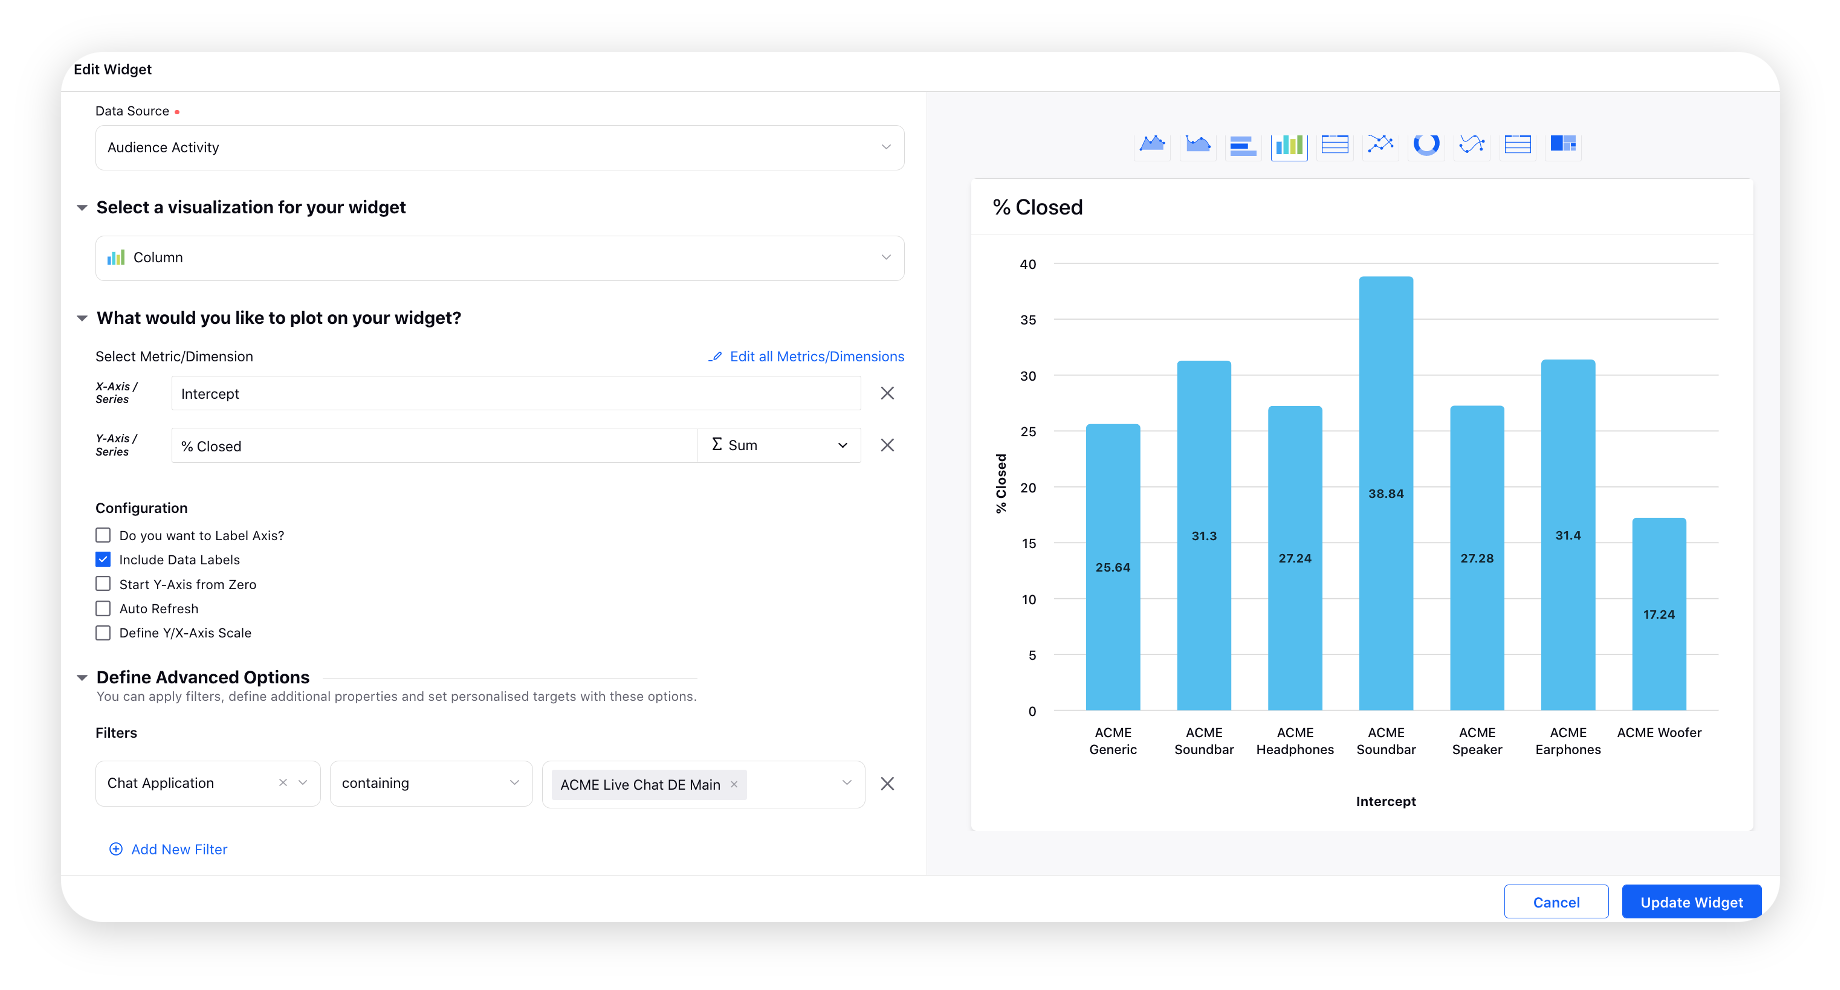
Intercept % Closed
Number of intercepts closed/ total number of intercepts shown to the user.
Create a Column widget. Select the % Closed custom metric with the Intercept dimension. Next, select the desired Chat Application from the Filters dropdown.
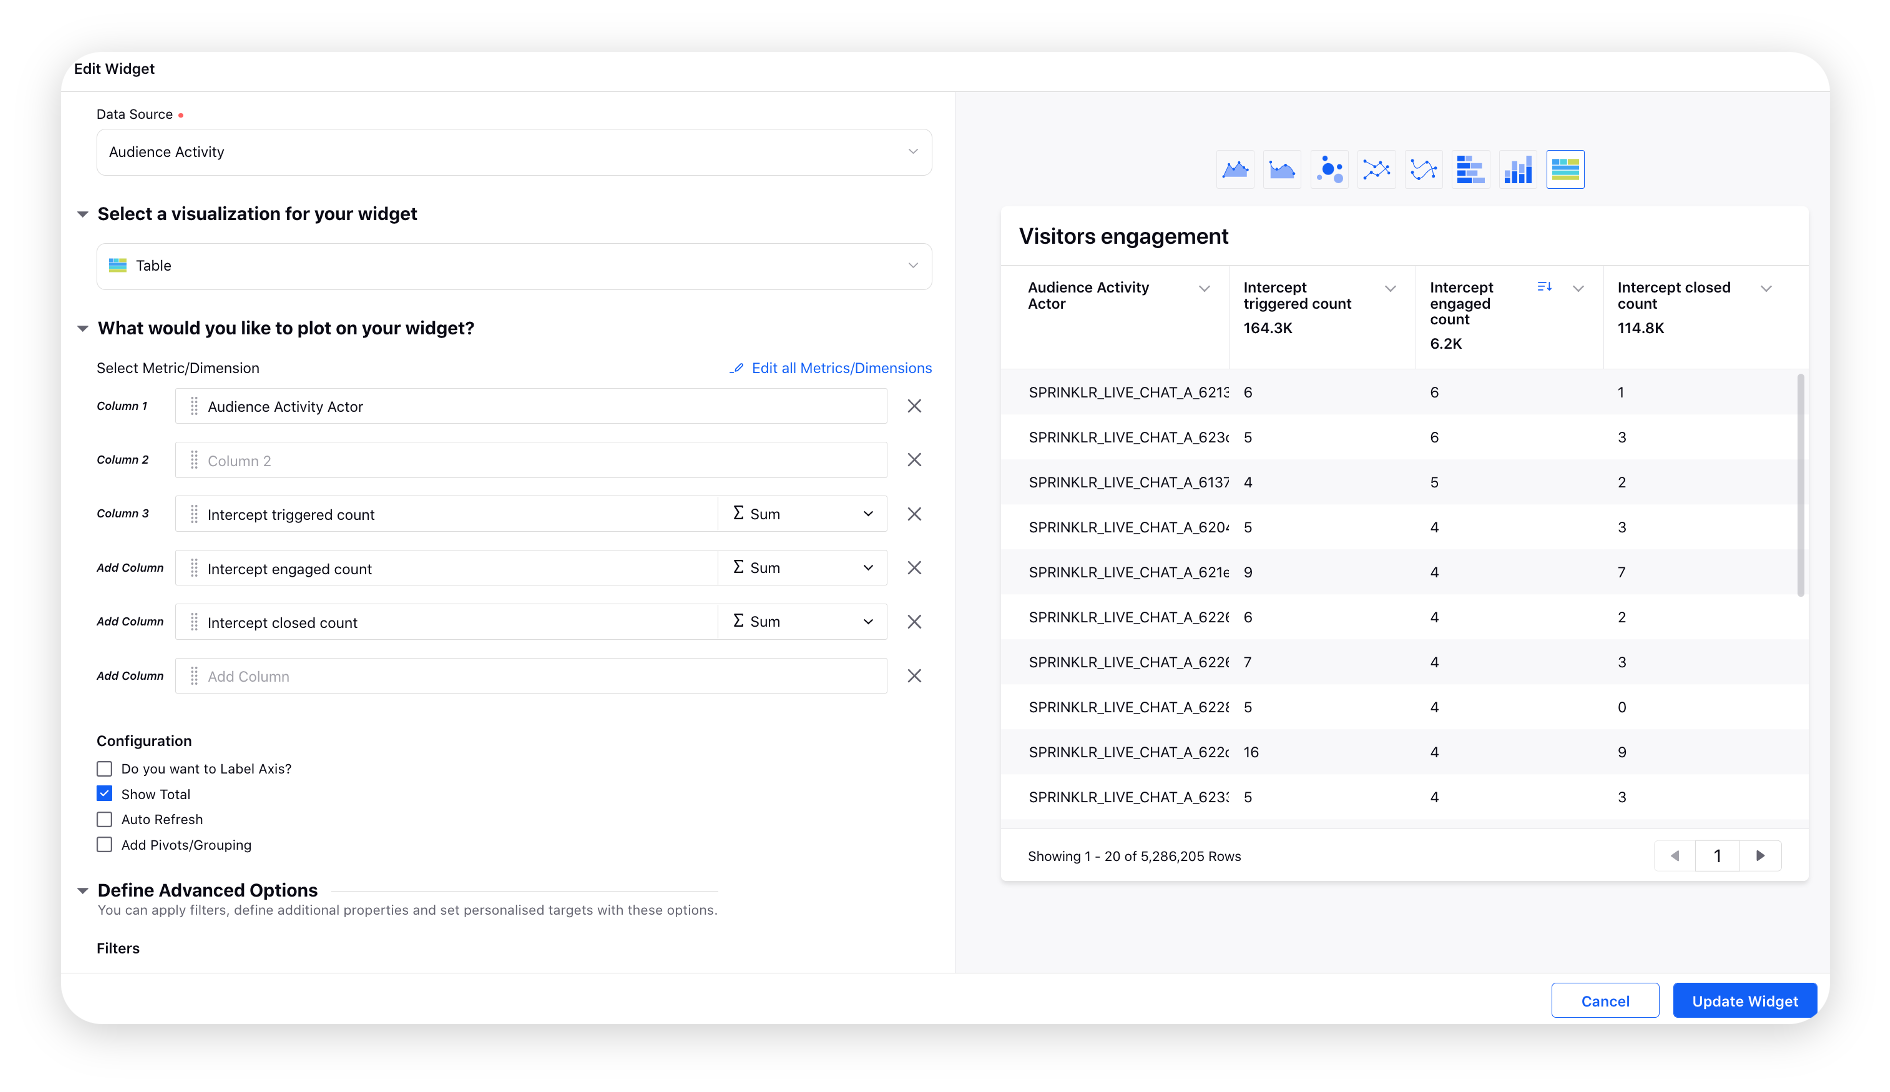
Visitors Engagement
The number of visitor engagements on the Intercepts.
Create a Table widget and select the Intercept Triggered Count, Intercept Engaged Count, and Intercept Closed Count metrics with Audience Activity Actor dimension.
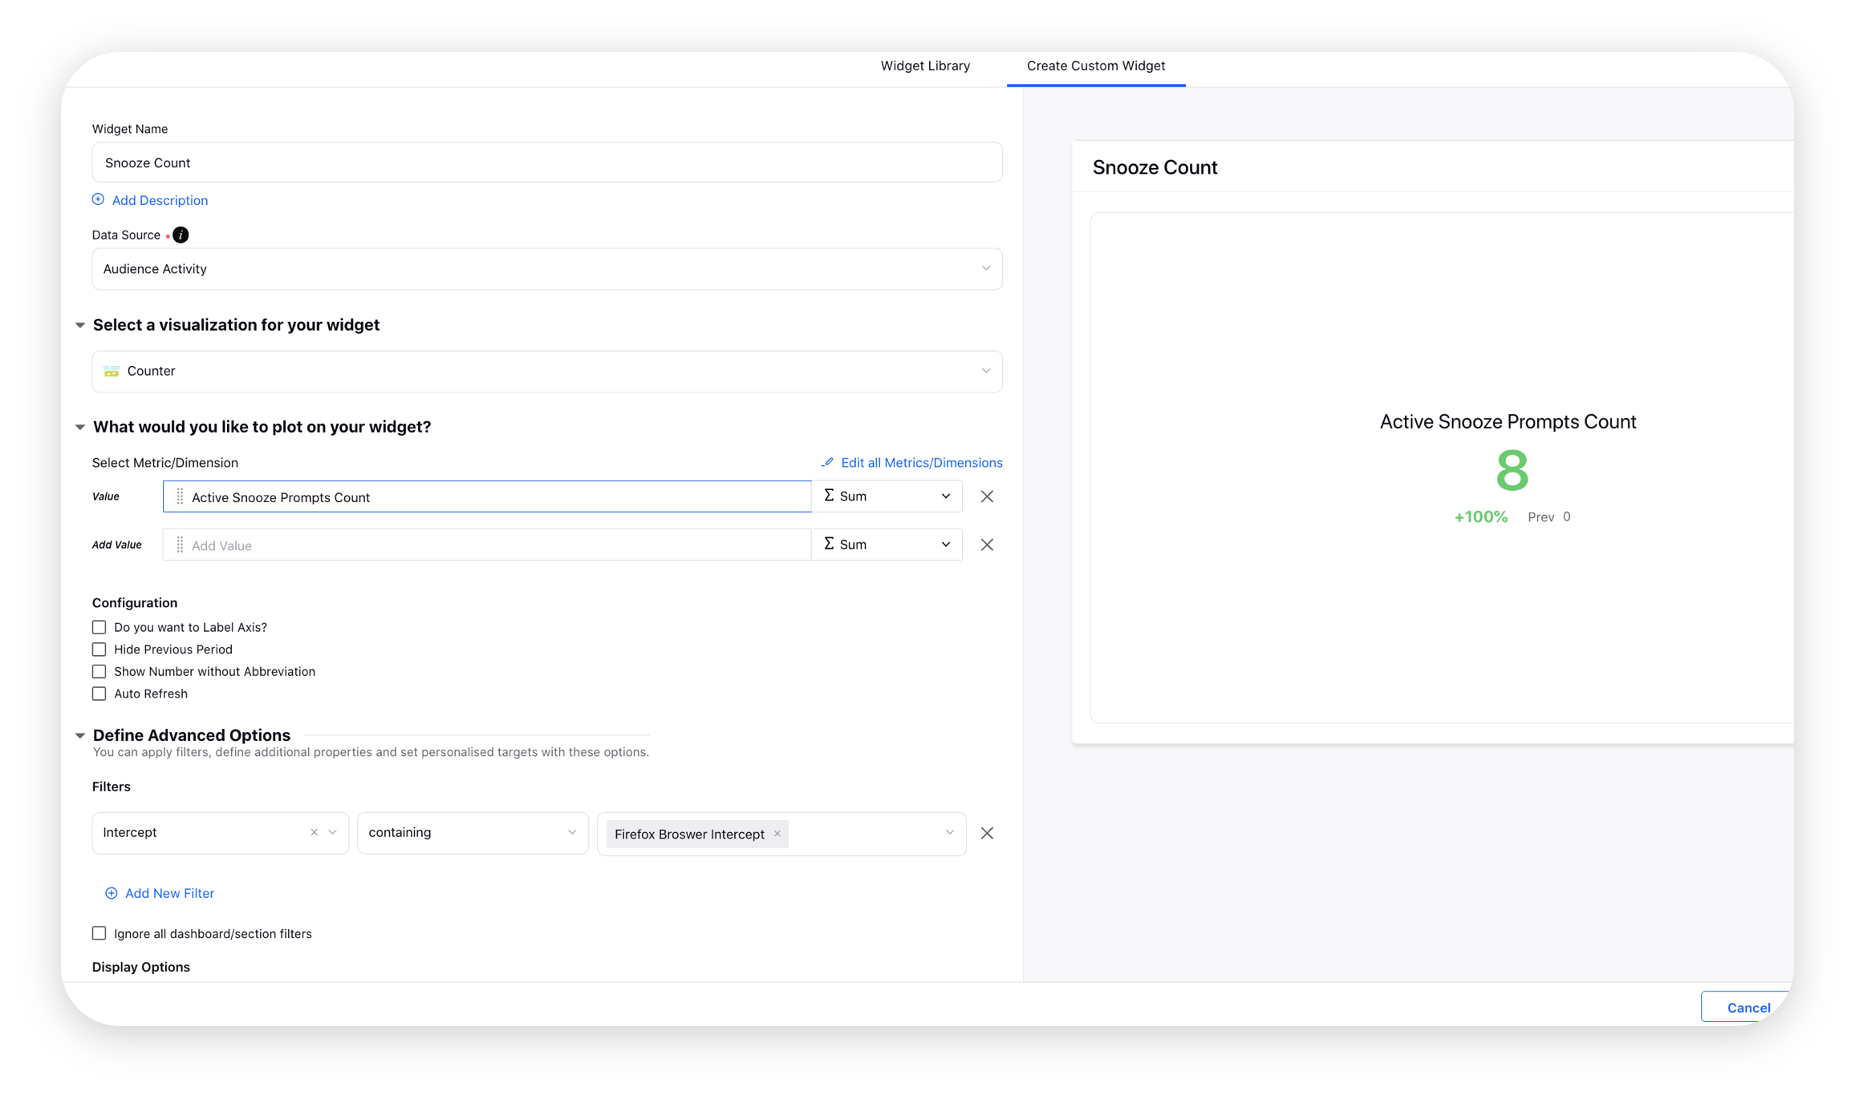
Active Snooze Prompts Count
Count of prompts that are snoozed and yet to be triggered again after the snooze interval.
Create a Counter widget. Select the Activity Snooze Prompt Count custom metric and the desired Intercept from the Filters dropdown.
Snooze Intercept Completion Time
Avg. time taken by customers to engage with the Intercept using the snooze function.
Create a Counter widget and select the Snooze Intercept Completion Time custom metric and the desired Intercept from the Filters dropdown.

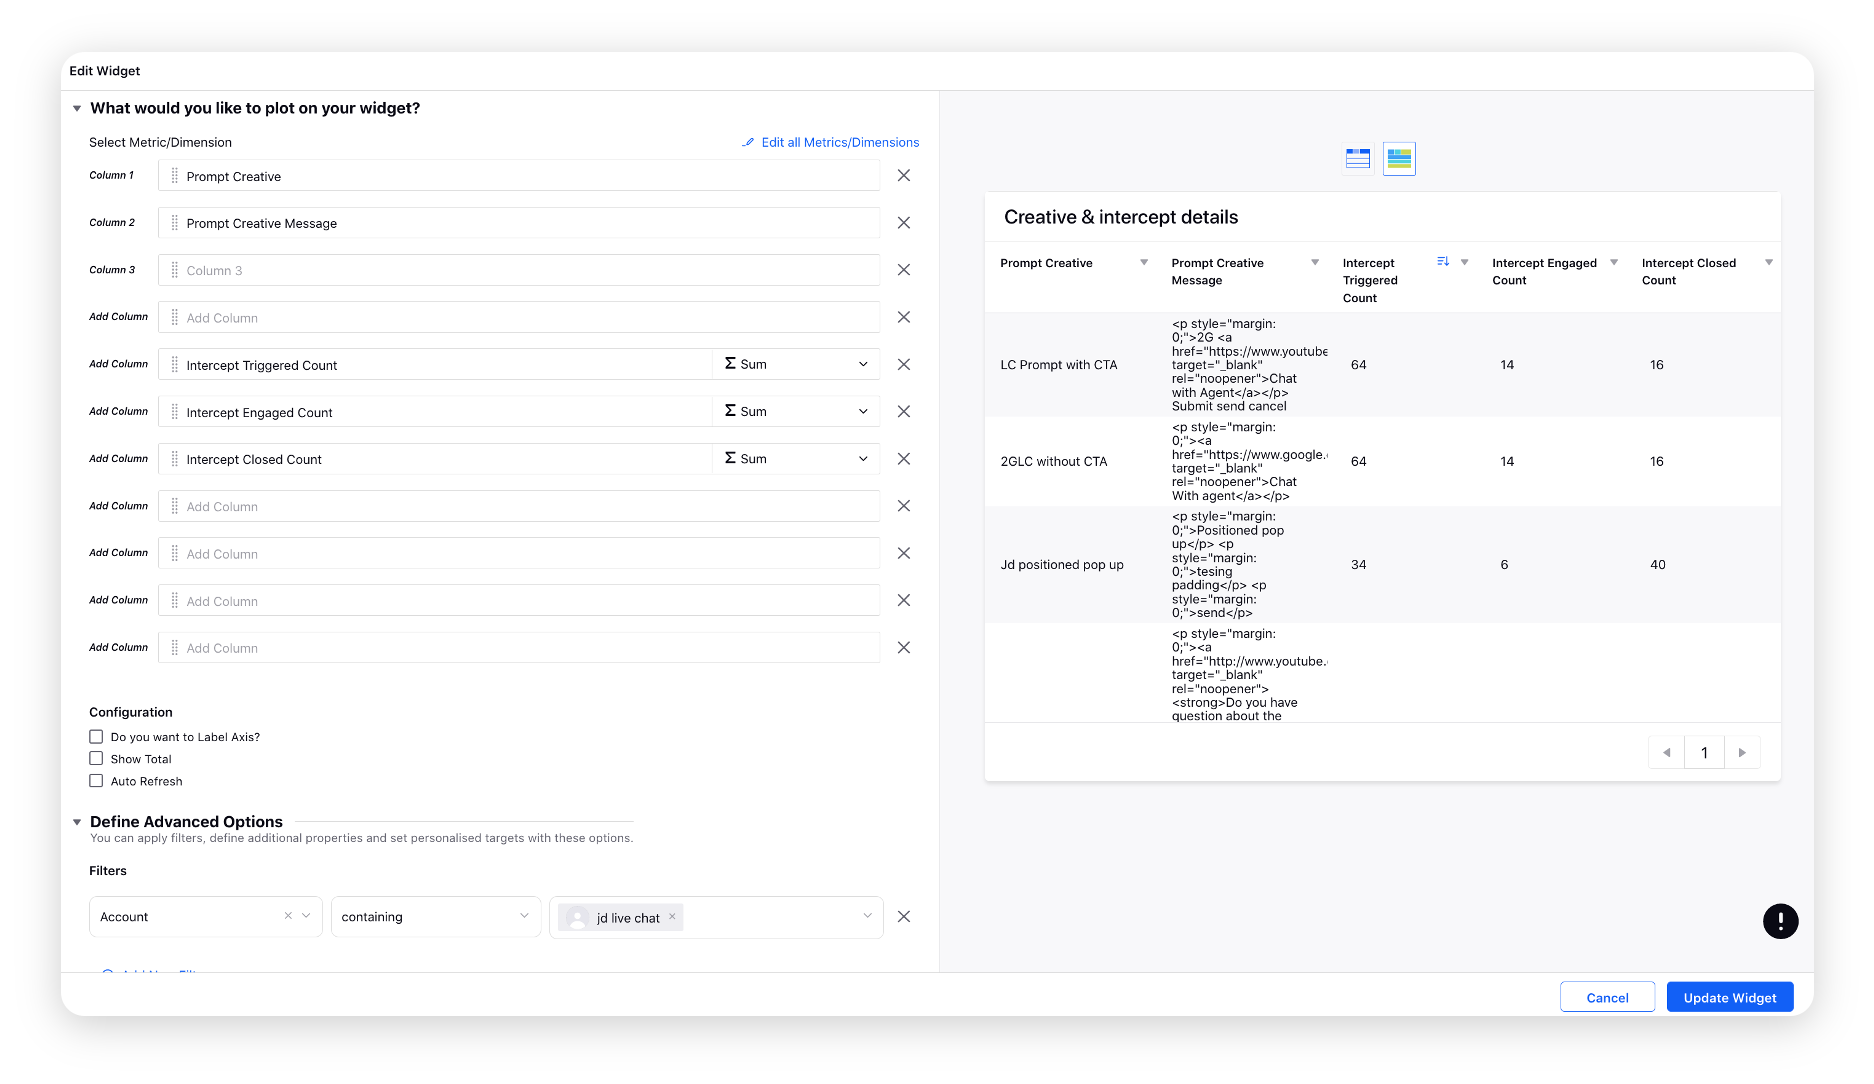
Prompt Creative Message
View the prompt creative message on which the intercept was triggered/engaged/closed.
Create a Table widget and select the Intercept Triggered Count, Interept Engaged Count, and Intercept Closed Count metrics with the Prompt Creative and Prompt Creative Message dimensions. Next, select the desired Account from the Filters dropdown.
A/B Enabled Variants
For a proactive prompt, add the Variant AB Testing dimension filter to display intercepts where A/B testing is active/inactive.

Survey Customer Profile
View the user who filled out the survey by plotting the Survey Customer Profile dimension.
