Reporting on Automated Quality Management
Updated
In reporting, you can access various metrics to analyze the performance and effectiveness of automated quality management. Here's a breakdown of the key metrics available:
Summary
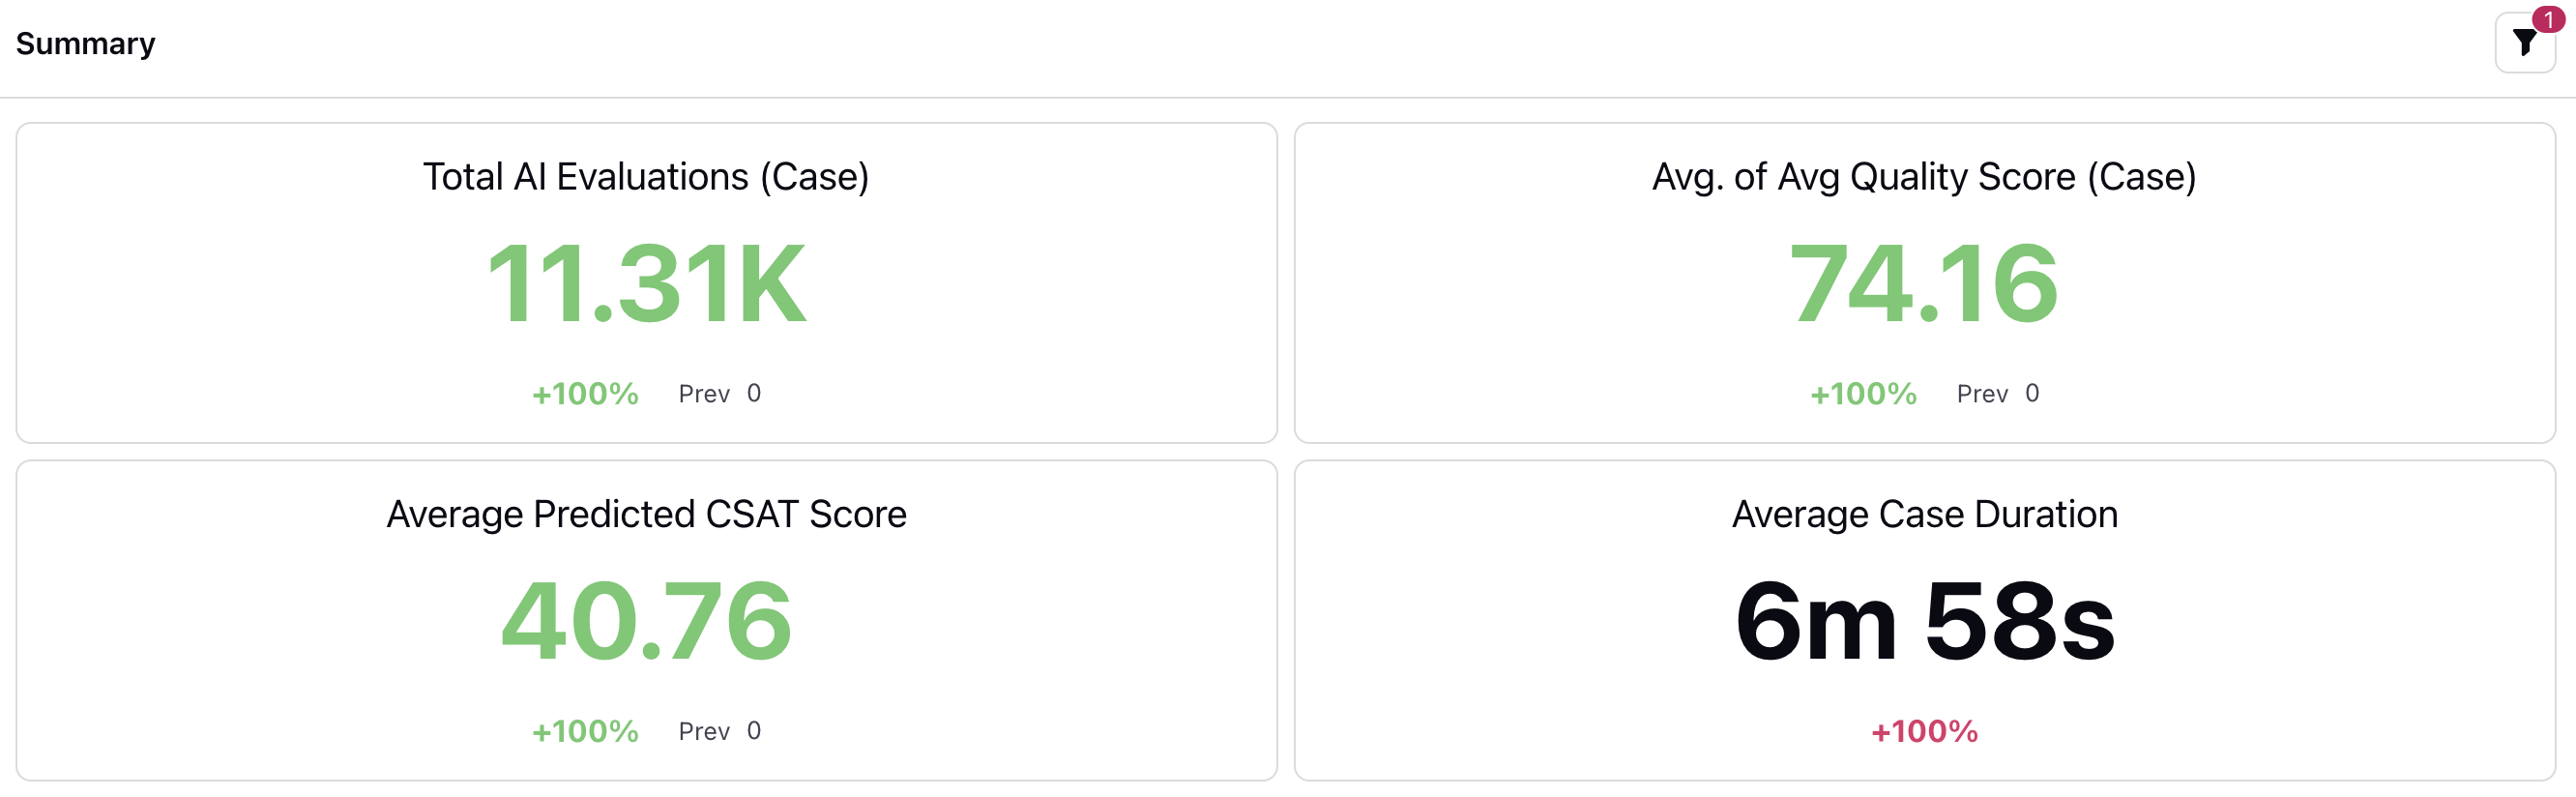
Total AI Evaluations: This metric indicates the total number of evaluations performed by automated quality management. It reflects the volume of case evaluations processed by AI algorithms.
Clicking on the count allows you to access detailed insights in the drill-down pane. You can explore the case count trend over time through a trend graph, understand the distribution of cases among agents, and analyze how cases are spread across different communication channels. Additionally, you can view associated case IDs and corresponding quality scores, enabling a comprehensive analysis of agent performance and case evaluation trends.
Avg of Avg Quality Score: This metric represents the average of the average quality scores assigned to interactions or cases. It provides insight into the overall quality of interactions assessed by quality management (QM).
Clicking on it provides access to a quality score trend graph over time. Additionally, you can analyze quality scores agent-wise and across different communication channels. You can also view counts and case IDs associated with each quality score, facilitating a detailed examination of individual cases. Moreover, users have the option to access associated case IDs and corresponding quality scores.
Average Predicted CSAT Score: This metric calculates the average predicted customer satisfaction (CSAT) score for interactions assessed by automated QM.
Click on it to track CSAT score trends, analyze performance across agents and channels, and gain deeper insights into individual cases for comprehensive analysis.
Average Case Duration: This metric measures the average duration of cases or interactions handled by the automated QM.
Click on it to view handling time trend over time and agent-wise and channel-wise handling time. Additionally, you can access associated case IDs, evaluated agents, and their corresponding quality scores for further analysis and insights.
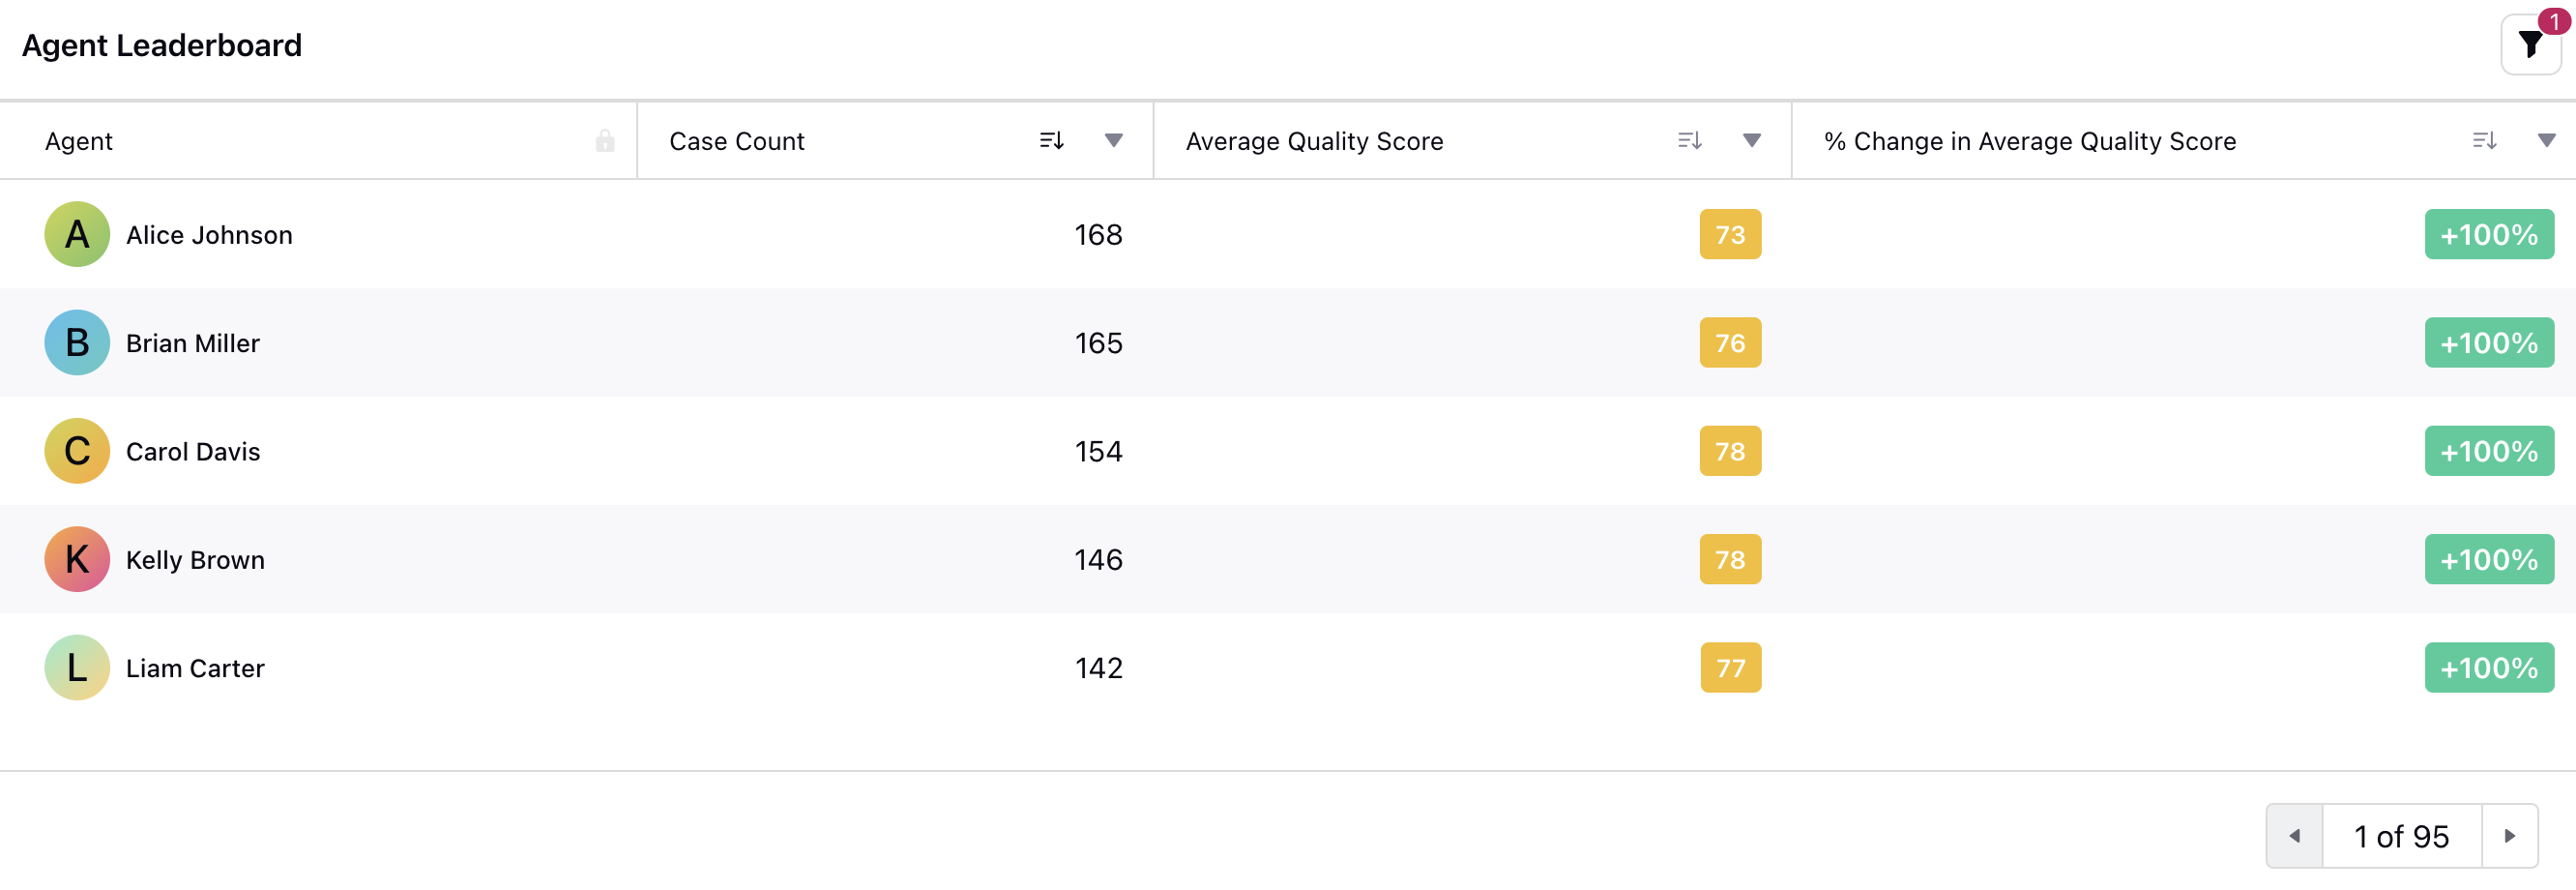
Agent Leaderboard
The Agent Leaderboard widget offers a snapshot of top-performing agents, displaying their case count and average quality score as assessed by automated QM.
Click on the average quality score to access a quality score trend graph over time, as well as a breakdown of quality scores across different communication channels and case IDs showing the quality scores for each case.
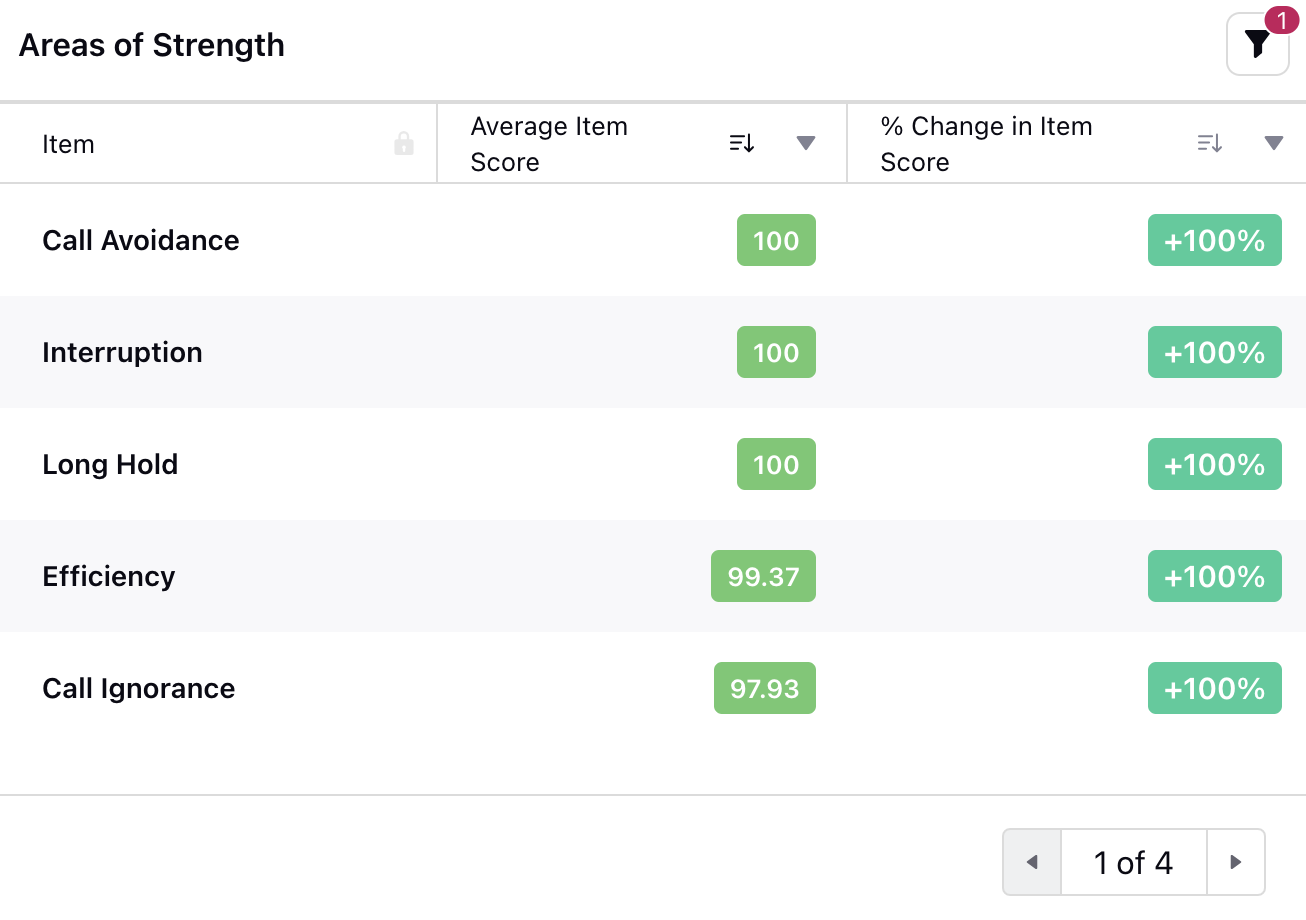
Areas of Strength
The Areas of Strength widget presents the average item score sorted in descending order for specific parameters, such as call avoidance, long hold times, and interruptions. This highlights agents' strengths in managing different aspects of interactions, offering insights into their areas of excellence.
Click on the specific item to view the item score agent-wise and channel-wise. Additionally, you can access associated case IDs, evaluated agents, and their corresponding quality scores for further analysis and insights.
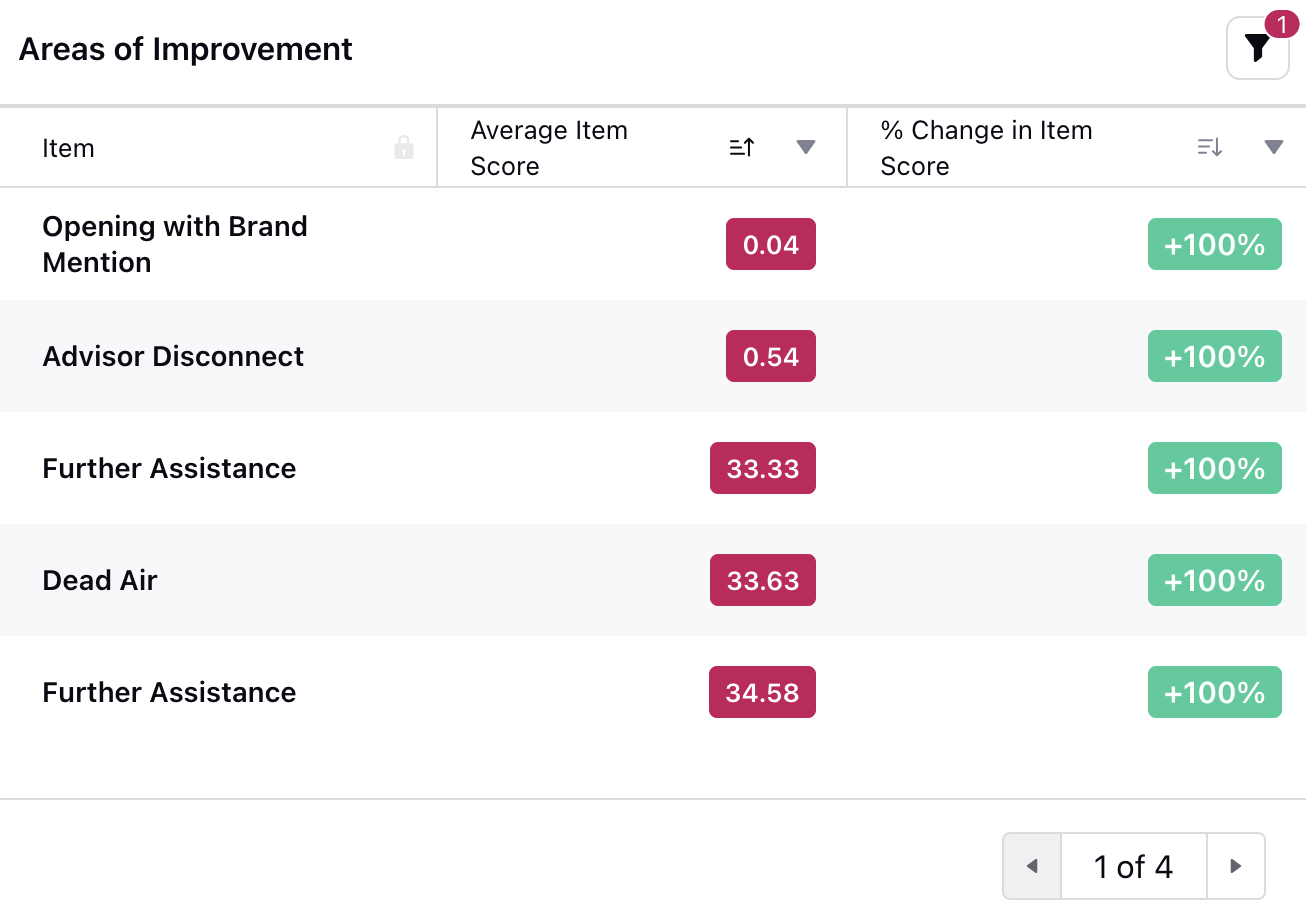
Areas of Improvement
The Areas of Improvement widget showcases the average item score sorted in ascending order for specific parameters, such as dead air, agent disconnect, and opening with brand mention. This highlights areas where agents may need to concentrate on enhancing their performance.
Click on the specific item to view the item score agent-wise and channel-wise. Additionally, you can access associated case IDs, evaluated agents, and their corresponding quality scores for further analysis and insights.
Breakdown by Channel
Analyze and compare the quality scores across different channels, such as phone calls, emails, chats, or social media messages. By identifying which channels yield higher or lower quality scores, you can make informed decisions regarding resource allocation, training initiatives, and overall channel optimization strategies.
Click on a specific bar representing a communication channel to access detailed information. Upon clicking, the widget generates a quality score trend graph over time for the selected channel. Additionally, you can view associated case IDs, evaluated agents, and their corresponding quality scores for deeper analysis and investigation.
.png "MicrosoftTeams-image (119).png")
Parameter Insights
View the total count of instances where the checklist parameter was captured, such as the number of times "courtesy" was identified in phrases.
Click on the item to view the associated case IDs and insight phrases.
