Reporting on Smart Comprehend
Updated
You can create reporting widgets to view the usage and adoption of the Smart Comprehend capability.
To configure a Reporting Widget
Click the New Tab icon
. Under the Sprinklr Service tab, click Care Reporting within Analyze.
On the Reporting Home window, select the desired dashboard within the Dashboards section.
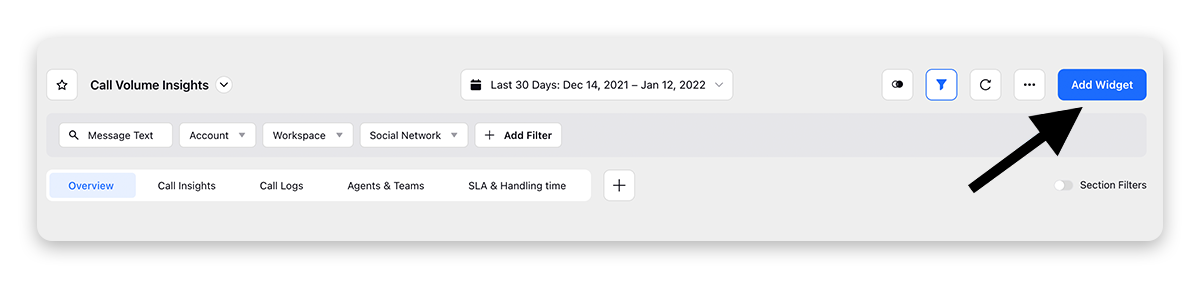
On the selected Reporting Dashboard window, click Add Widget in the top right corner.
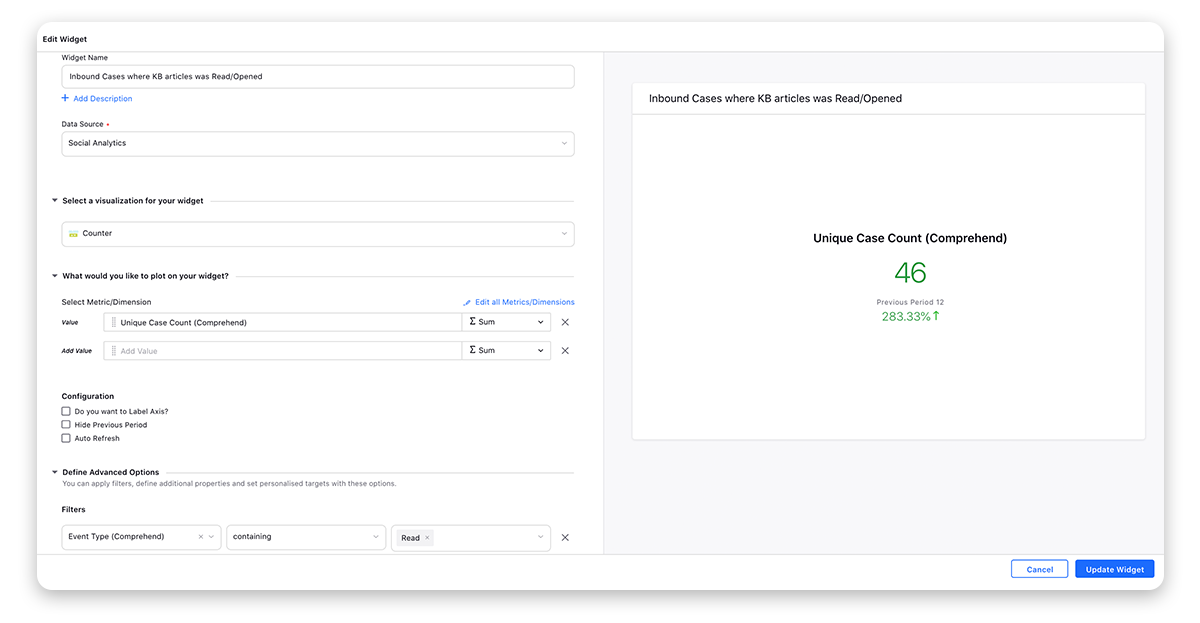
On the Create Custom Widget window, enter a Name for the widget, and select the Data Source as Social Analytics.
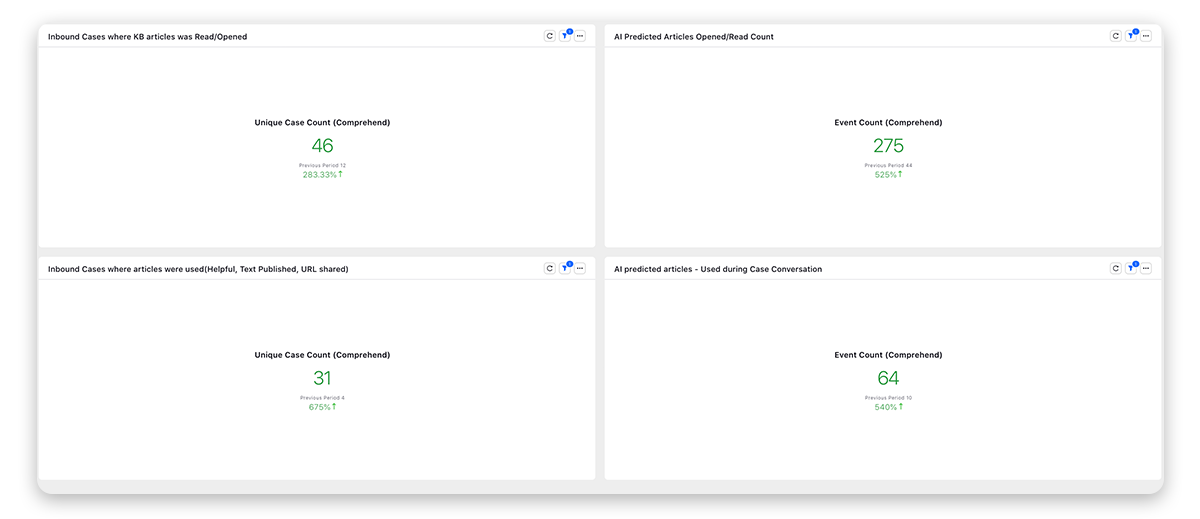
Select the Visualization for your widget as Counter.
Next, within the What would you like to plot on your widget section, select the following metrics.
Unique Case Count (Comprehend) - Total number of unique cases for which knowledge base articles are suggested by AI.
Event Count (Comprehend) - Total number of AI-predicted knowledge base articles.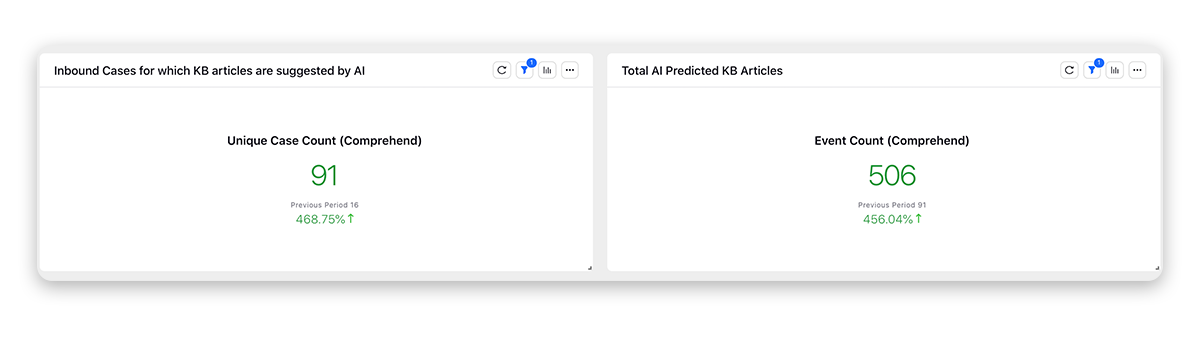
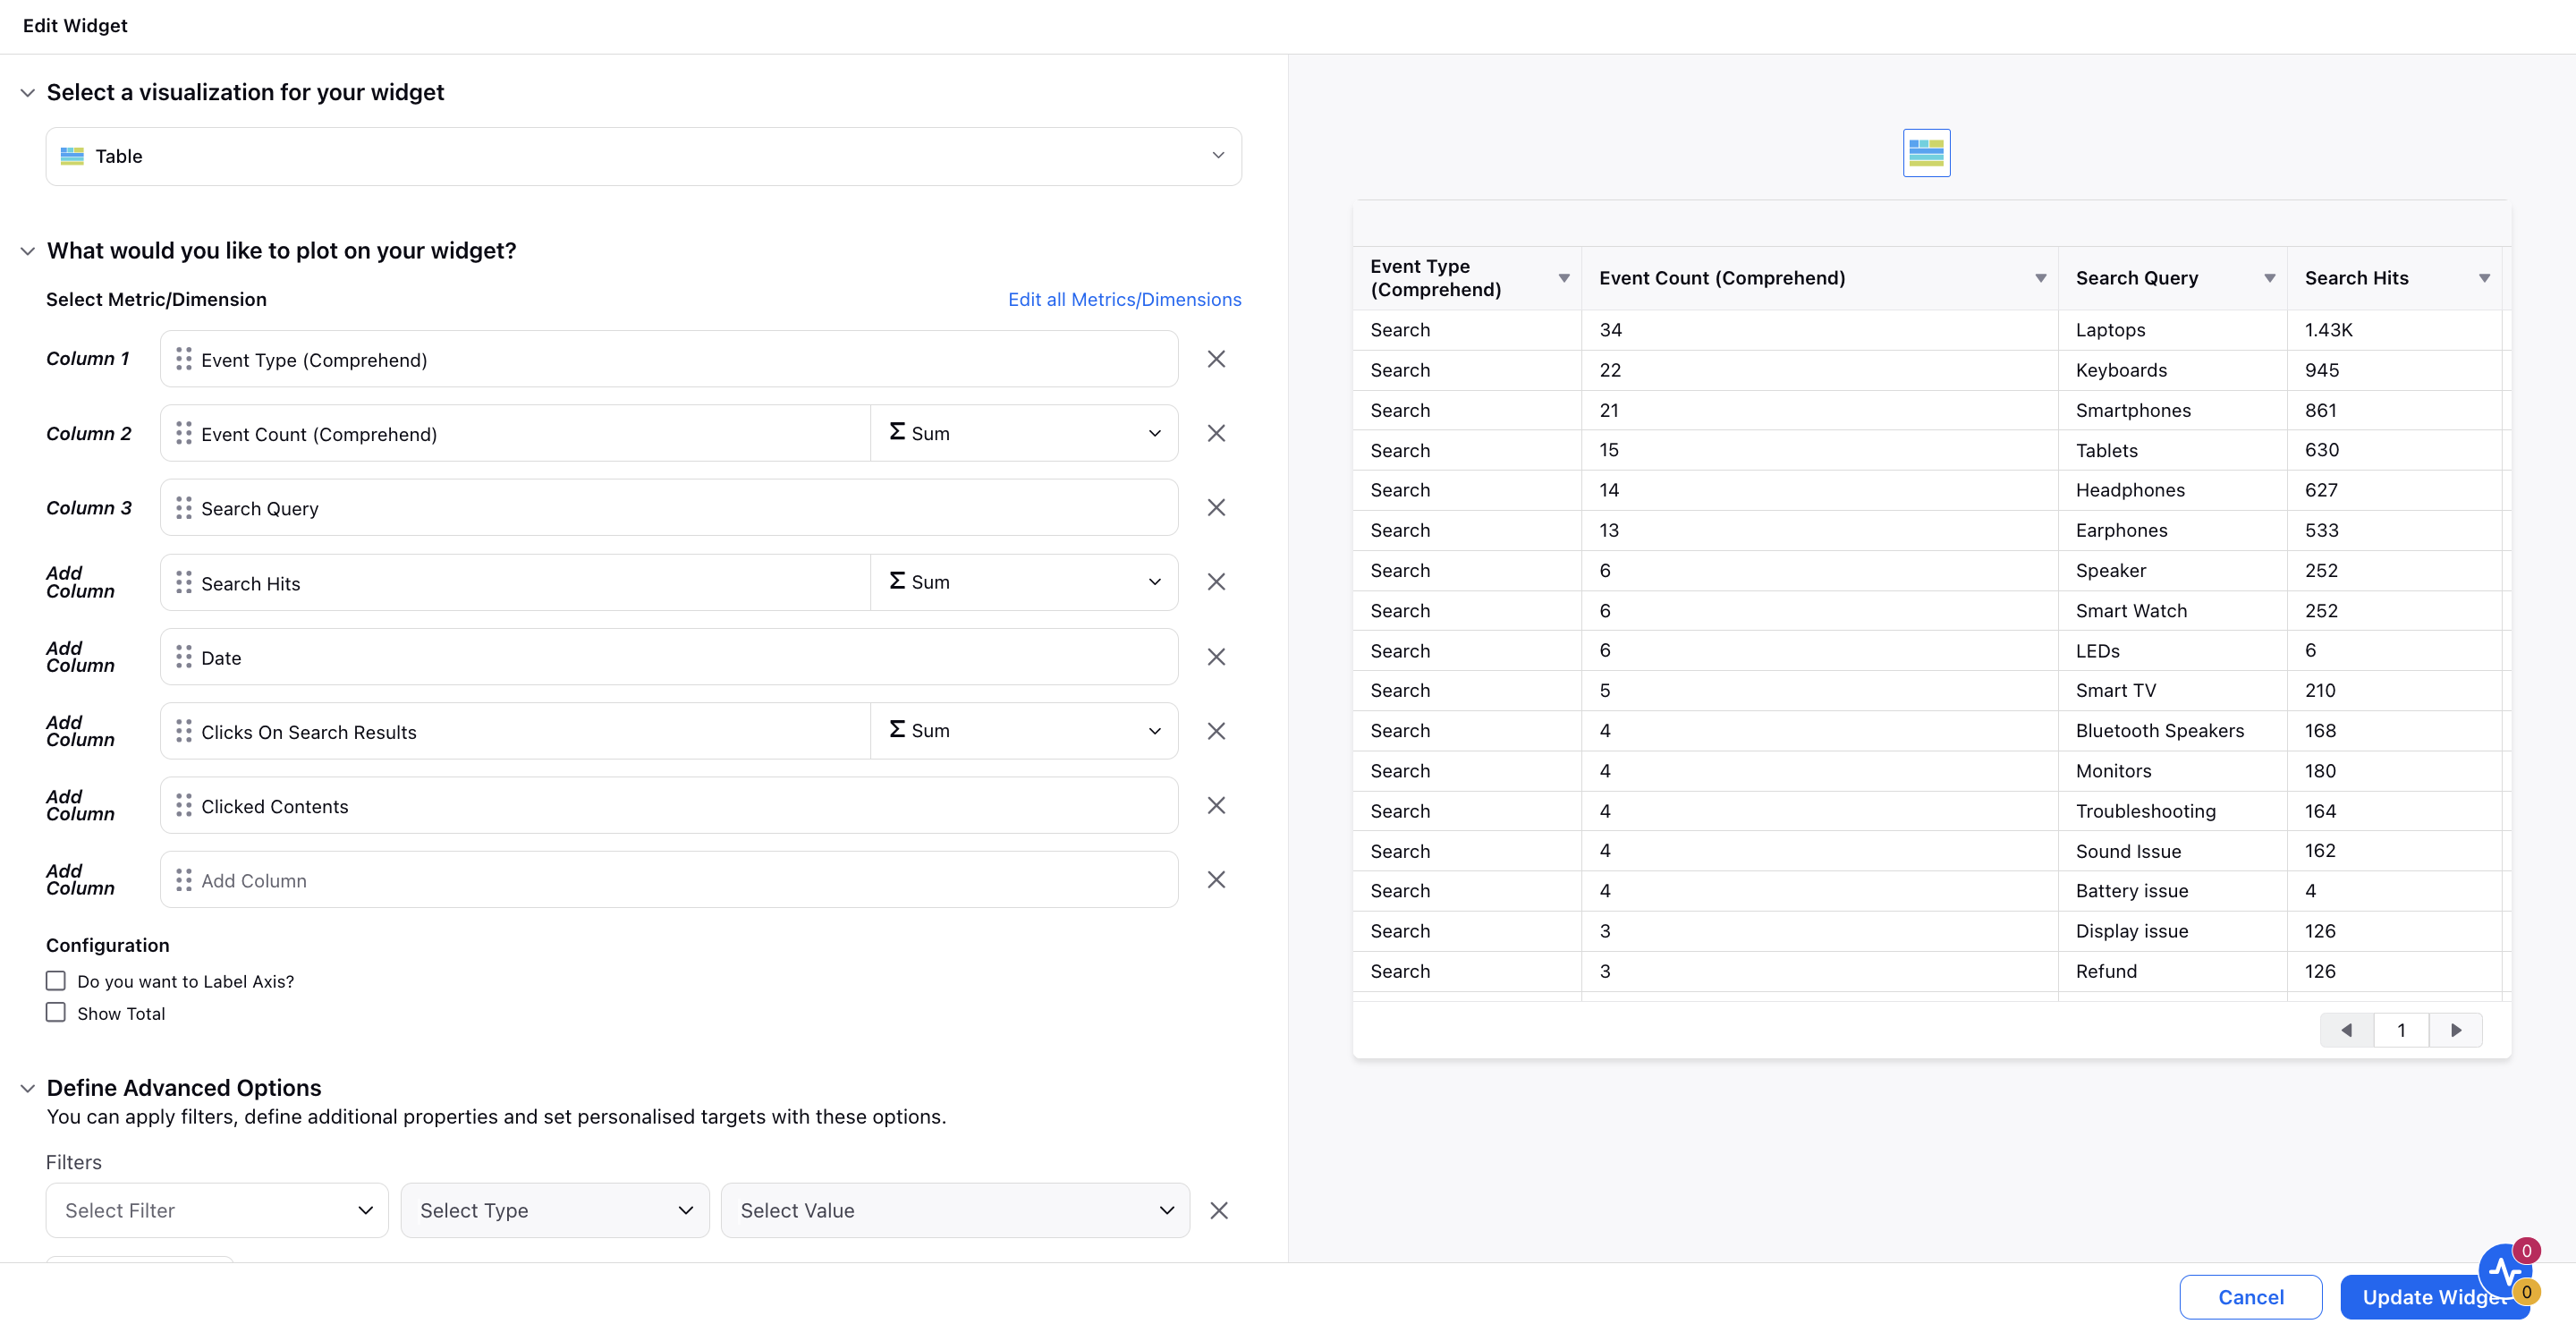
Search Hits - The total count of search hits refers to the number of times the smart assist search successfully returned results in response to agents' search queries.
Clicks on Search Results - The total clicks on search results refer to the number of times agents click on the items returned by the smart assist search engine.
You can also add the Event Type (Comprehend) filter as
Link Copied - To view cases (for Unique Case Count) or articles (for Event Count) where the links of the articles were Copied by the agents.
Text Copied - To view cases (for Unique Case Count) or articles (for Event Count) where the text from the articles was Copied by the agents.
Published - To view cases (for Unique Case Count) or articles (for Event Count) where the text copied from the articles was Published by the agents.
Read - To view cases (for Unique Case Count) or articles (for Event Count) where articles were Read/Opened.
Helpful - To view cases (for Unique Case Count) or articles (for Event Count) where articles were marked Helpful.
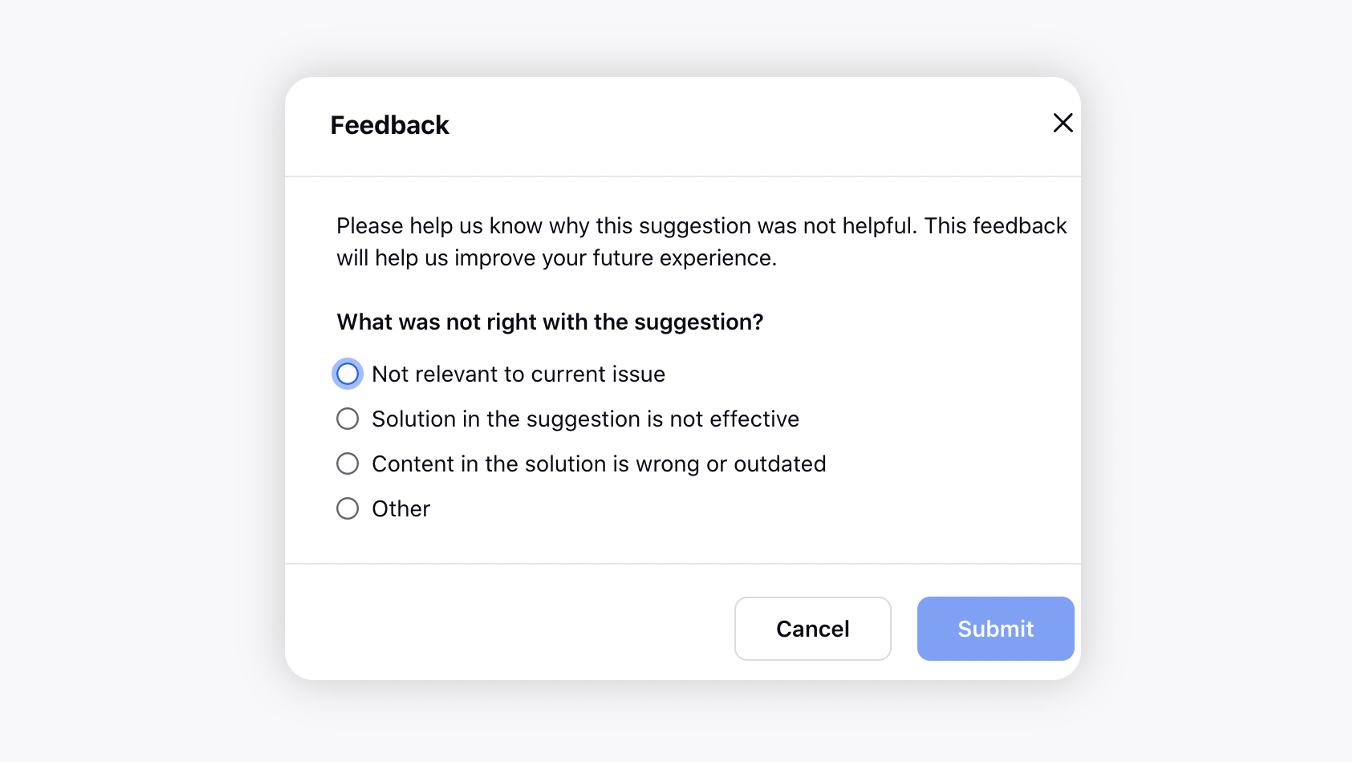
Not Helpful - To view cases (for Unique Case Count) or articles (for Event Count) where articles were marked Not Helpful.Search - By plotting the Event Type (Comprehend) dimension as "Search" alongside the metrics "Search Hits" and "Clicks on Search Results," you can gain valuable insights into the effectiveness of search queries. Additionally, it allows for the identification and analysis of search queries that yield no results, enabling the refinement of search parameters and content.
Enablement note:
To learn more about getting the manual search reporting enabled in your environment, please work with your Success Manager.
Internal note:
Use this DP: SMART_ASSIST_MANUAL_SEARCH_REPORTING_ENABLED
You can also add the below dimensions:
Content - To view the article predicted via the AI model.Feedback Type - To track feedback type given on an article e.g., outdated, not relevant, not effective, etc.
Event Type (Comprehend) - To view the event type i.e. if the articles were read, helpful, not helpful, etc.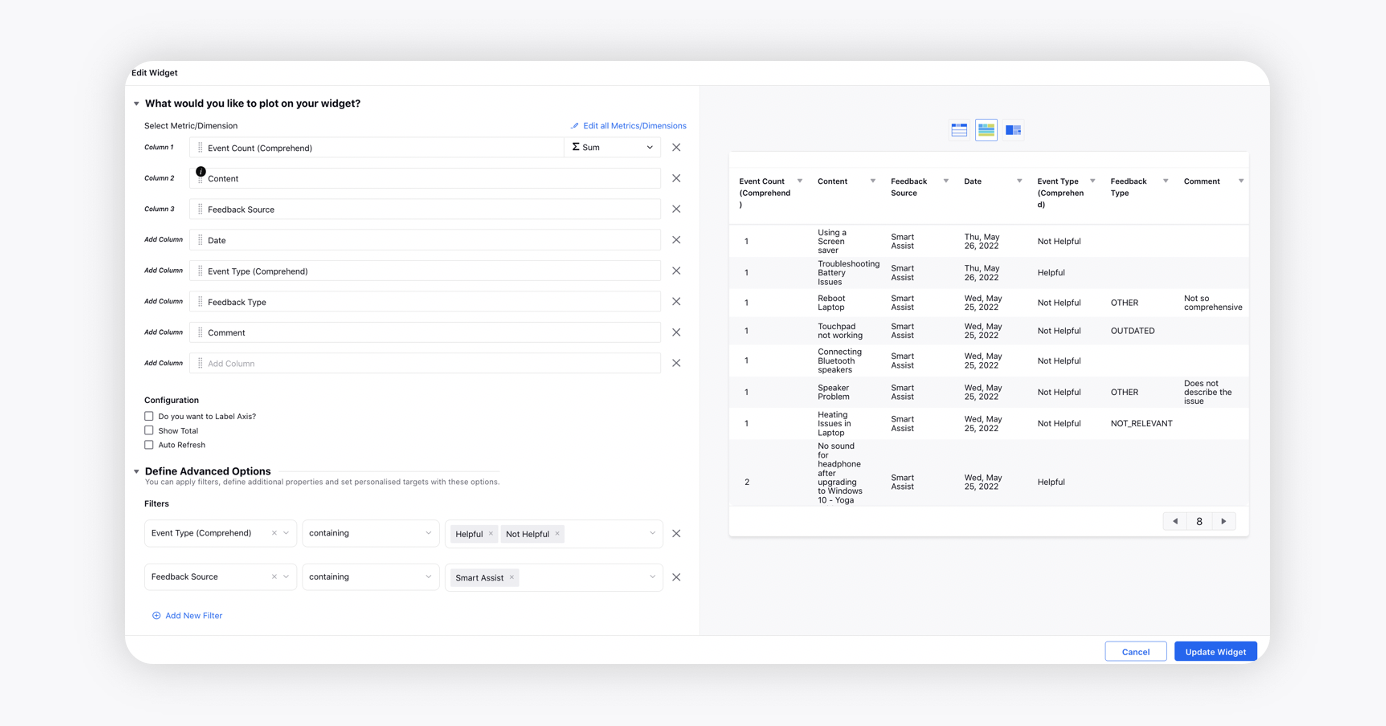
You can also view the agent-wise adoption of Smart Comprehend capability by selecting the dimension User.
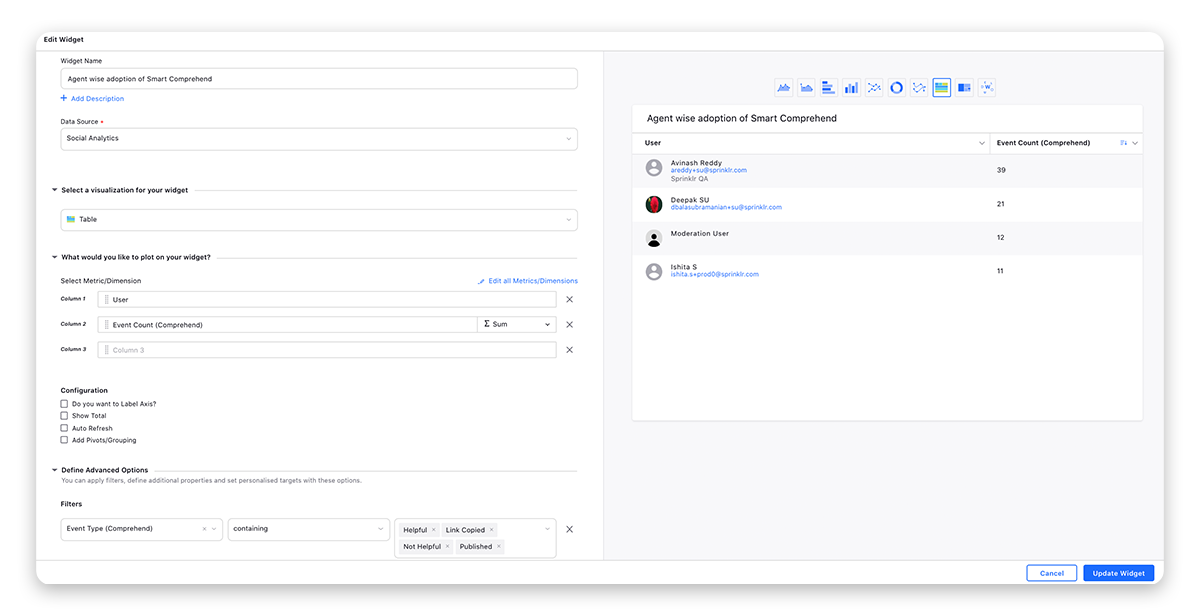
Click Add to Dashboard in the bottom right corner to add the widgets to the dashboard. Note that while updating an existing widget, you will see the Update Widget option instead of Add to Dashboard.