Reporting on Smart Responses
Updated
You can view reports on Smart Responses predicted and used by the agents by creating widgets using Smart Response Dimensions and Metrics.
To know more about the dimensions and metrics of the Smart Response model, see the table below.
Dimension | Description |
Smart Response Text | Text displayed in the Smart Response suggestion |
Smart Response Predicted | Denotes the number of Smart Replies predicted for Inbound messages over the given time period. |
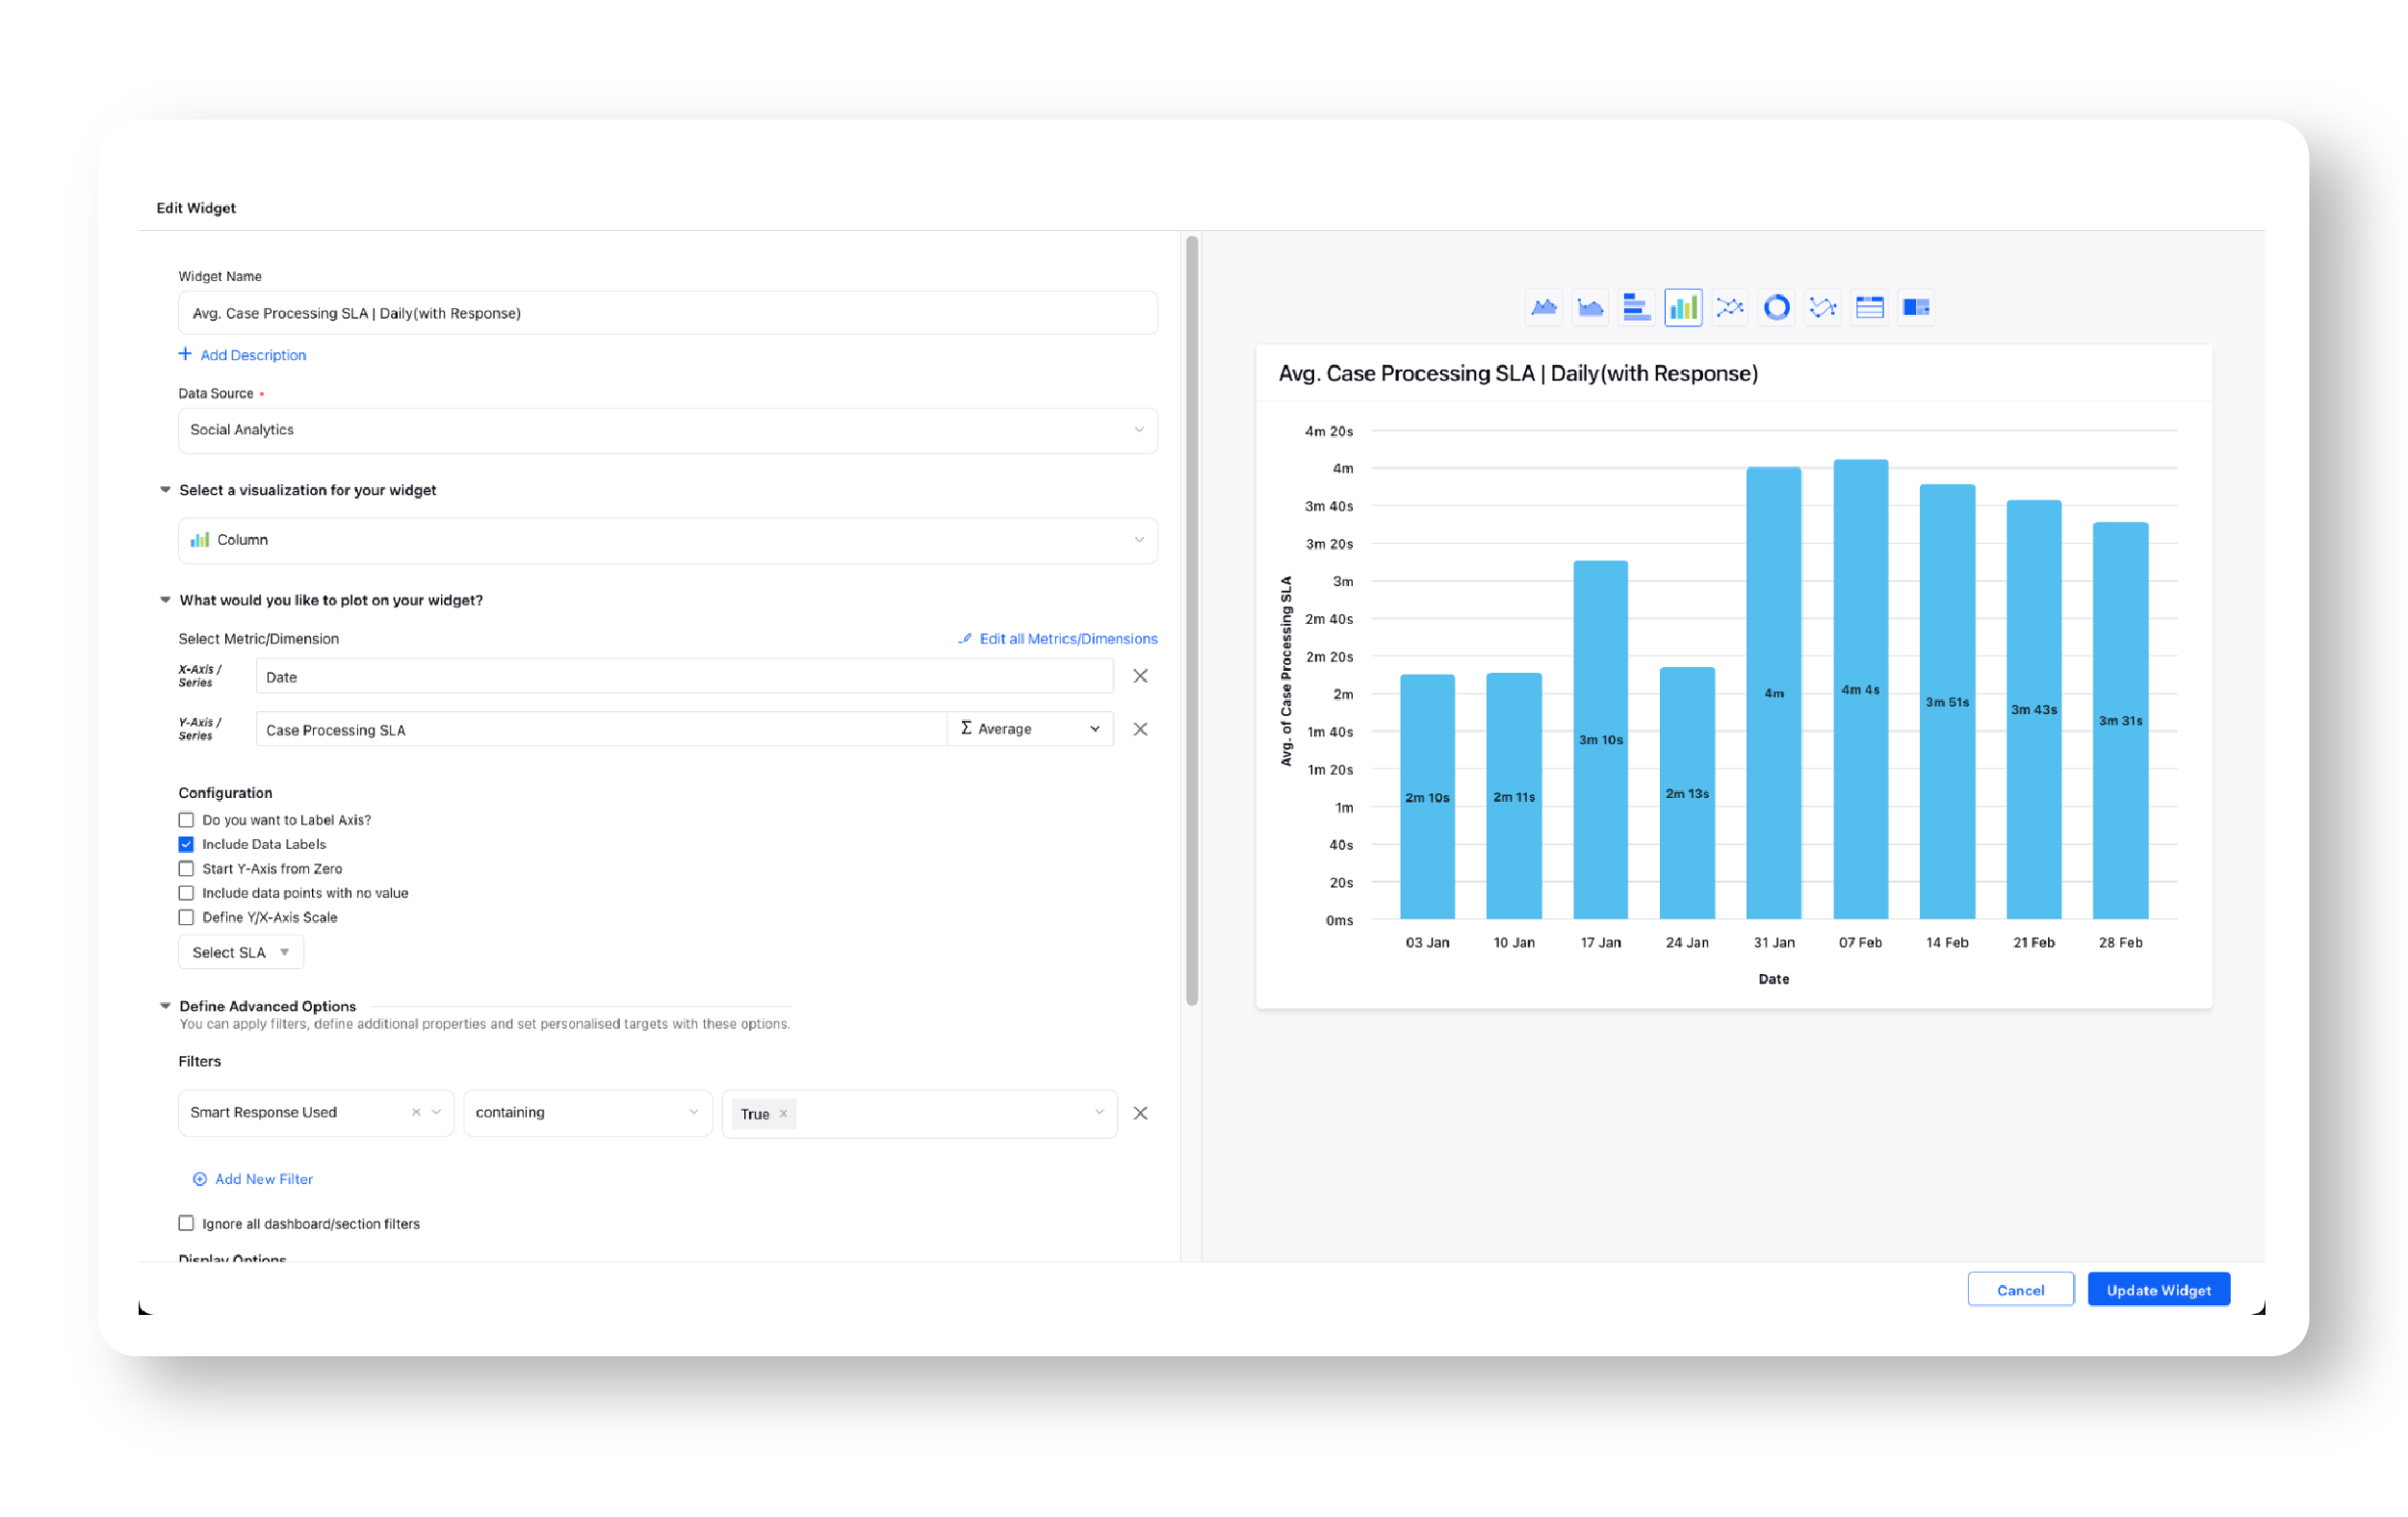
Case Processing SLA | Measures the time spent by the user on a case. This is calculated by adding the time a user has spent on a case on Agent Console or the third pane. Smart Responses reduces the Case Processing SLA by reducing the time agent spends on writing the response. |
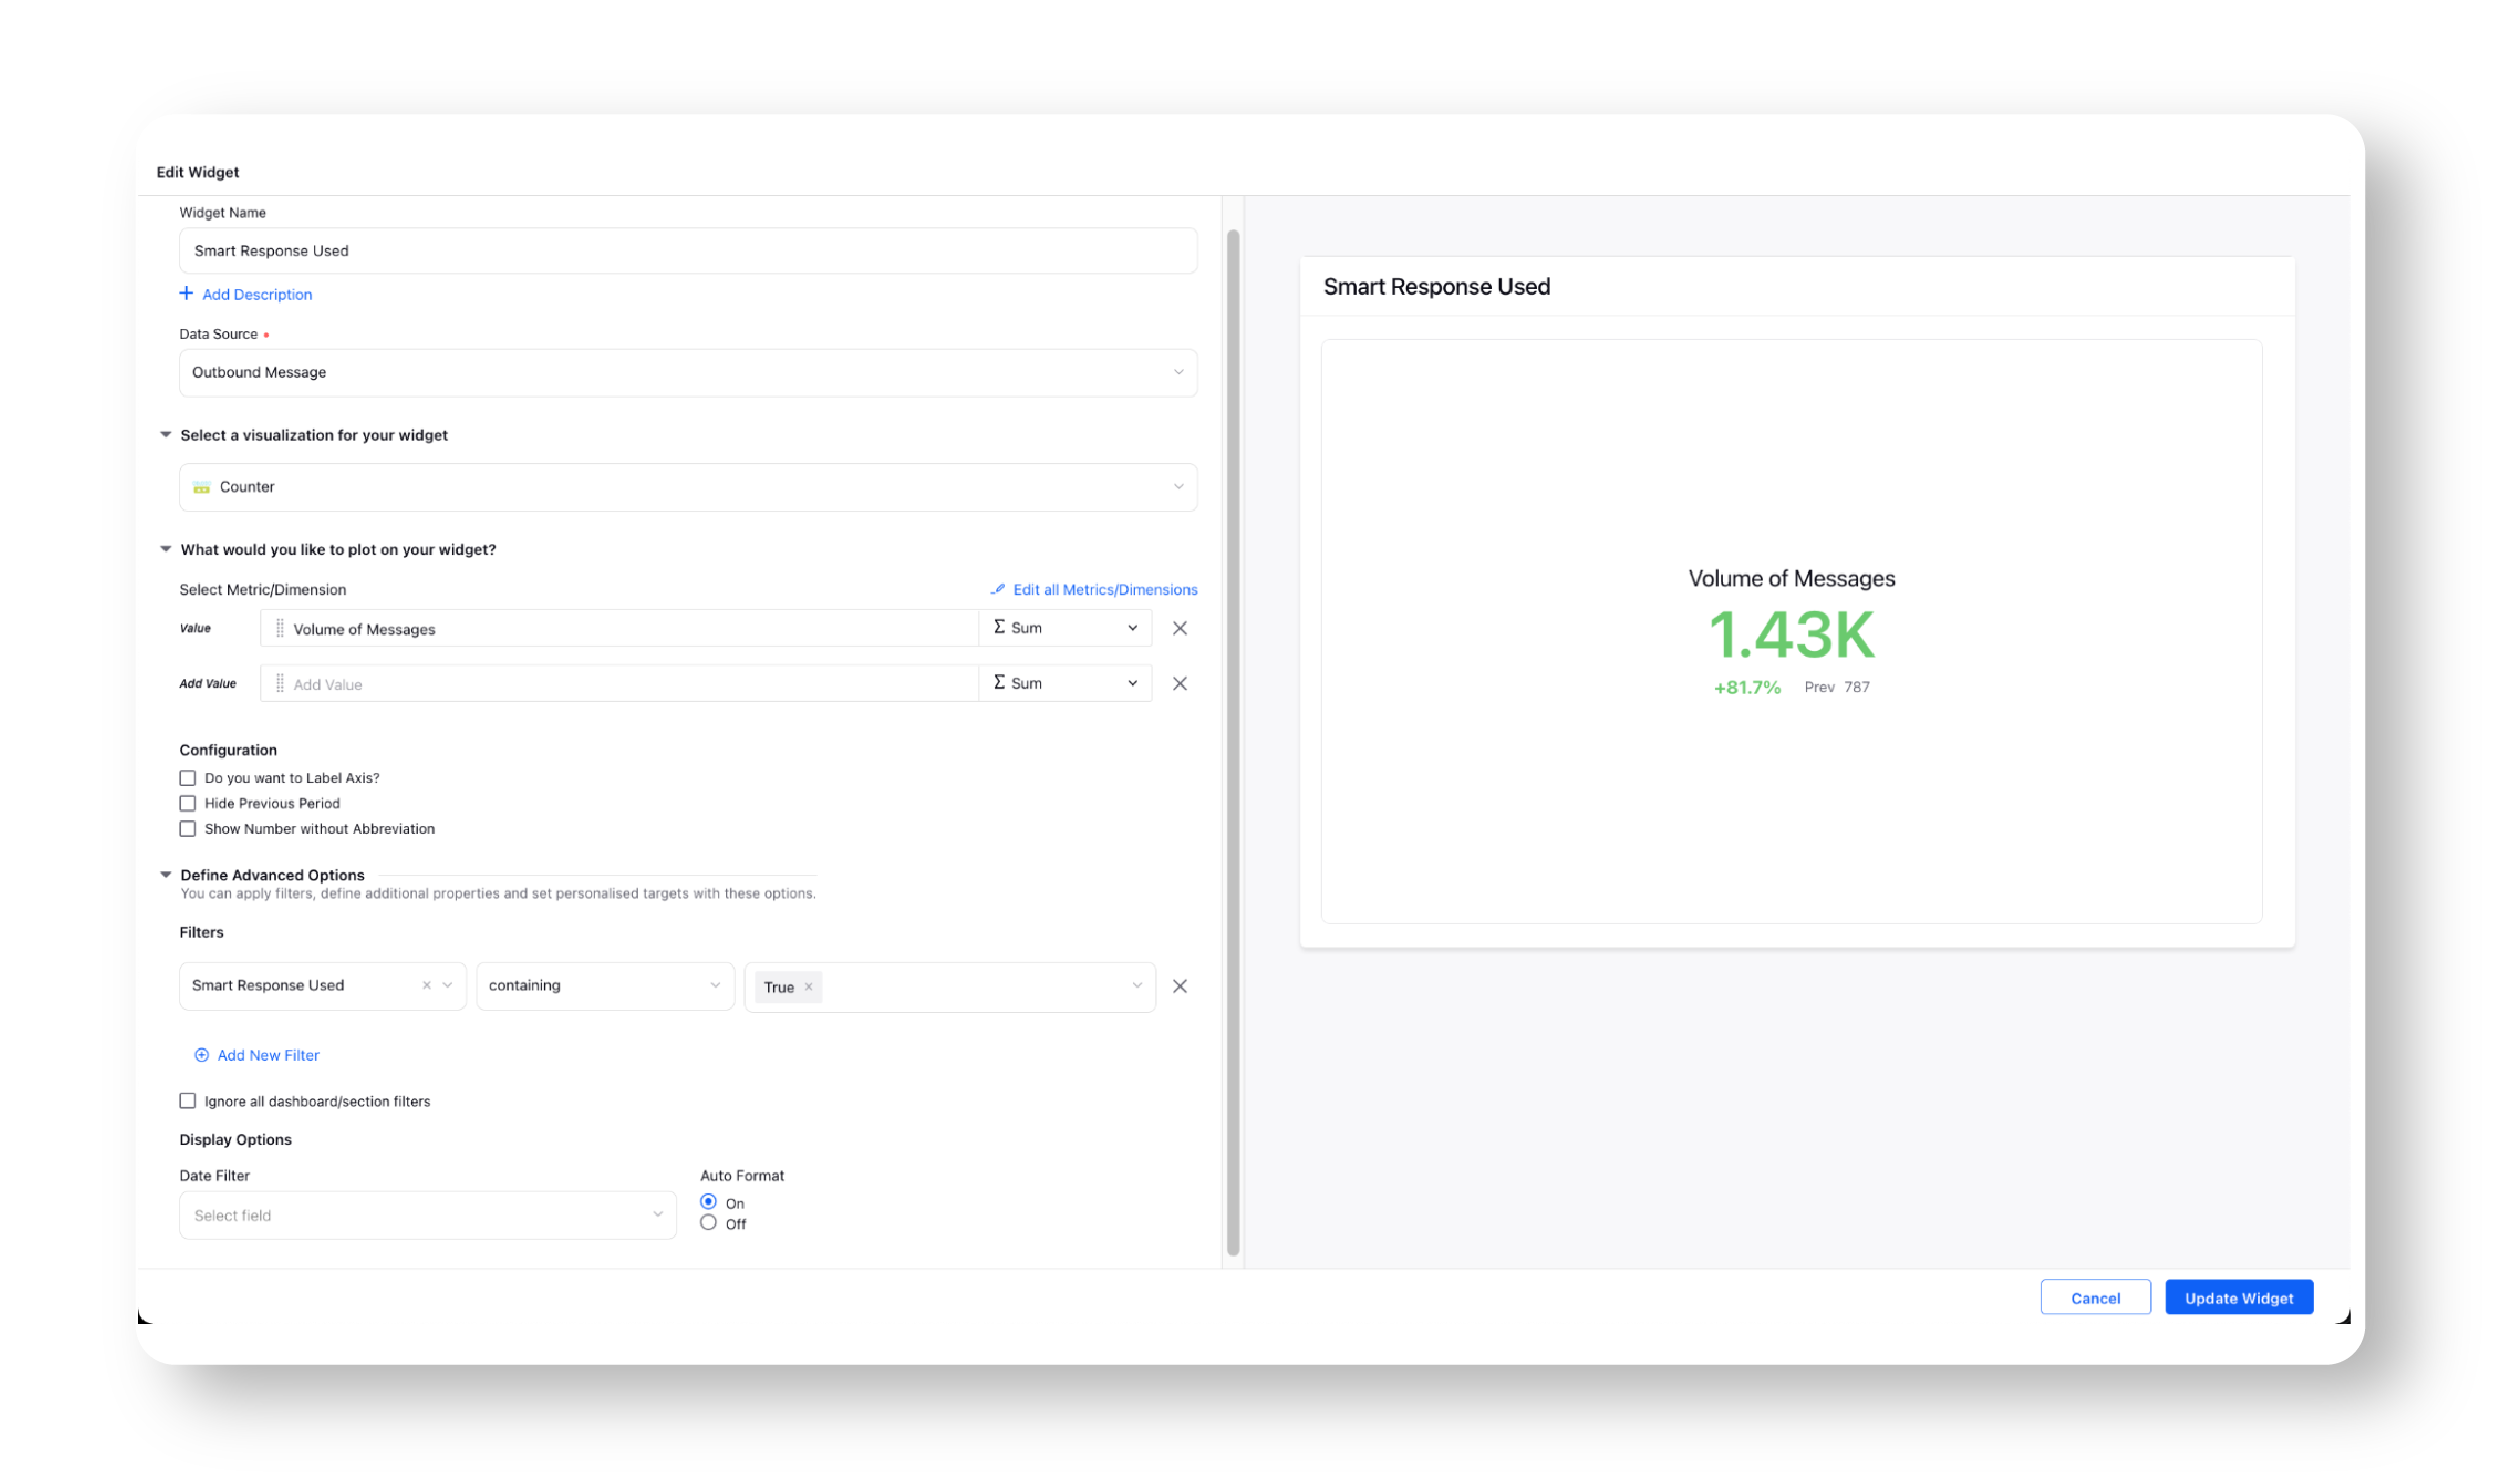
Smart Response Used | Denotes the number of Smart Responses used by agents while replying to messages. |
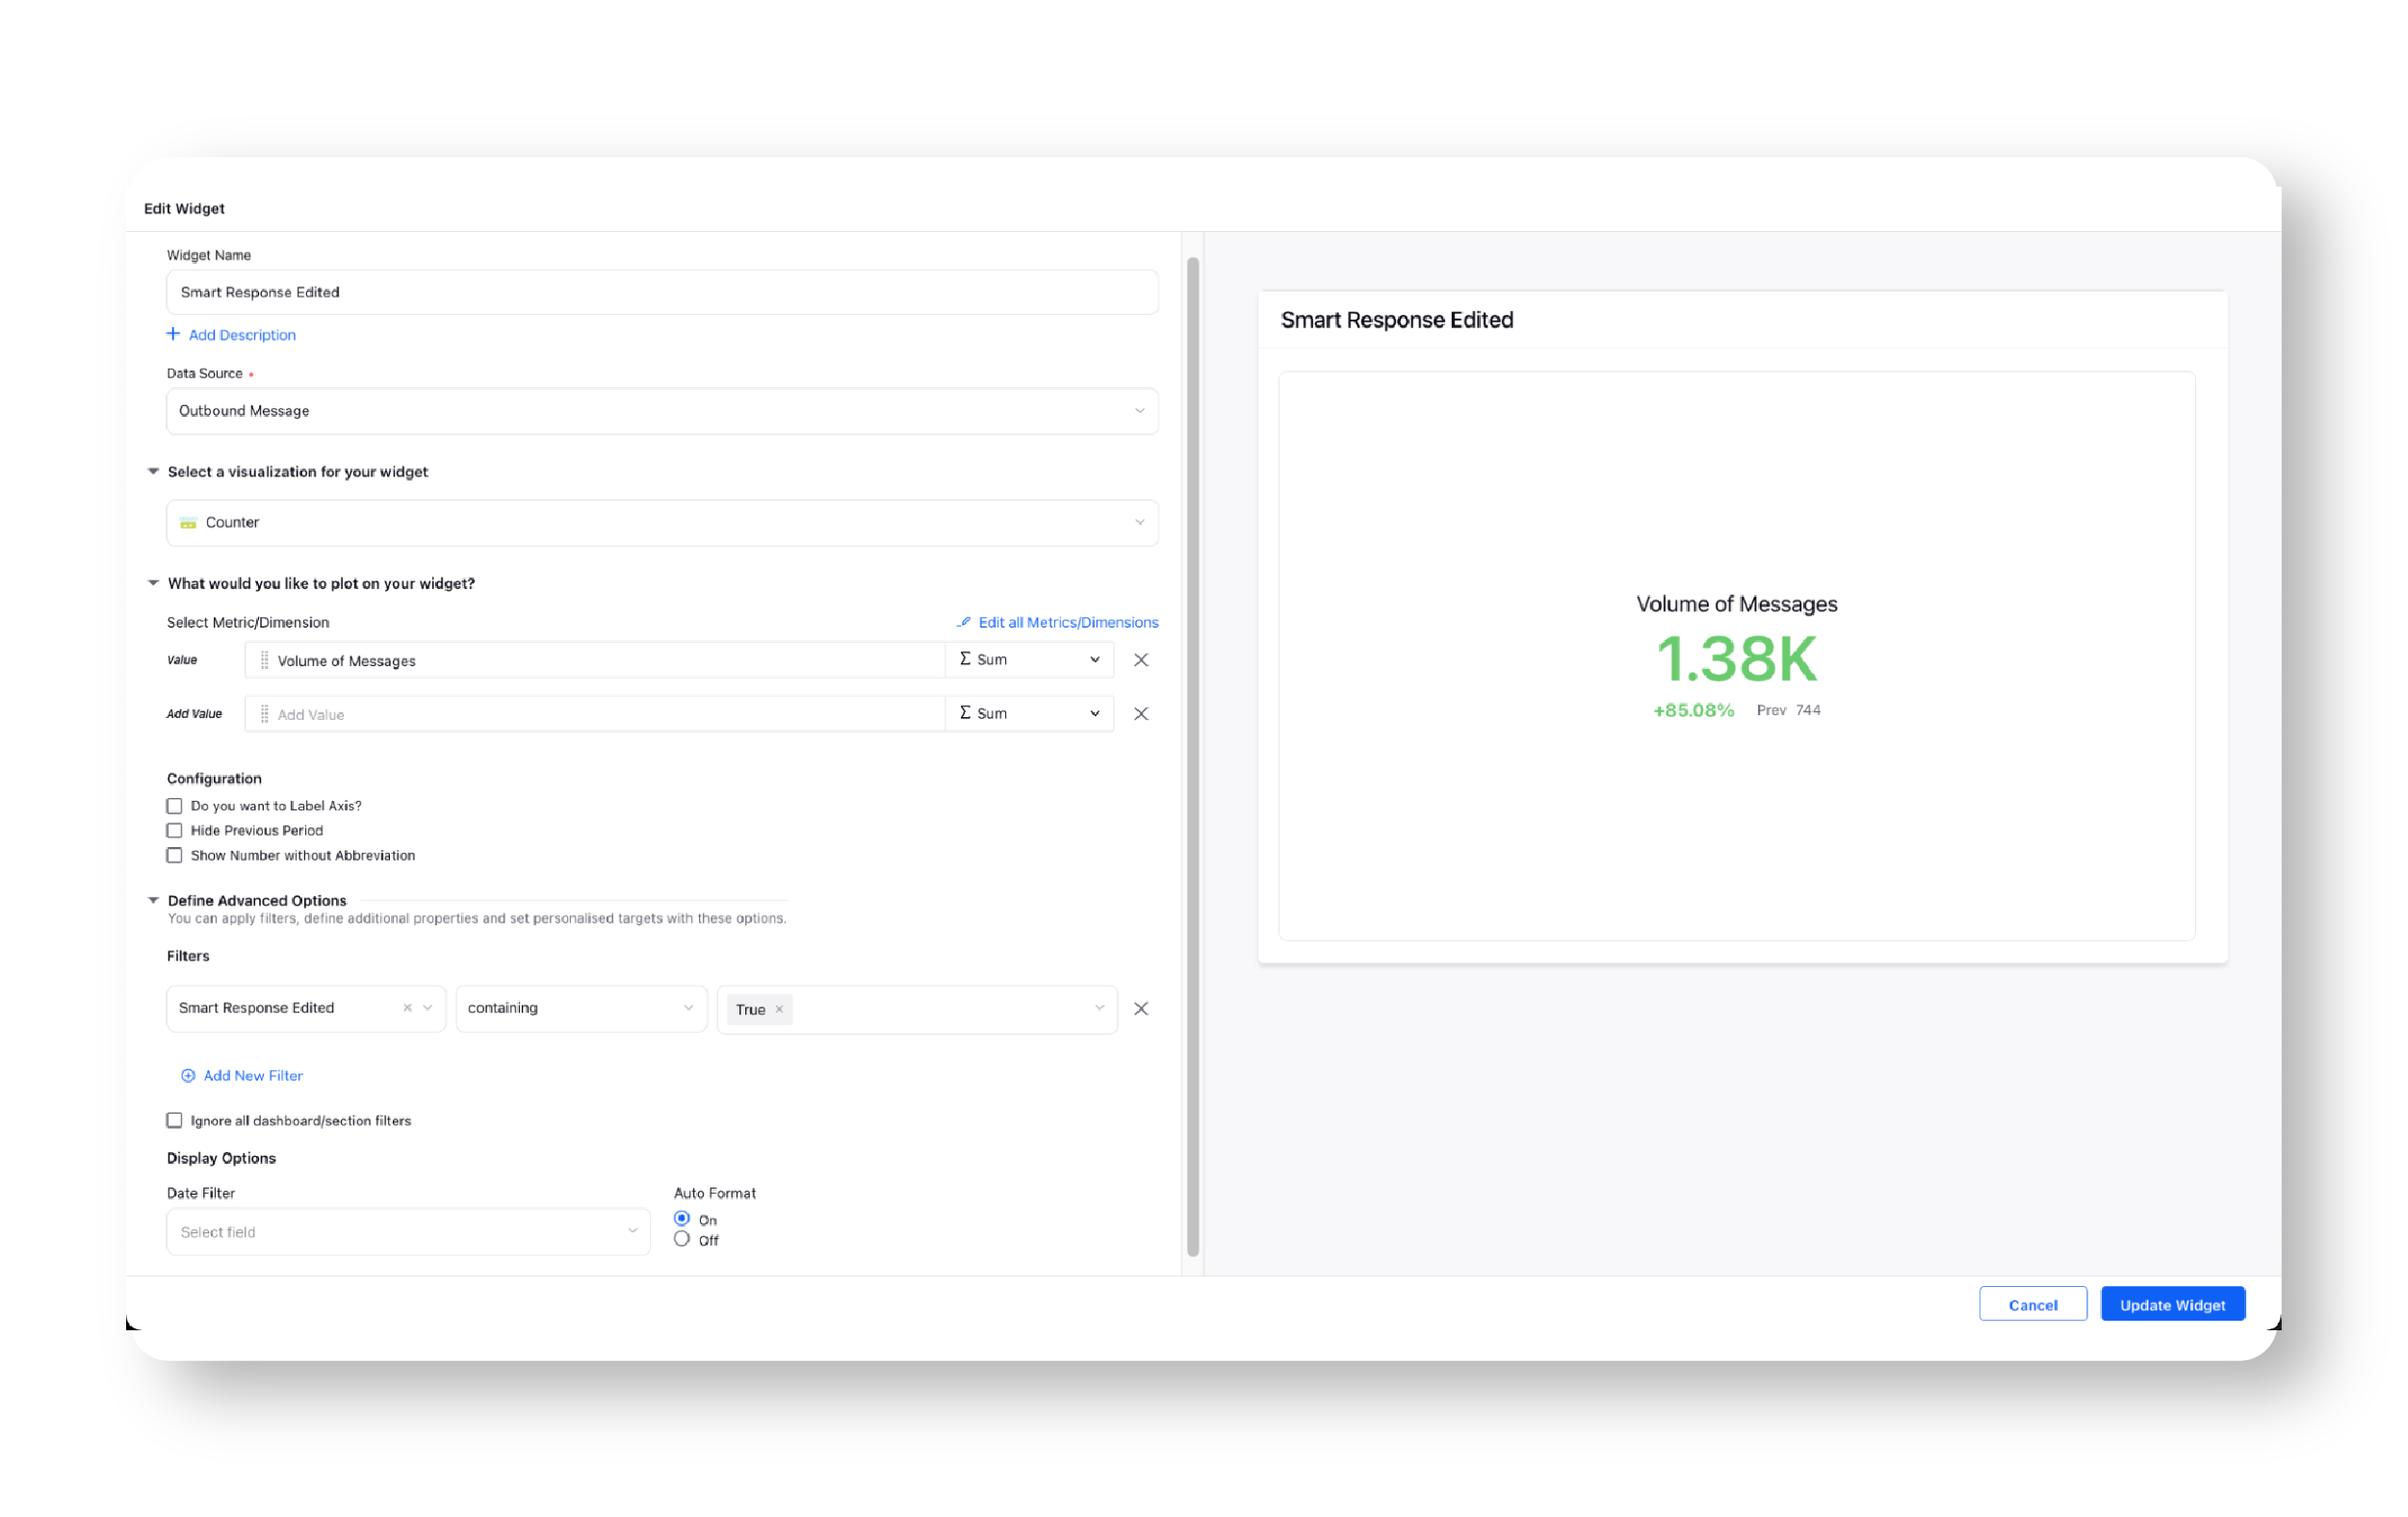
Smart Response Edited | Shows the number of Smart Responses edited by agents before they were sent. |
Smart Response Used Filter | Helps analyze various inbound message-related metrics with cases/messages where Smart Responses were used. |
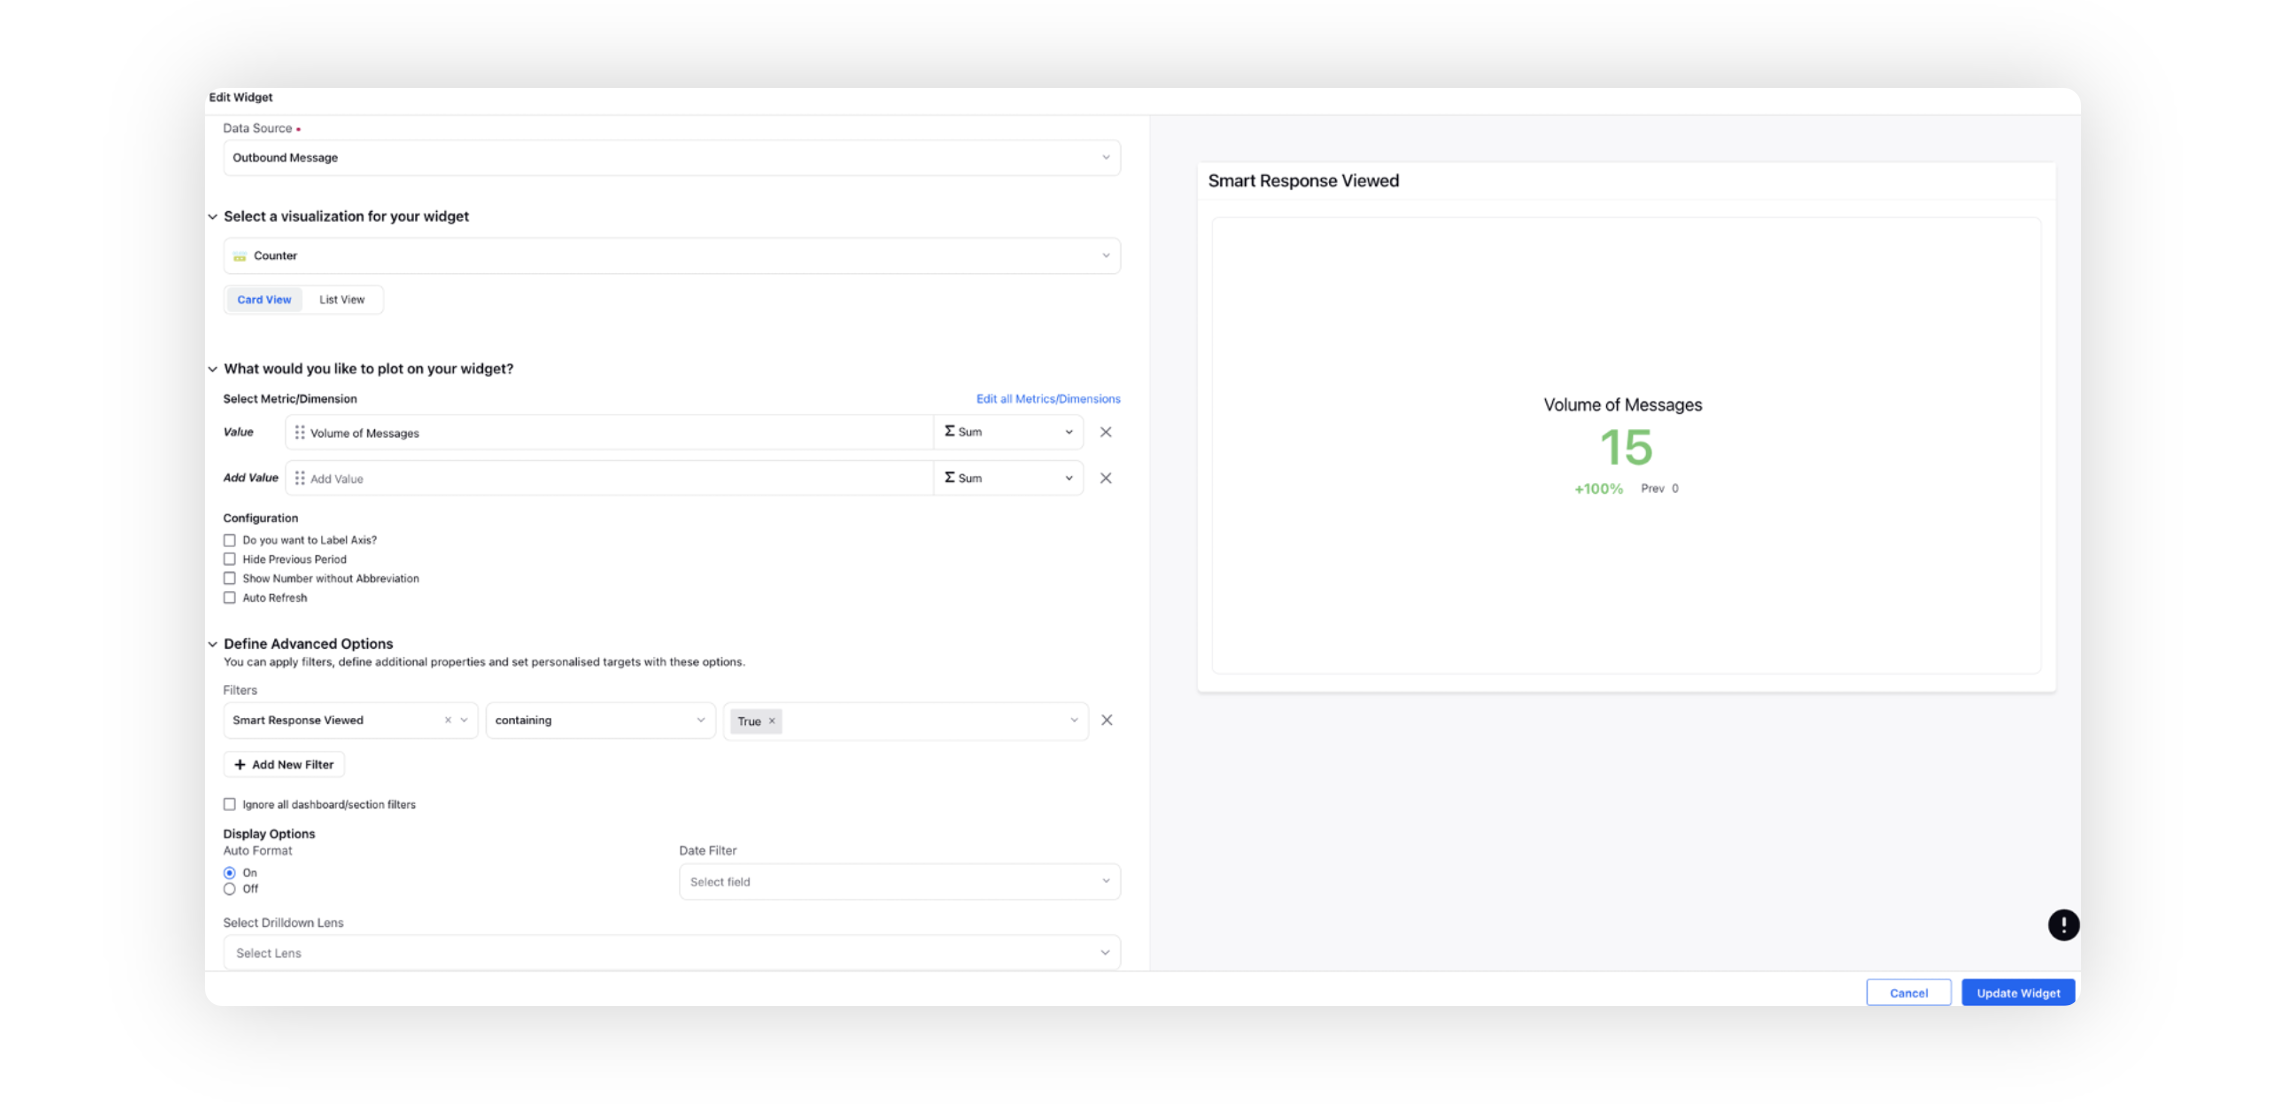
Smart Response Viewed | Denotes the number of messages for which the Smart Response box was opened/or already opened to read the responses, whether you chose to reply through it or not. |
Author | Denotes the name of the author who used the Smart Response. In the case of multiple authors, a report of each author will be displayed separately. |
Best Practices to View Reports on Smart Response Model
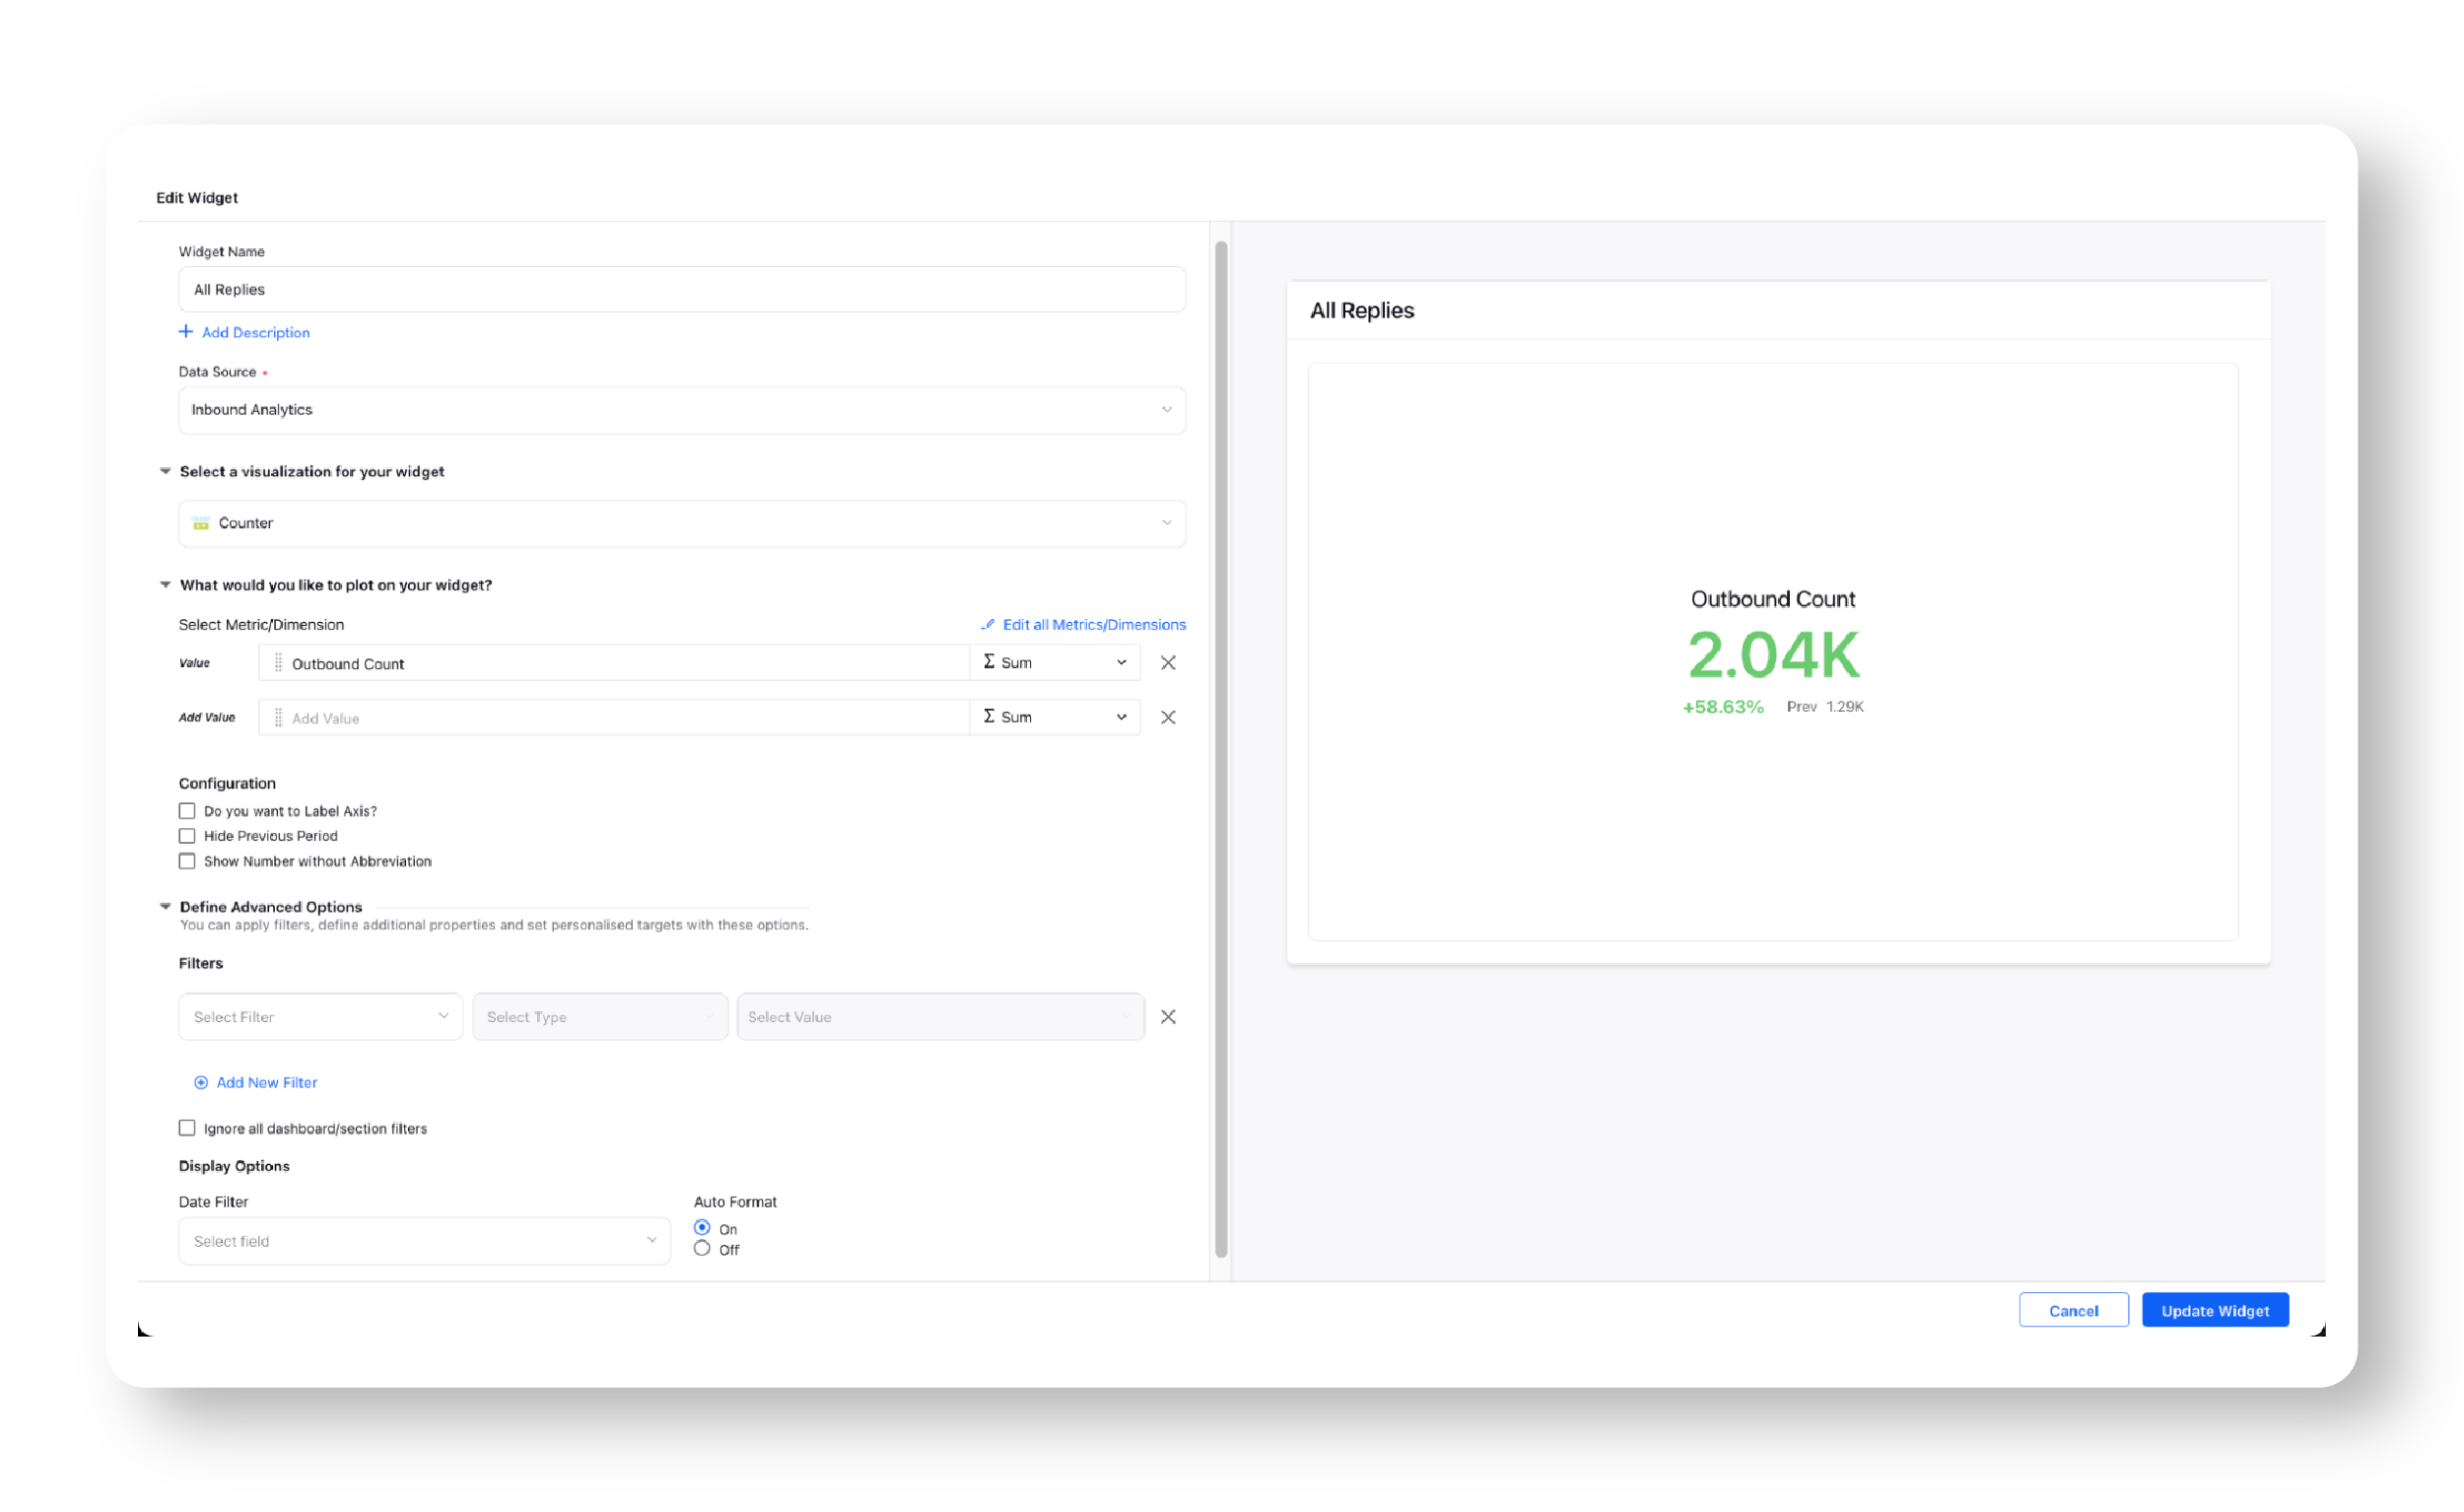
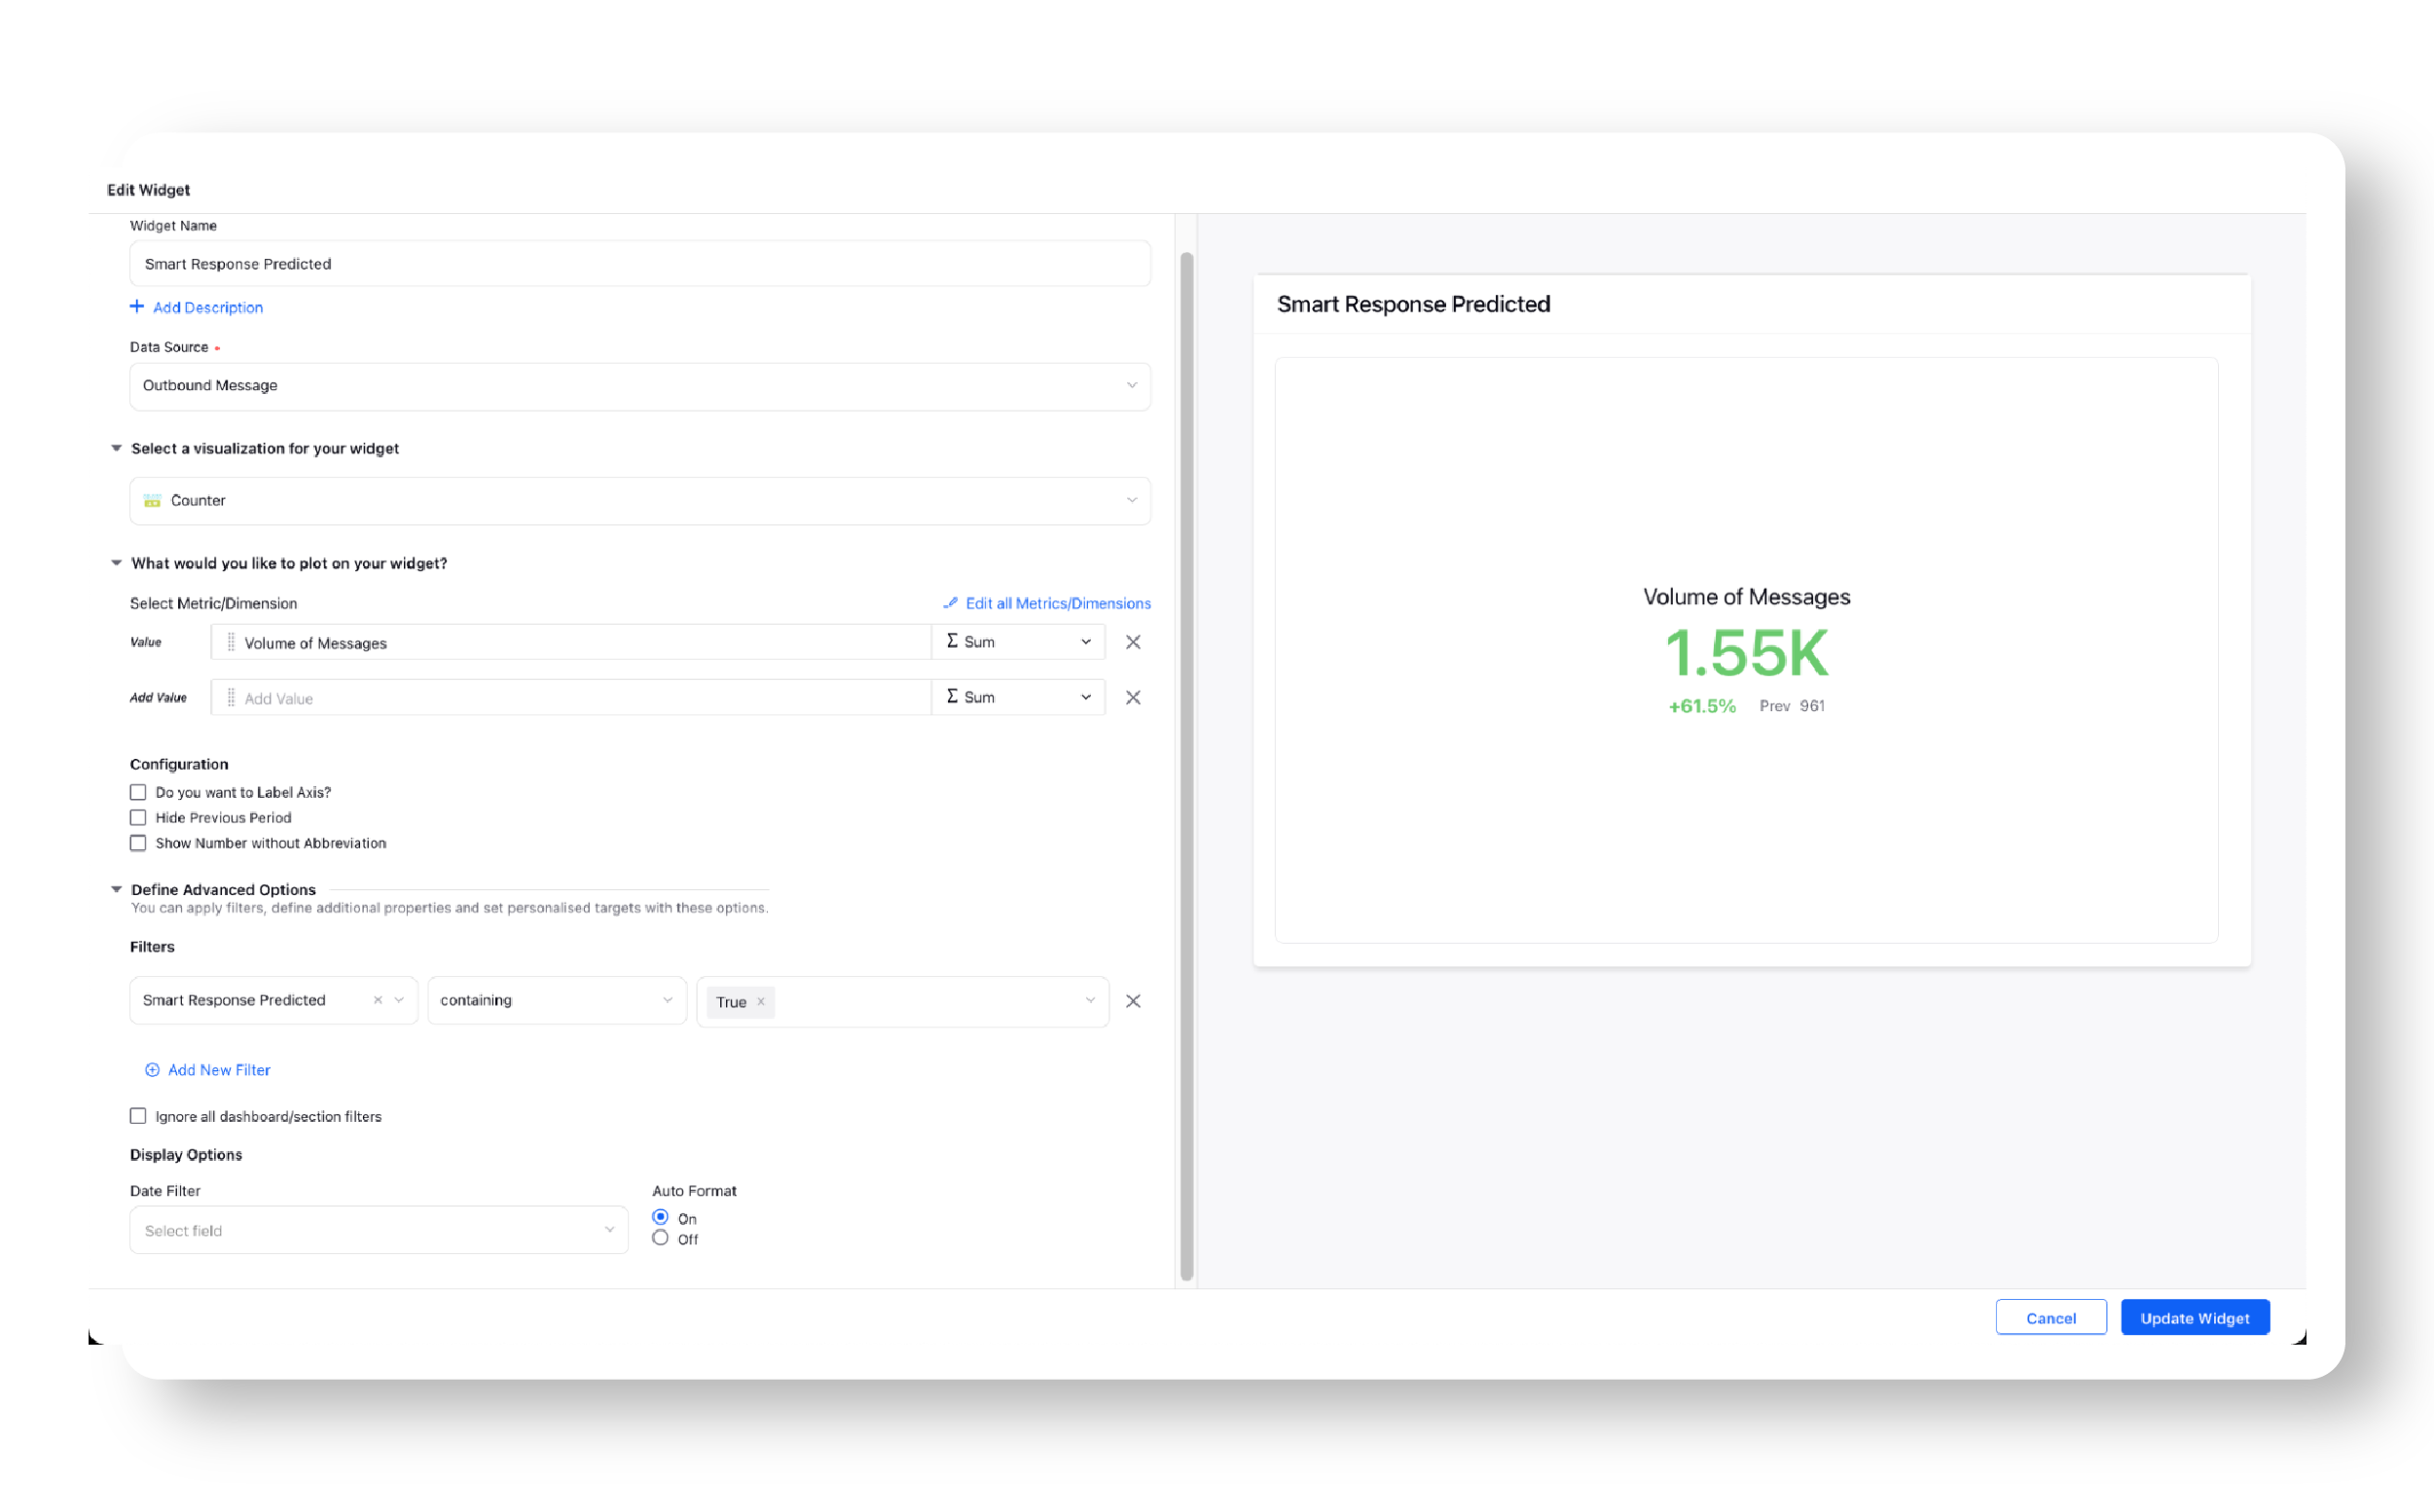
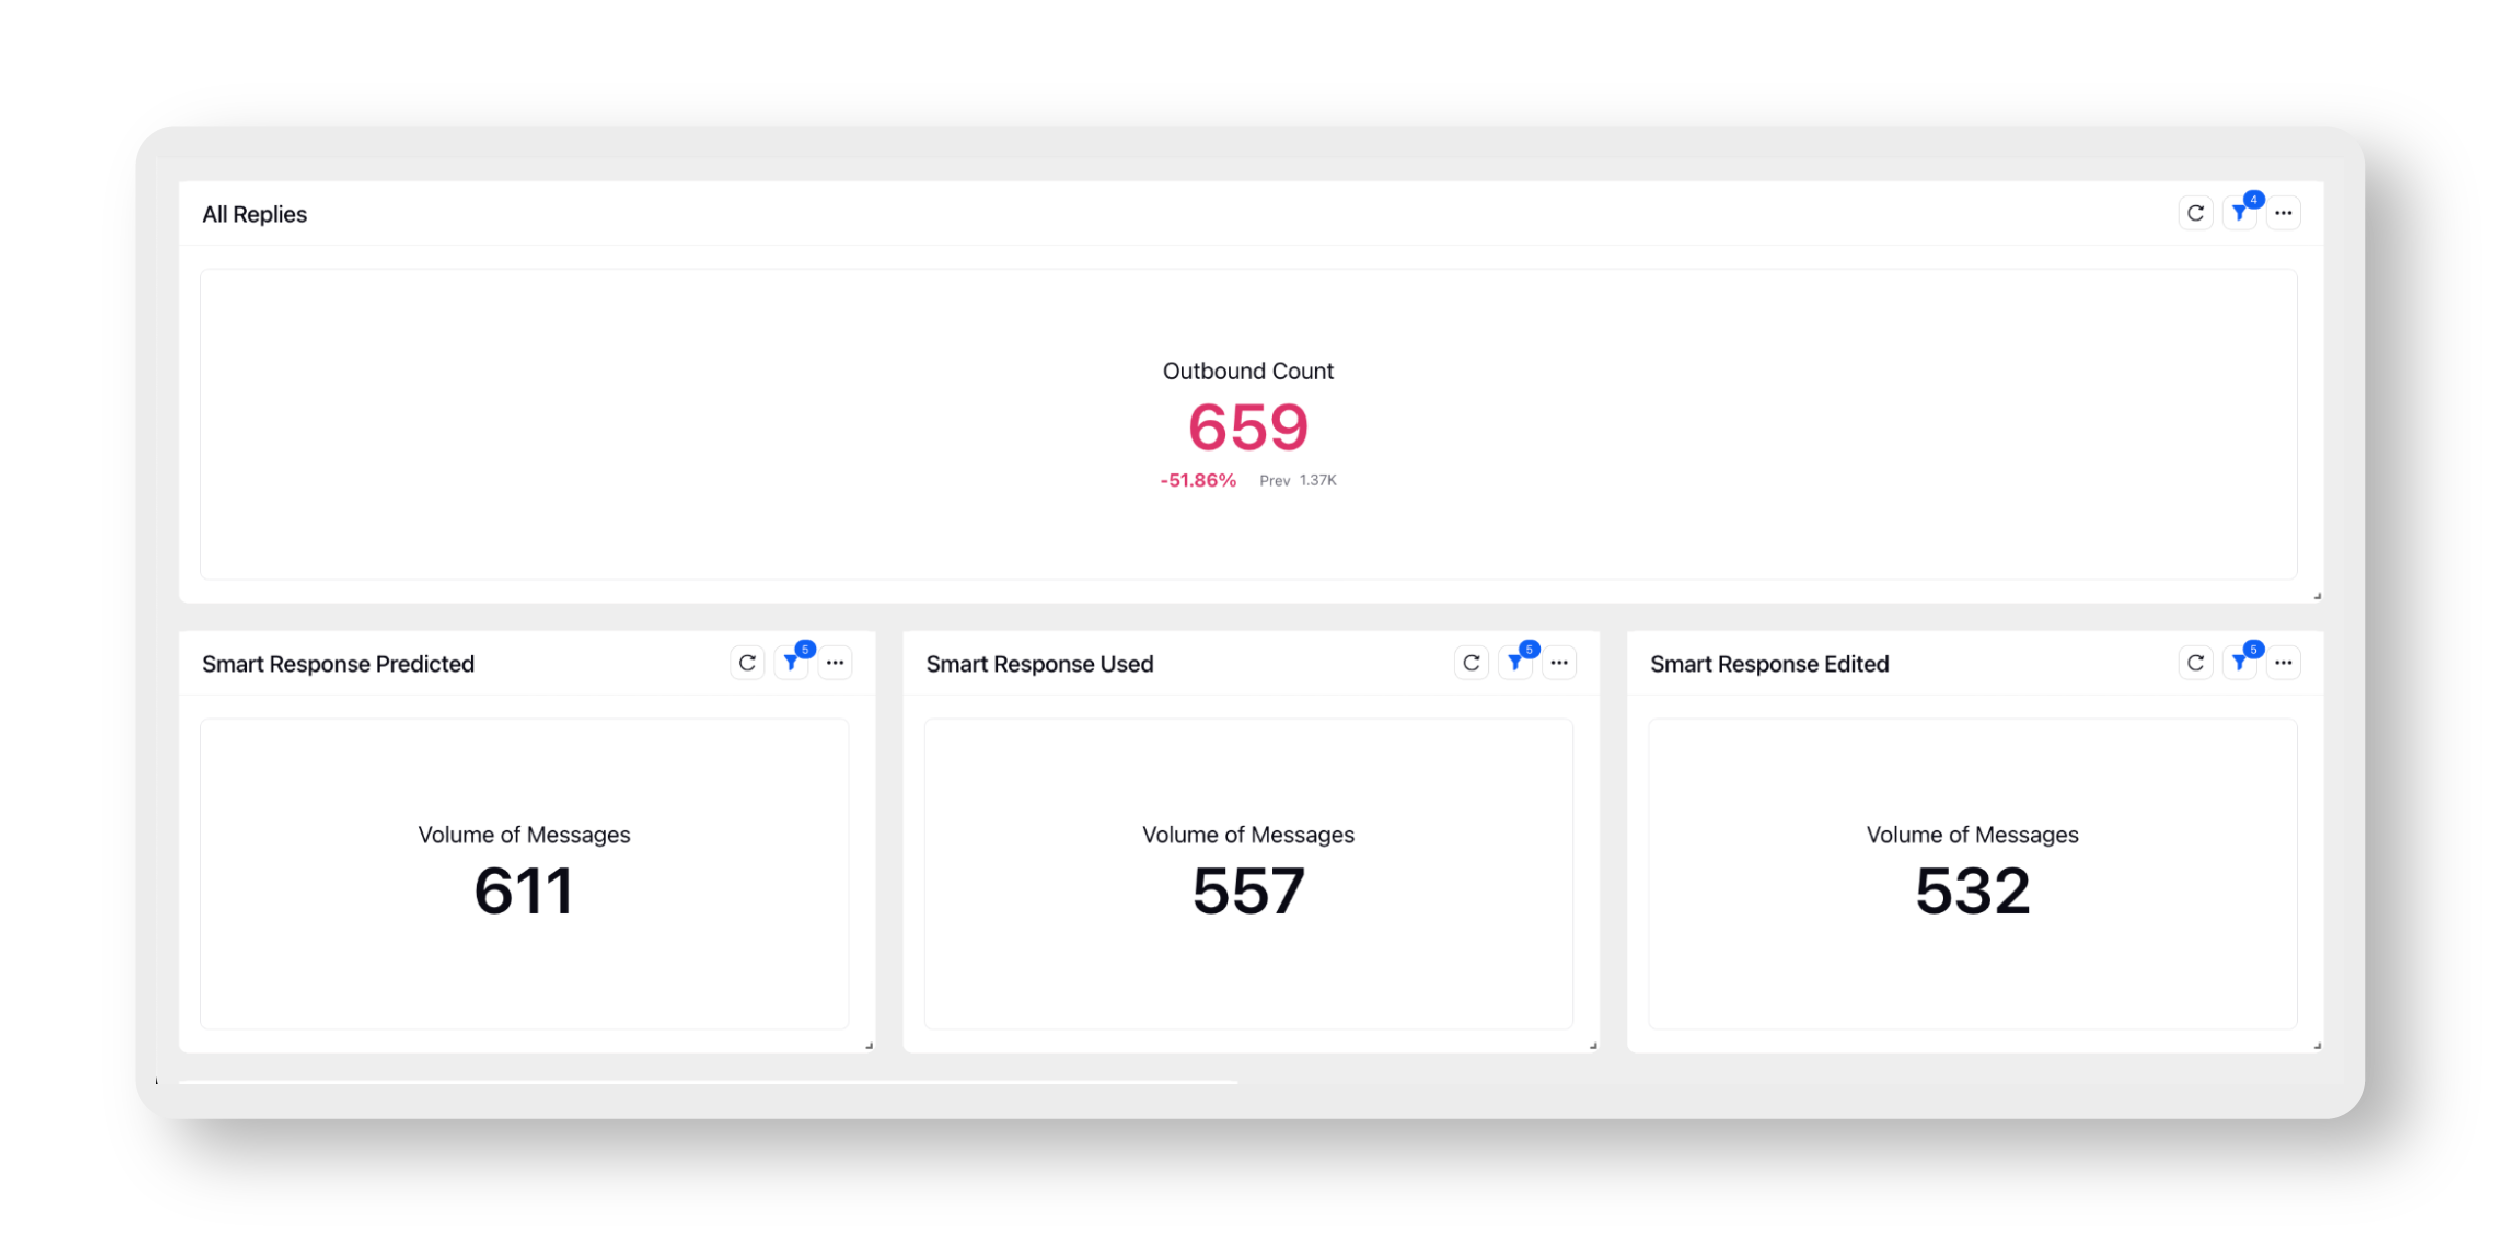
By selecting Time Range as a dimension and All Replies (Metric: Outbound Count), Smart Response Predicted, Smart Response Used, Smart Response Edited and Smart Response Viewed as different metrics, you can create the following report.
Outbound Count Reporting Widget
Smart Responses Predicted Widget
Smart Response Used Widget
Smart Response Edited Widget
Smart Response Viewed Widget
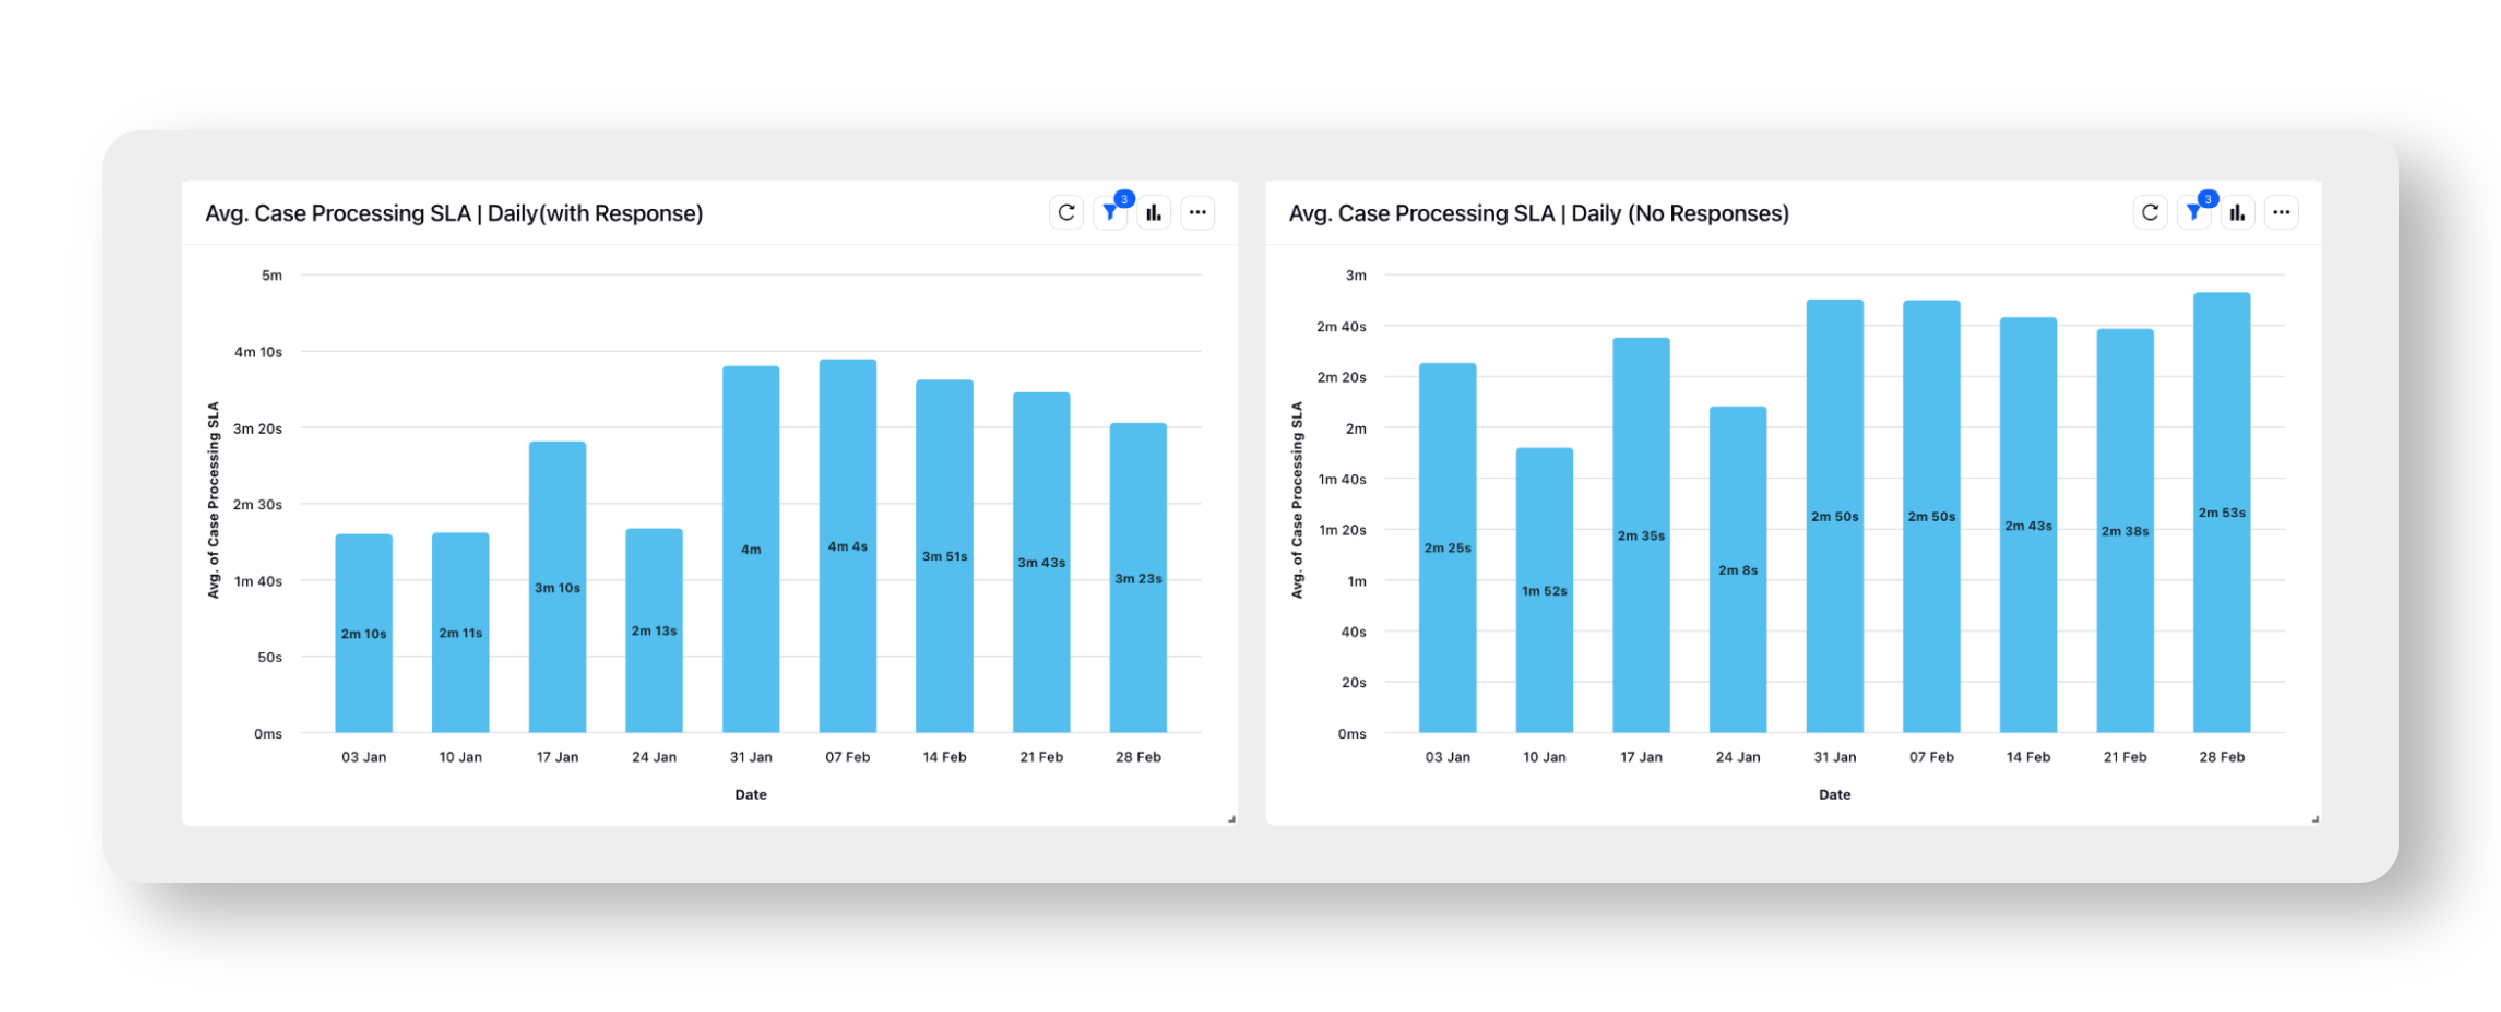
Comparison of Average Case Processing SLA when Smart Response was Used/Not Used
In the following example, you can see that the average time of Case Processing SLA has been reduced every week with the usage of Smart Responses, as compared to when it was not being used.
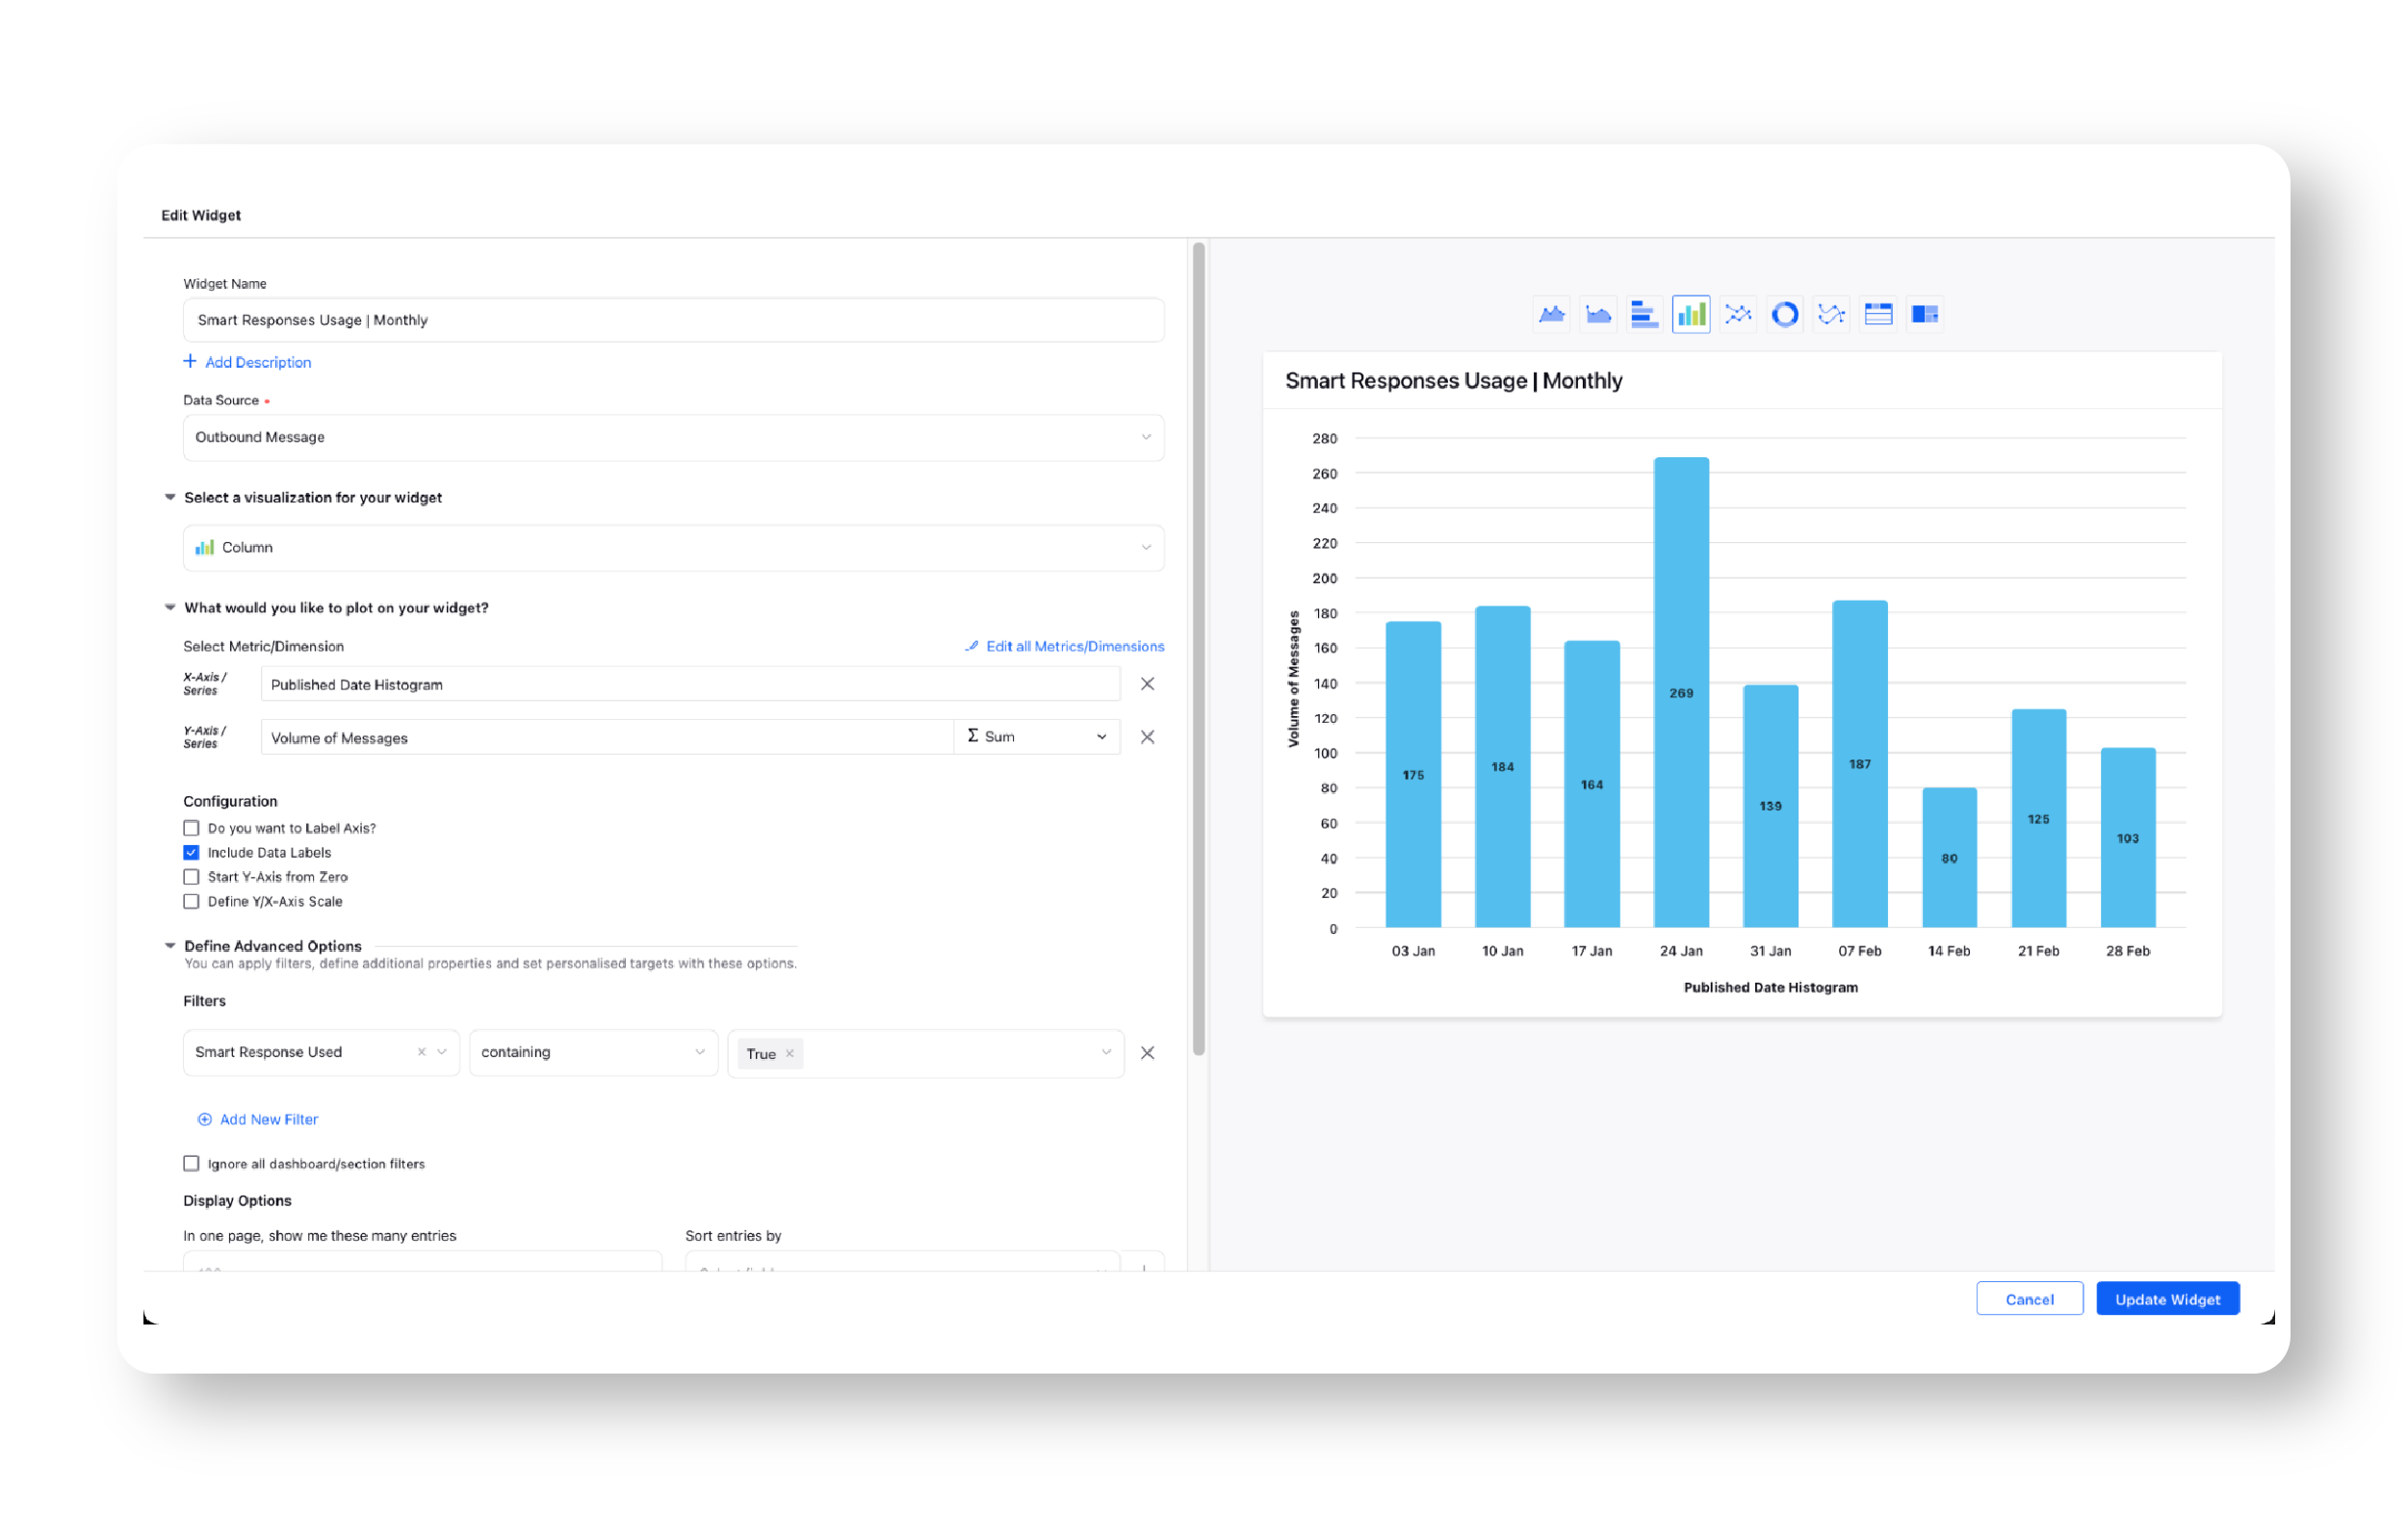
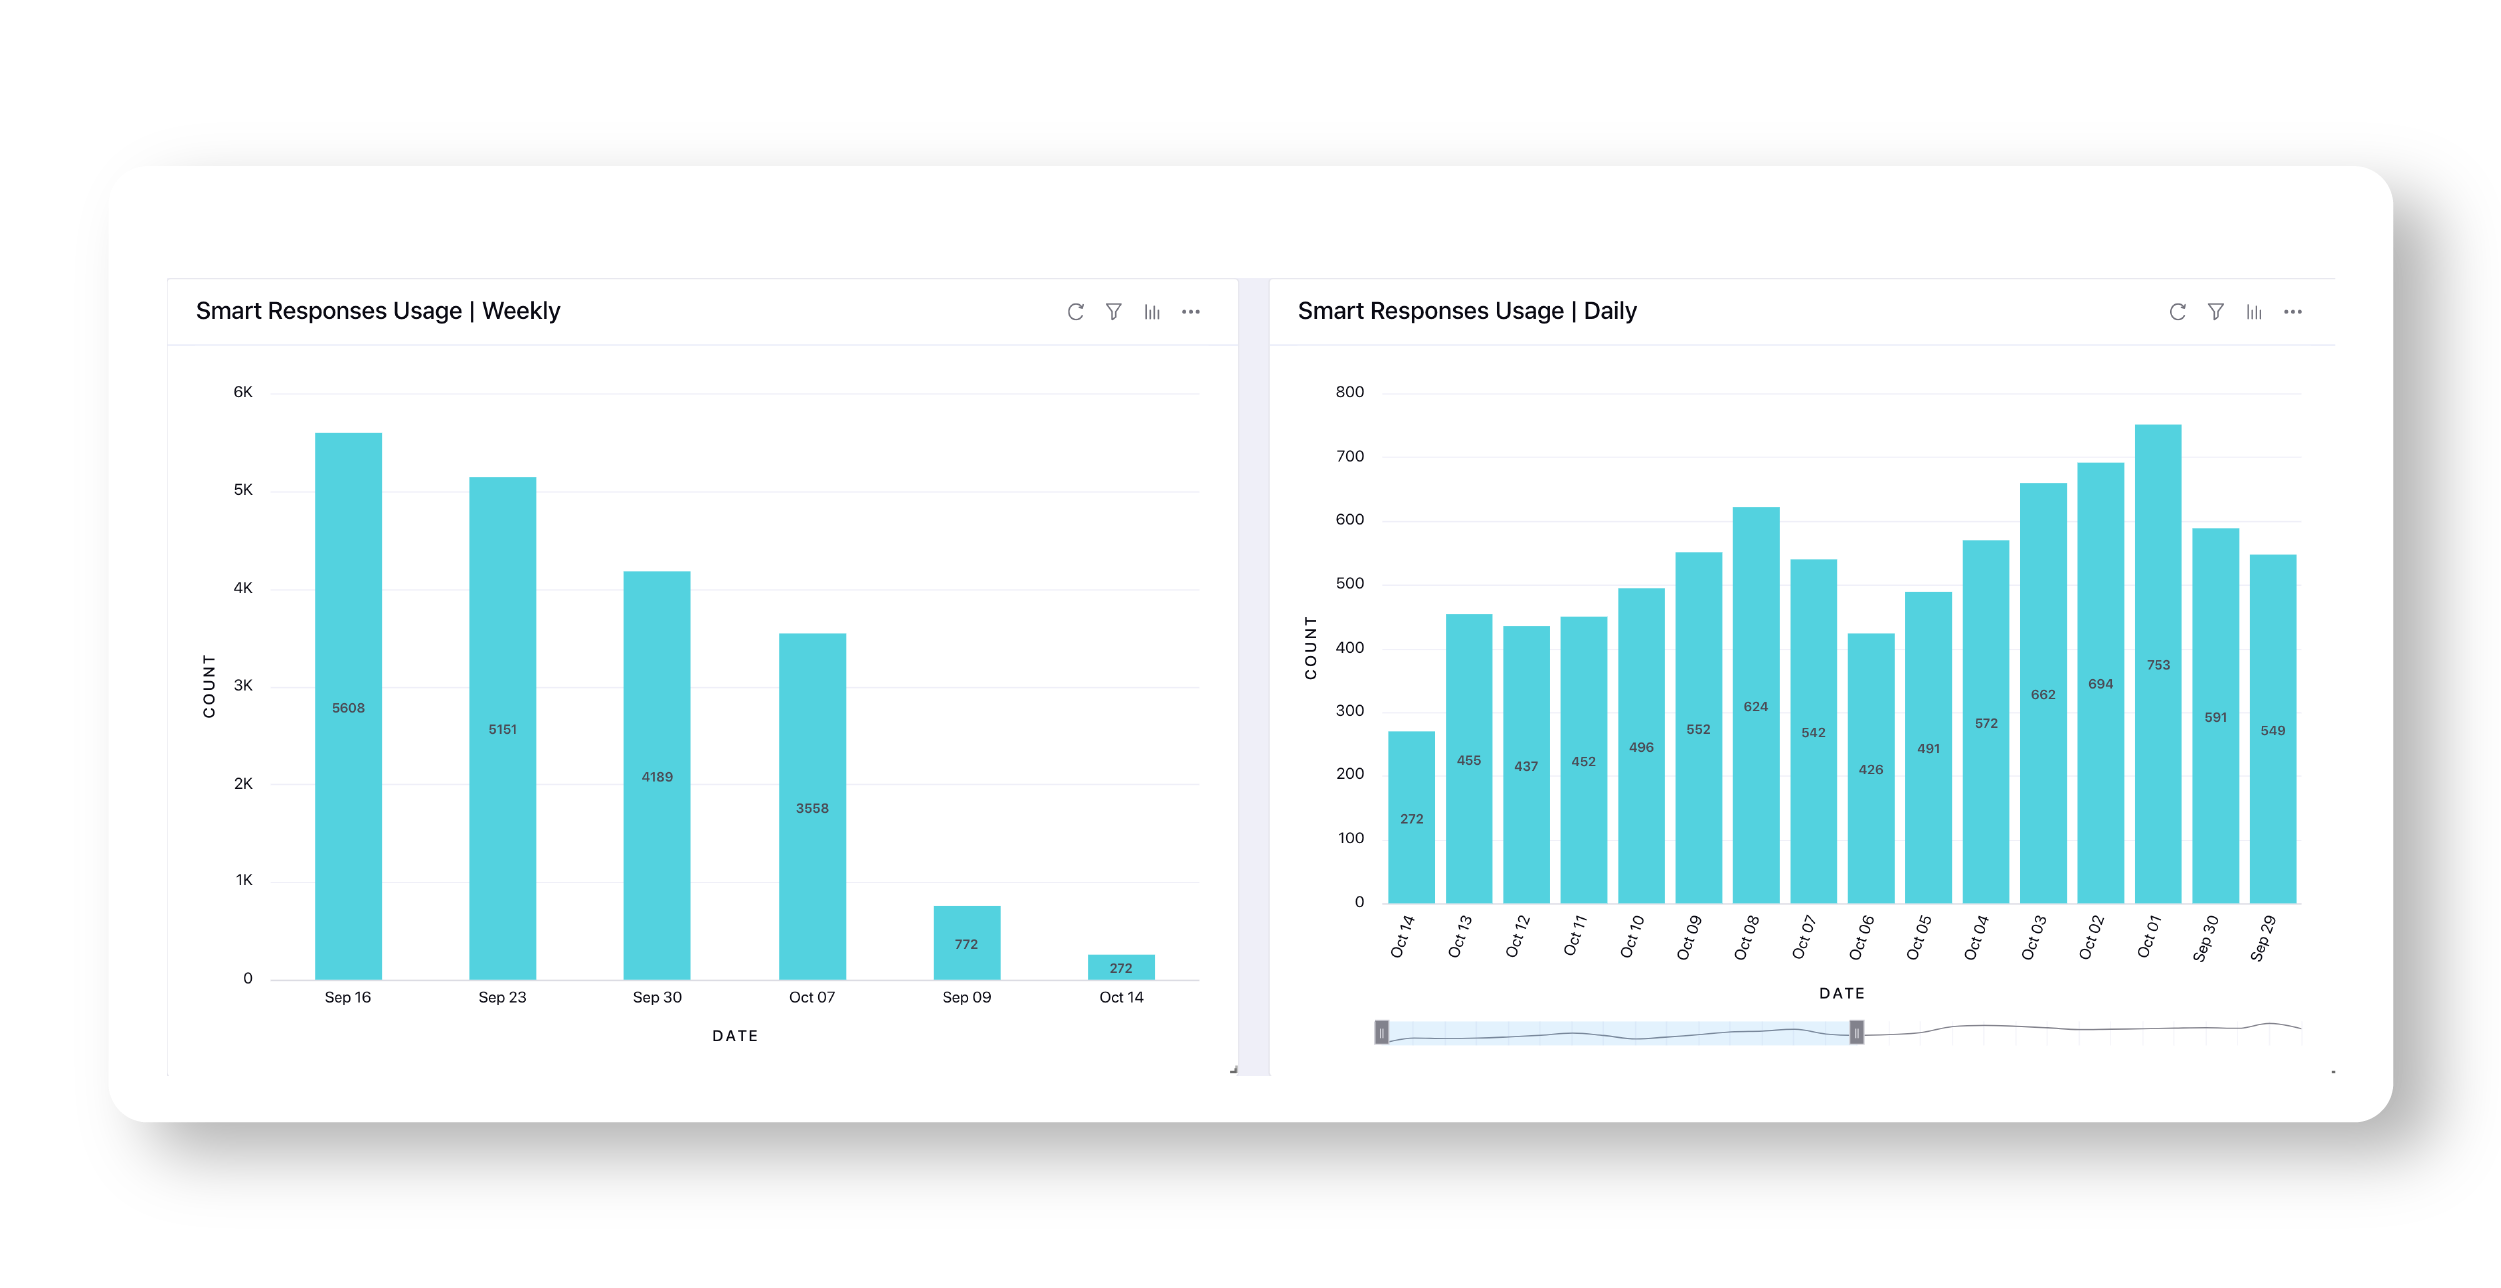
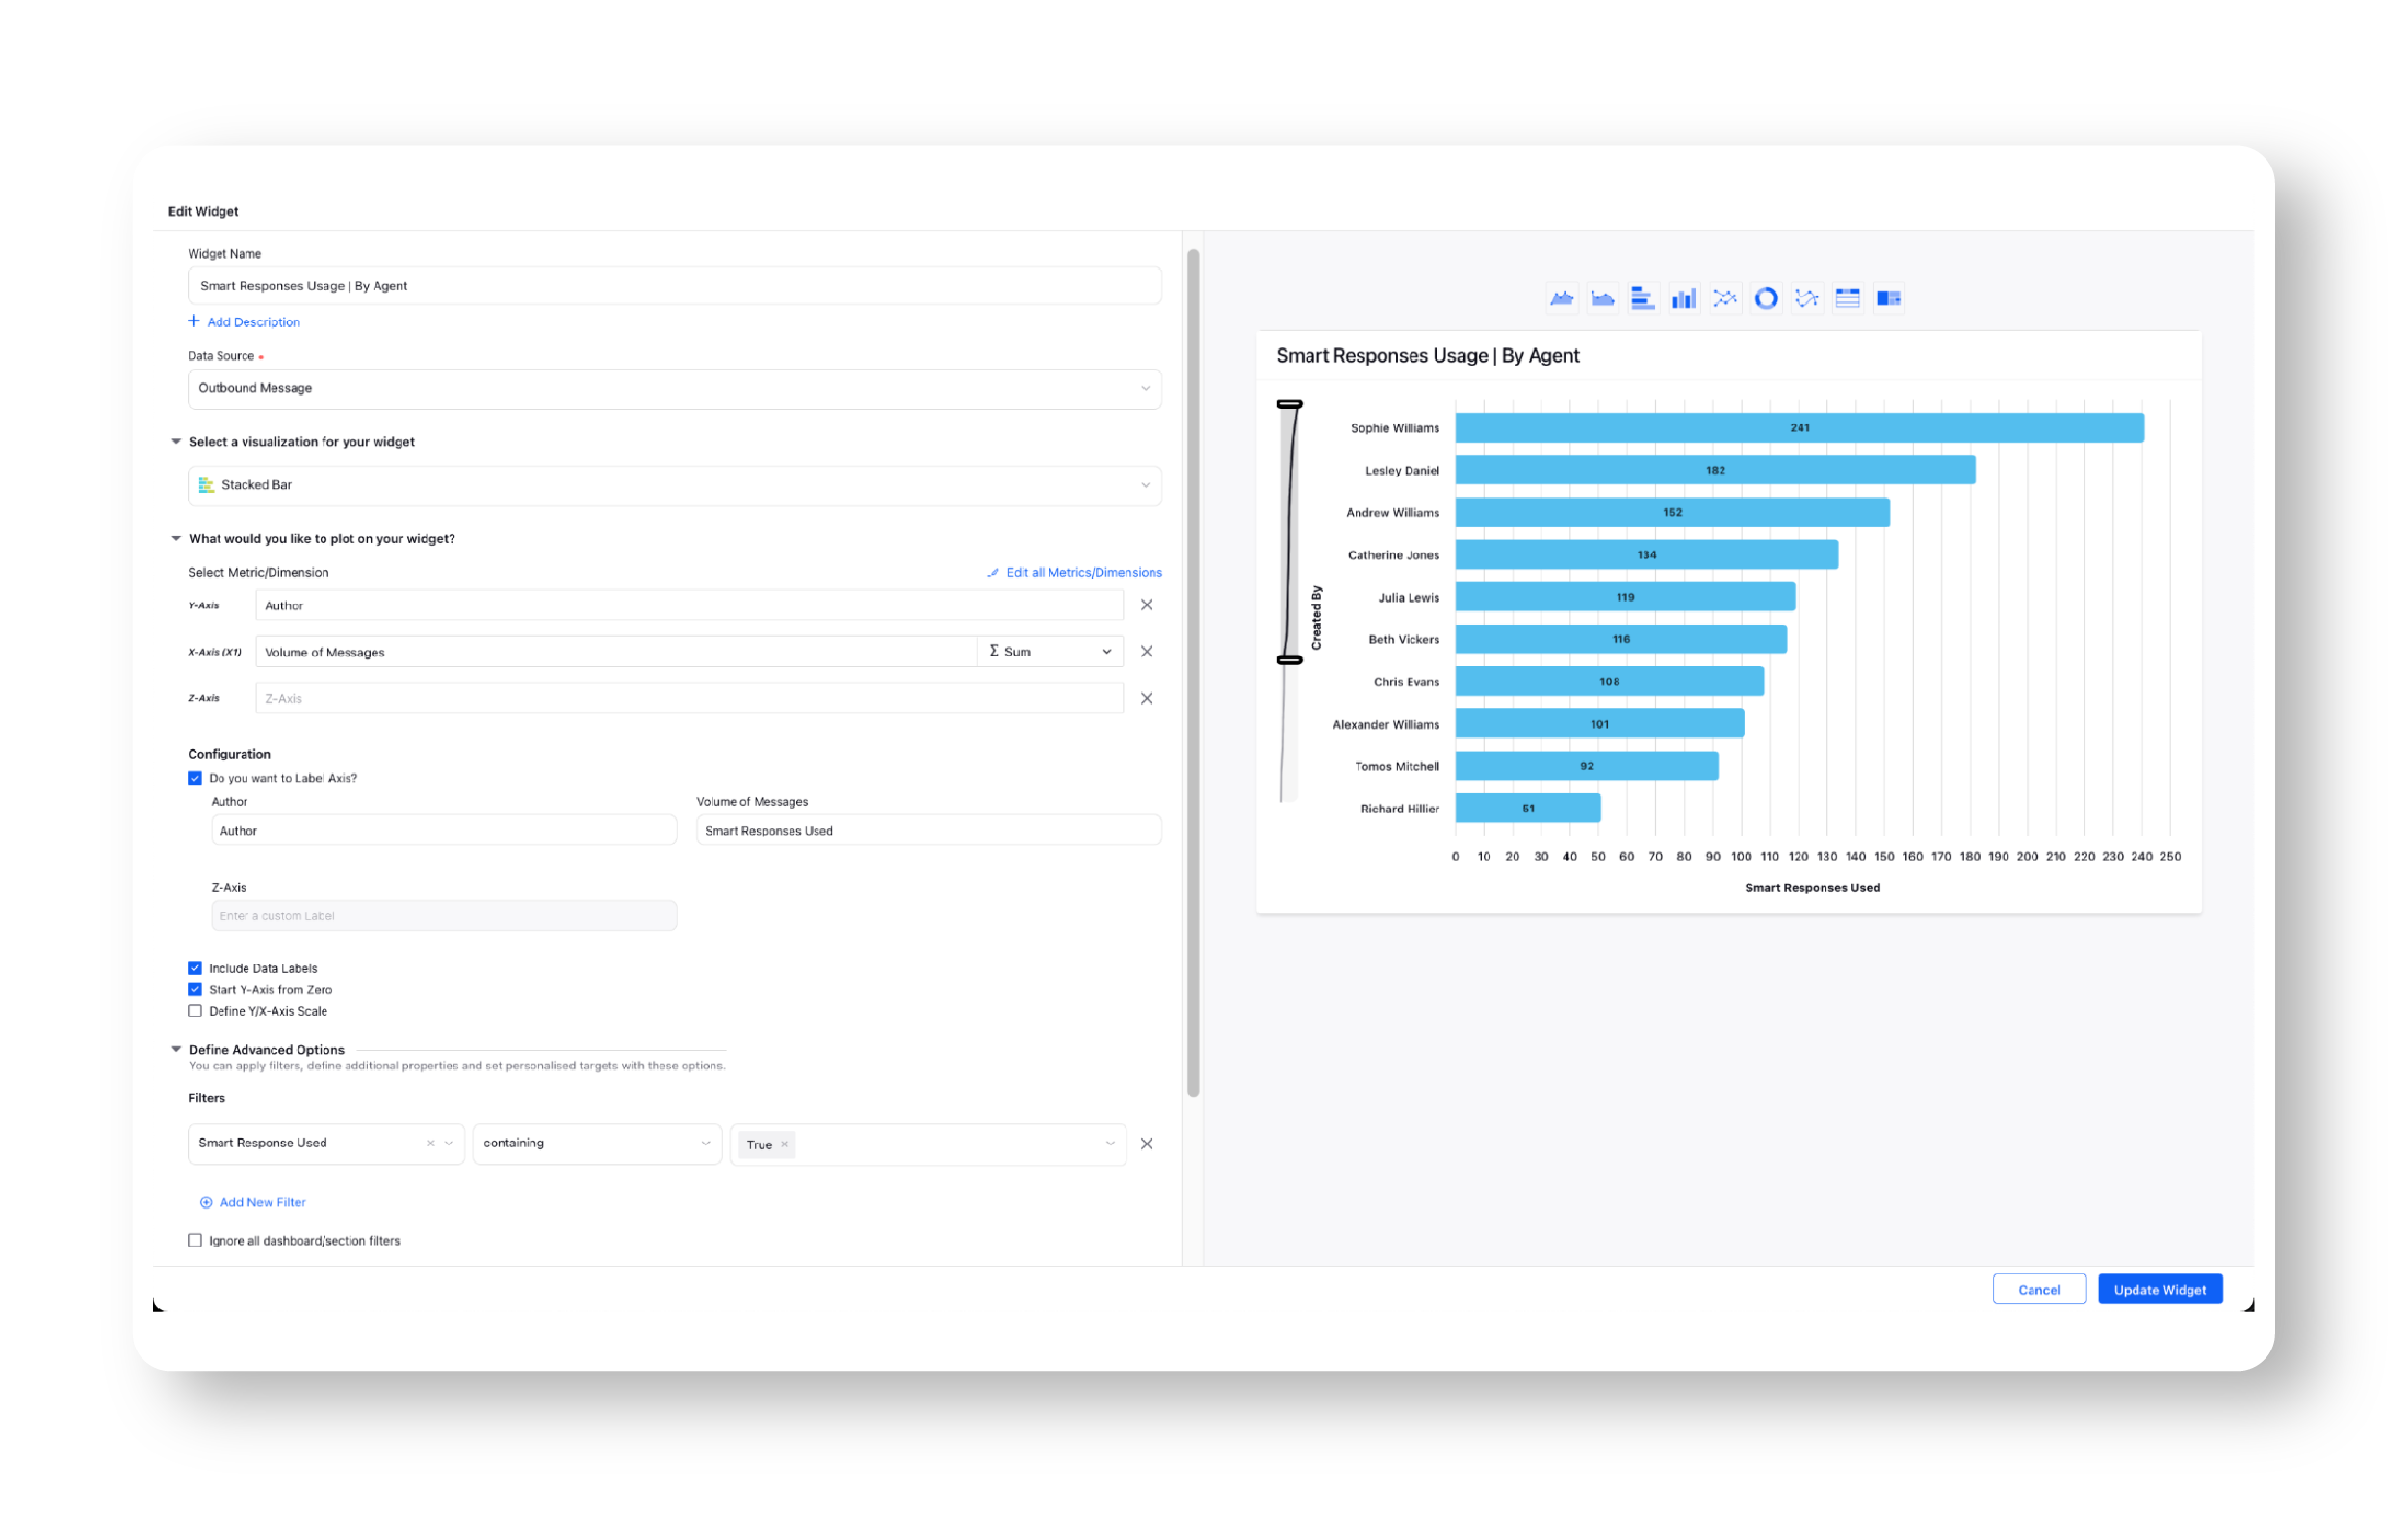
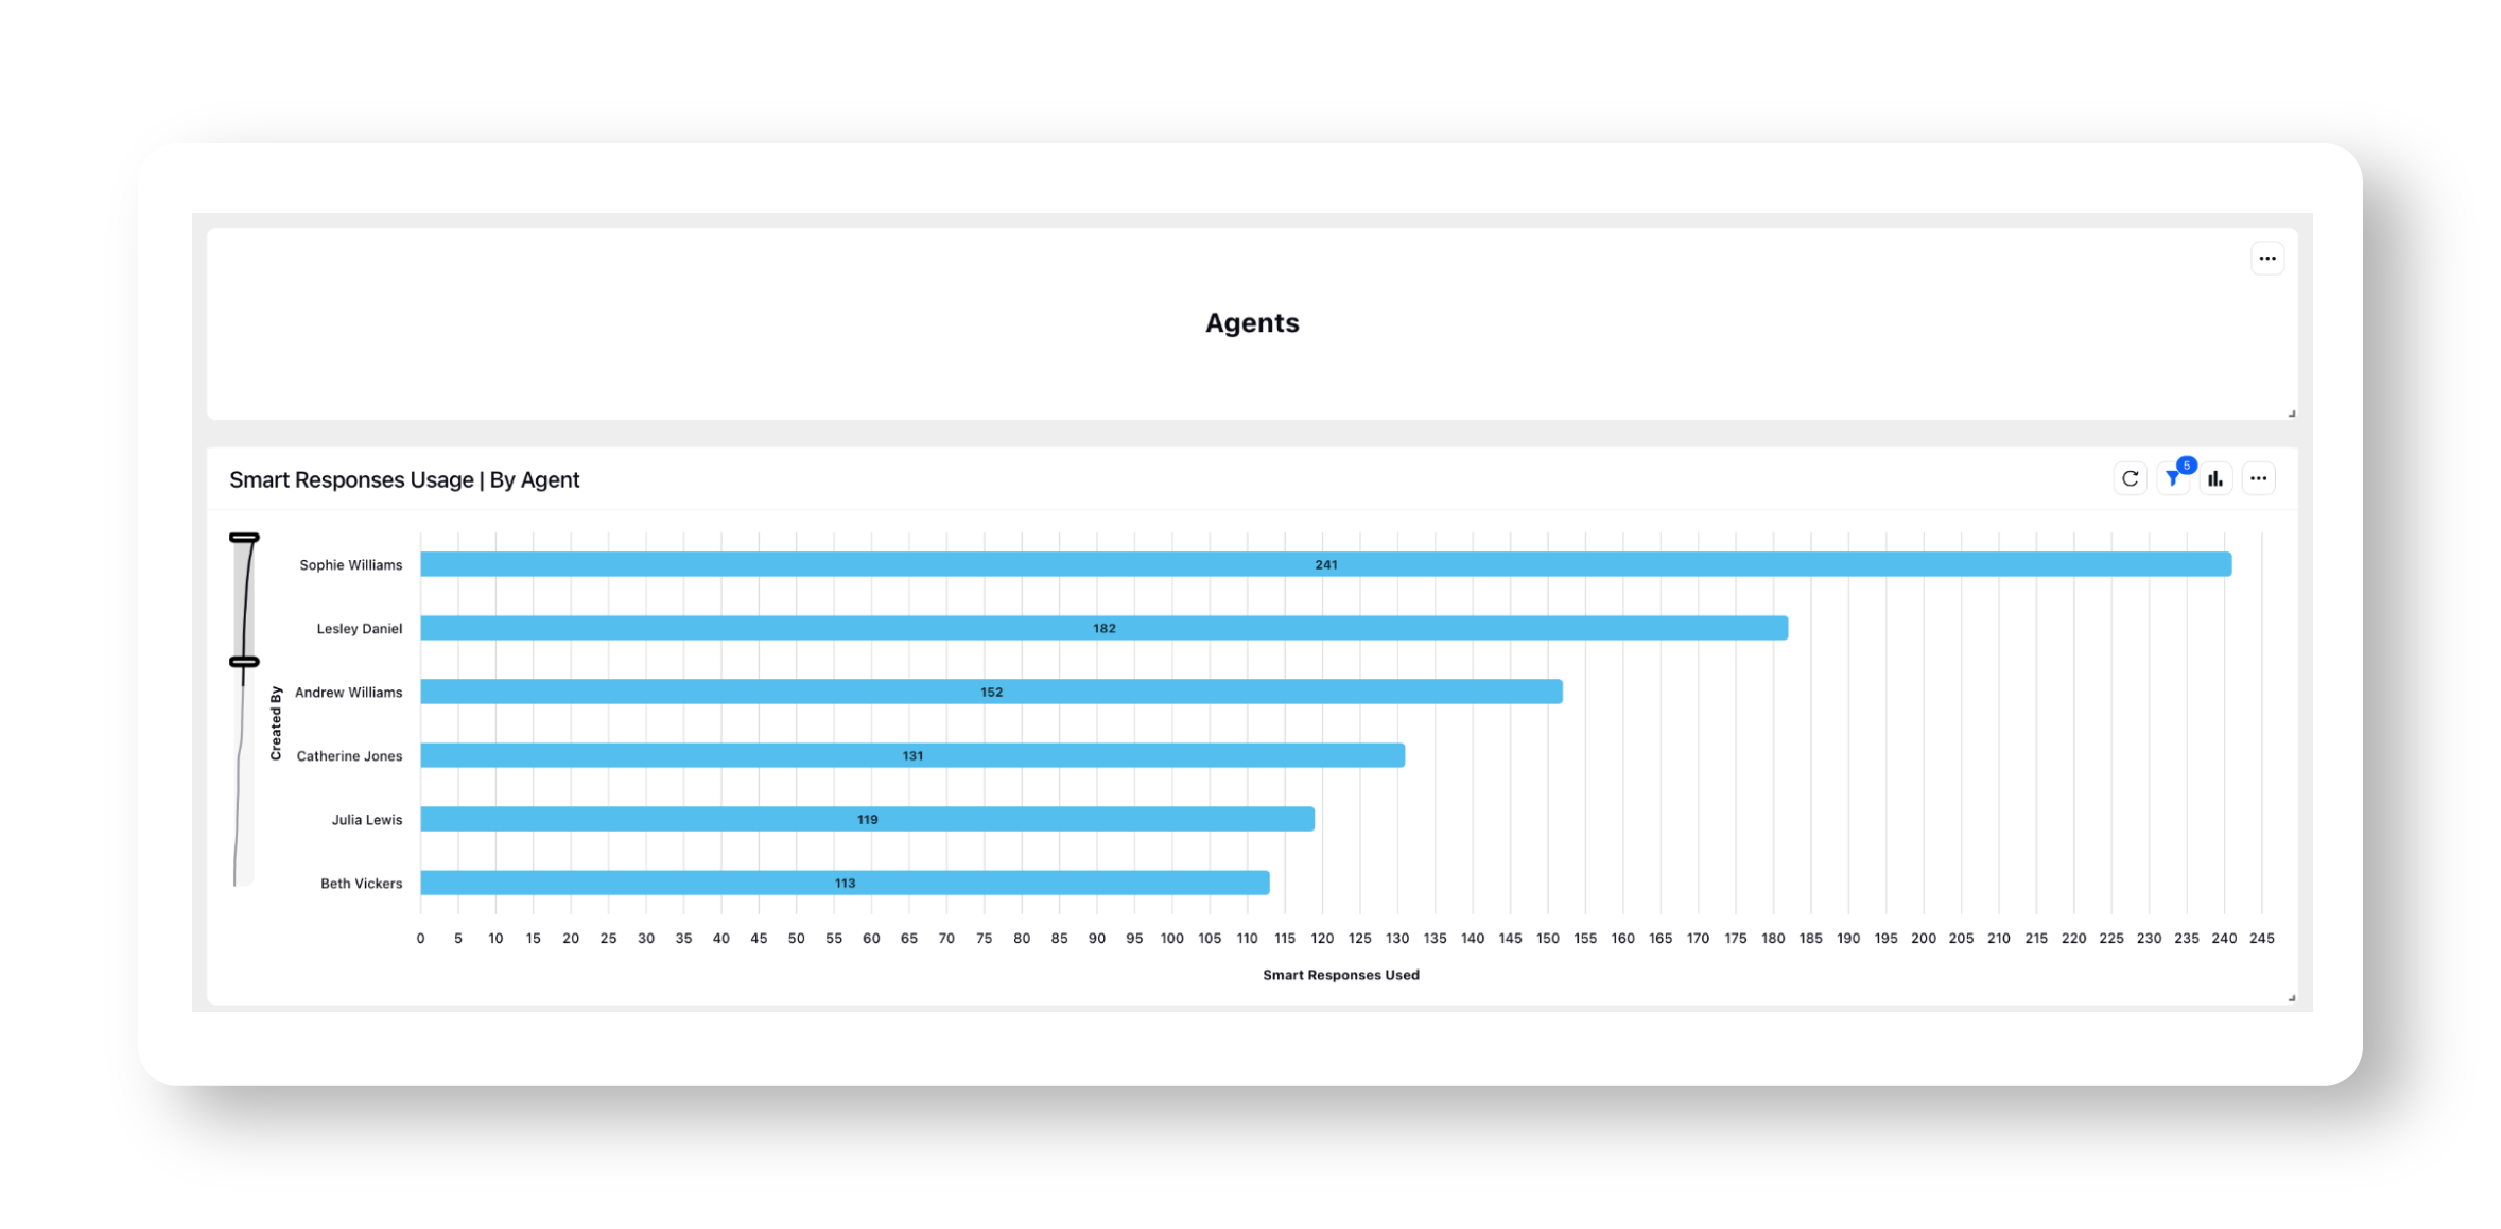
Weekly/Daily Usage of Smart Responses by Agents
You can also see the usage of Smart Responses by agents for a selected time period.
The following charts show you how many Smart Responses were used by agents on a daily and a weekly basis, in a single pane.
Smart Response Usage by Agents in Numerical
You can also view a tabular representation of Smart Responses used in numeric format and compare their usage. By hovering over it, you can get the data of individual agents to identify areas of optimization for these responses.
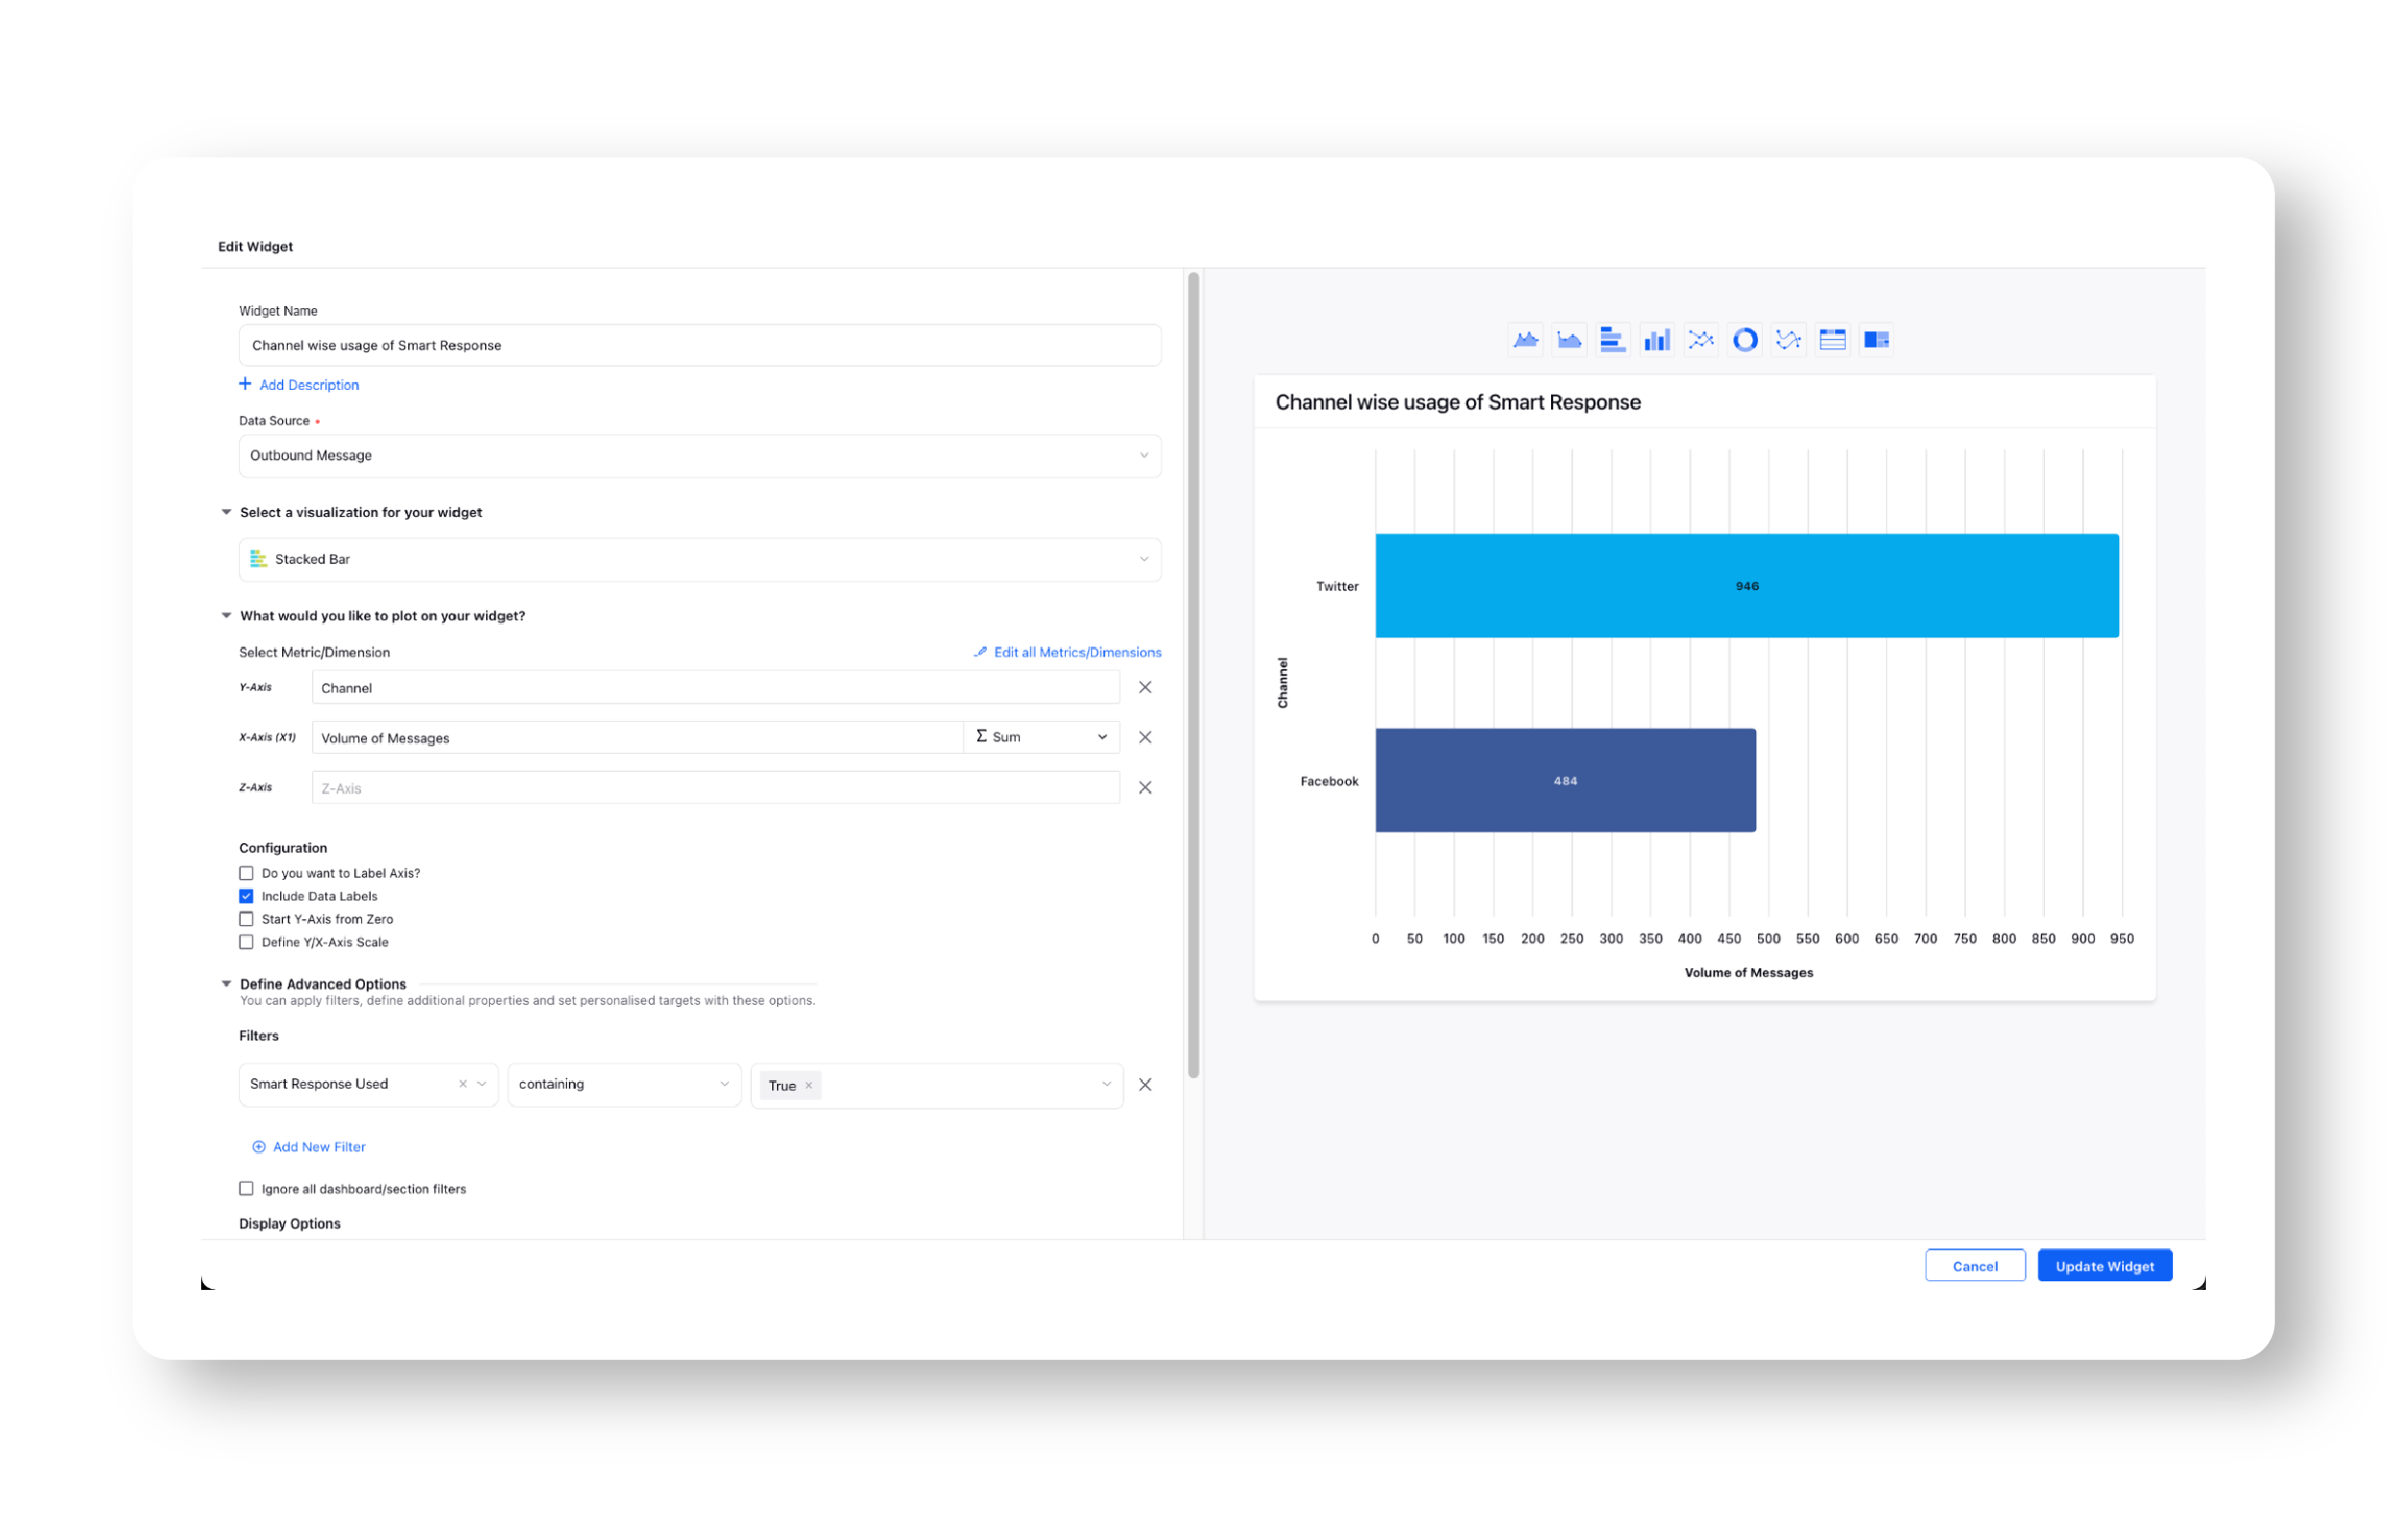
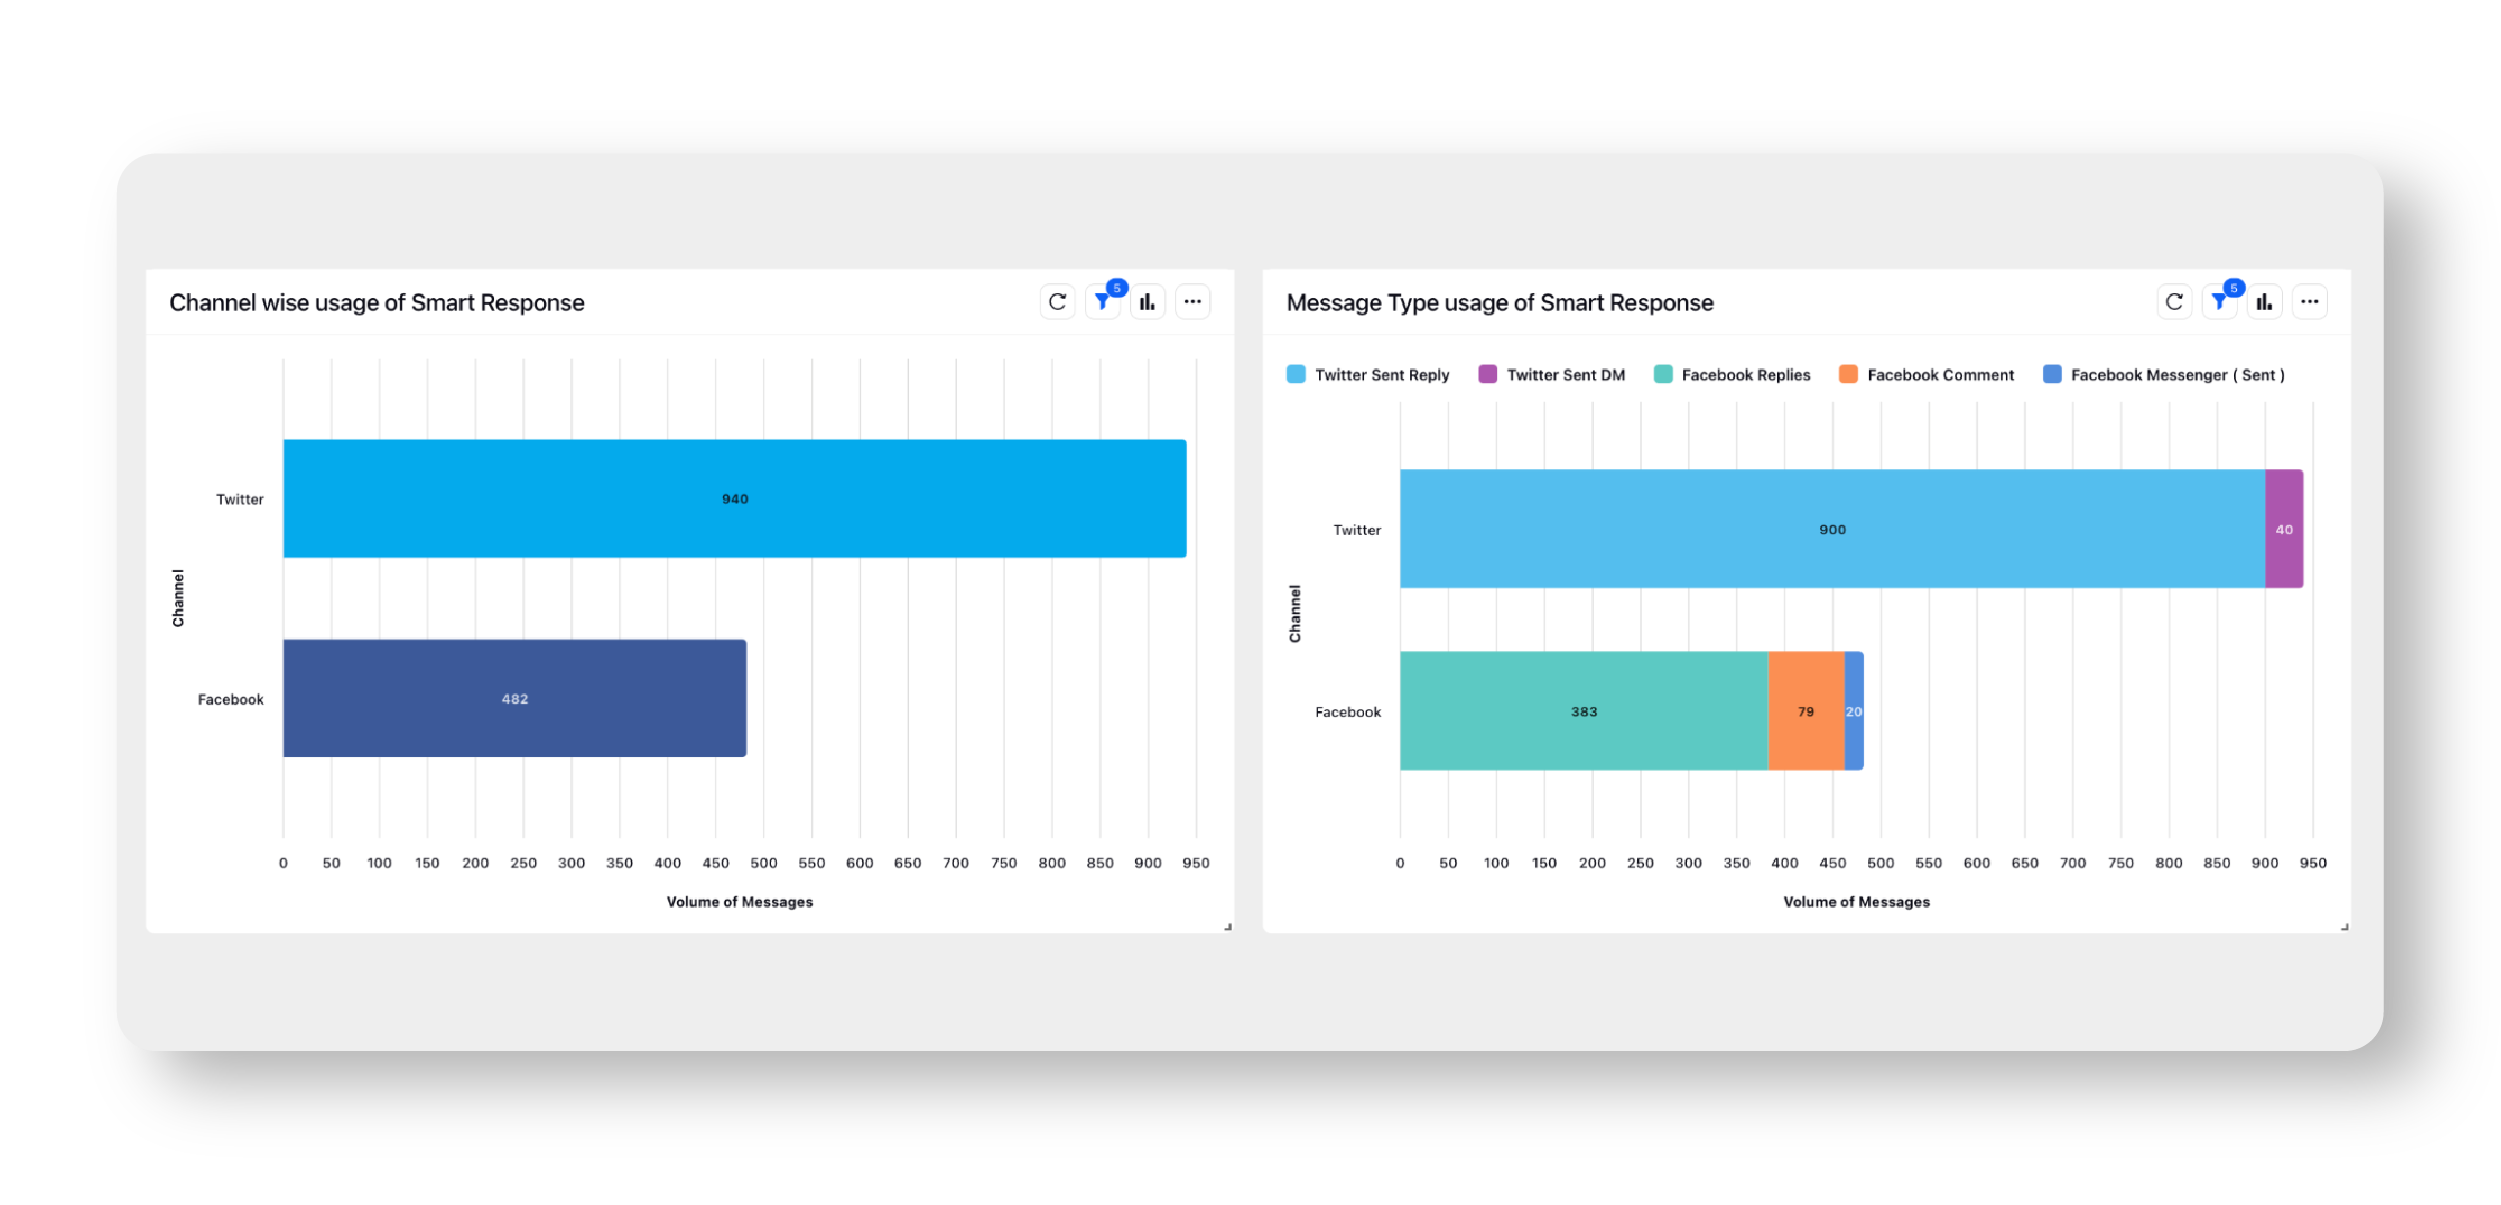
Channel-wise and Message type-wise Usage of Smart Responses
You can view the channel-wise and message type-wise usage of Smart Responses by selecting the desired channels. This can help you to understand ways to improve its usage across different channels.