Campaign Analytics
Updated
The Campaign Overview Dashboard can help you to compare different campaigns and shows the performance of those campaigns. Specific widgets can be found in the Campaign Overview Dashboard. Each of these widgets can be drilled down for more in-depth reporting.
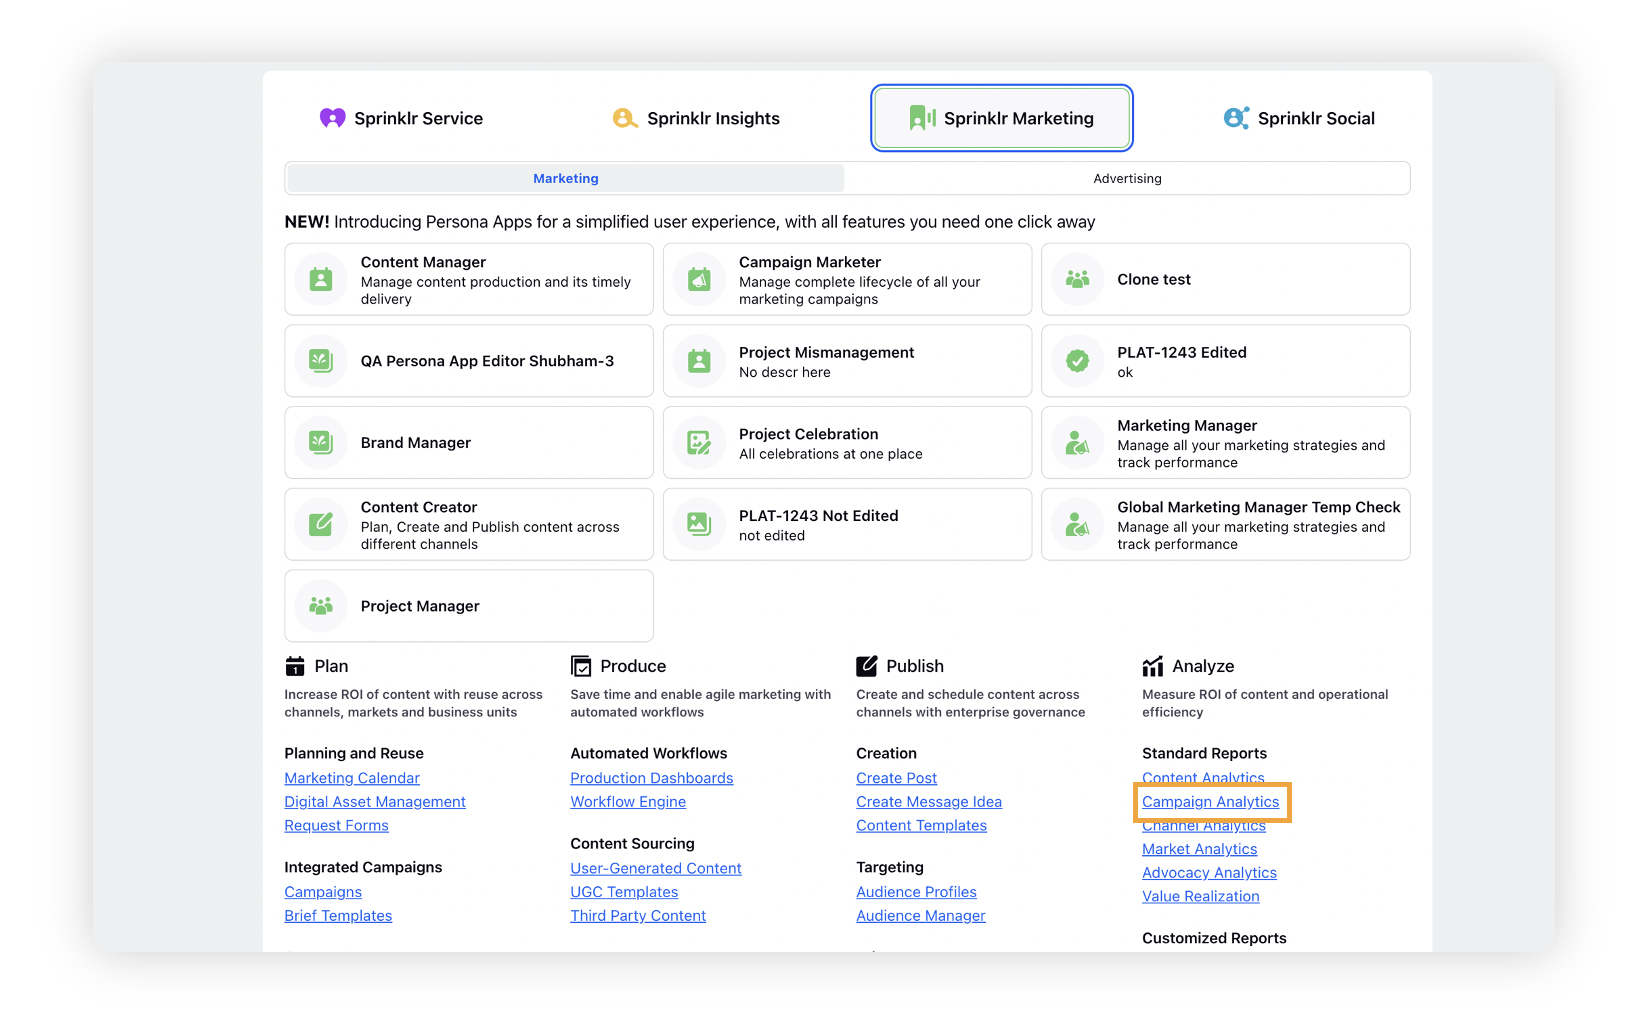
You can access this dashboard by:
Clicking the New Tab icon.
Under Sprinklr Marketing, switch to the Marketing section.
Then click Campaign Analytics within Analyze.
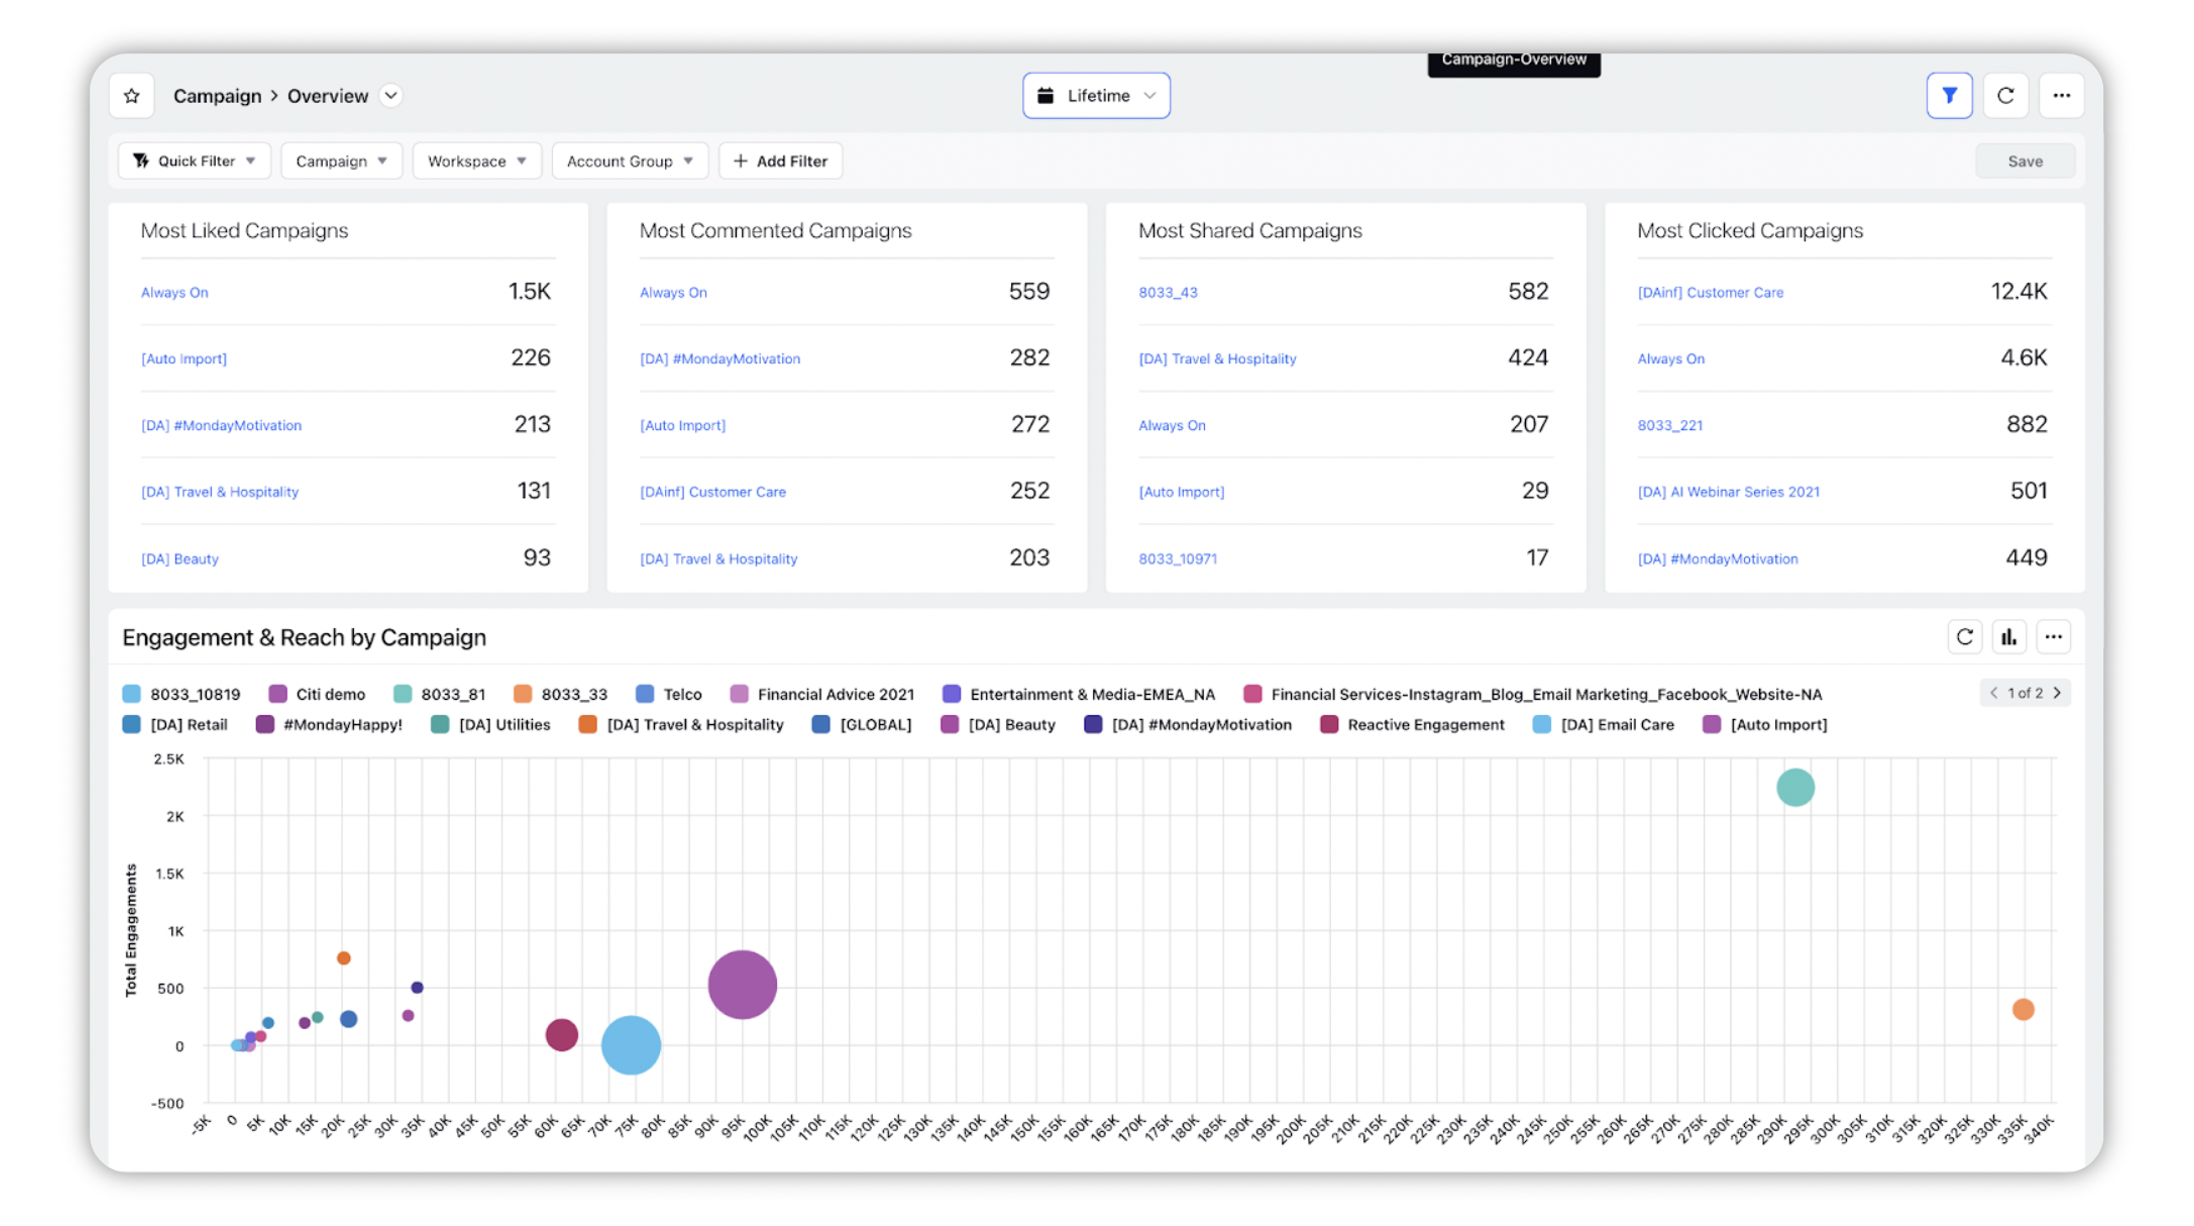
Widgets in Campaign Analytics Dashboard
Most Liked Campaigns
In this campaign overview, you can see the campaigns that are liked the most.Most Commented Campaigns
In this campaign overview, you can view the campaigns that got the most comments.Most Shared Campaigns
In this campaign overview, you can view the campaigns that are shared the most.Most Clicked Campaigns
In this campaign overview, you can view the campaigns that got the most number of clicks.Engagement & Reach by Campaign
In this campaign overview, you can see Post Reach, Total Engagements, Campaign, and Volume of Published Messages. You can visualize this in Table, Stacked Bar, Stacked Column, Area Chart, Area Spline Chart, Spline Trend Chart, Line Trend Chart, Combination and Bubble Chart format.Campaign Scorecard
In this campaign widget, you can see how each campaign fared. You can view the Campaign, Volume of Published Messages, Total Engagements, Post Likes And Reactions, Post Comments, Post Shares, Estimated Clicks, and Post Reach. You can visualize this in Table, Stacked Bar, Stacked Column, Area Chart, Area Spline Chart, Spline Trend Chart, Line Trend Chart and Combination format.