Channel Analytics
Updated
About Channel Analytics Dashboard
In the Channel Analytics Dashboard, you can view Engagement over time, Engagement by Channel, Message Scorecard, and Engagement by Account. Each of these widgets can be drilled down for more in-depth reporting.
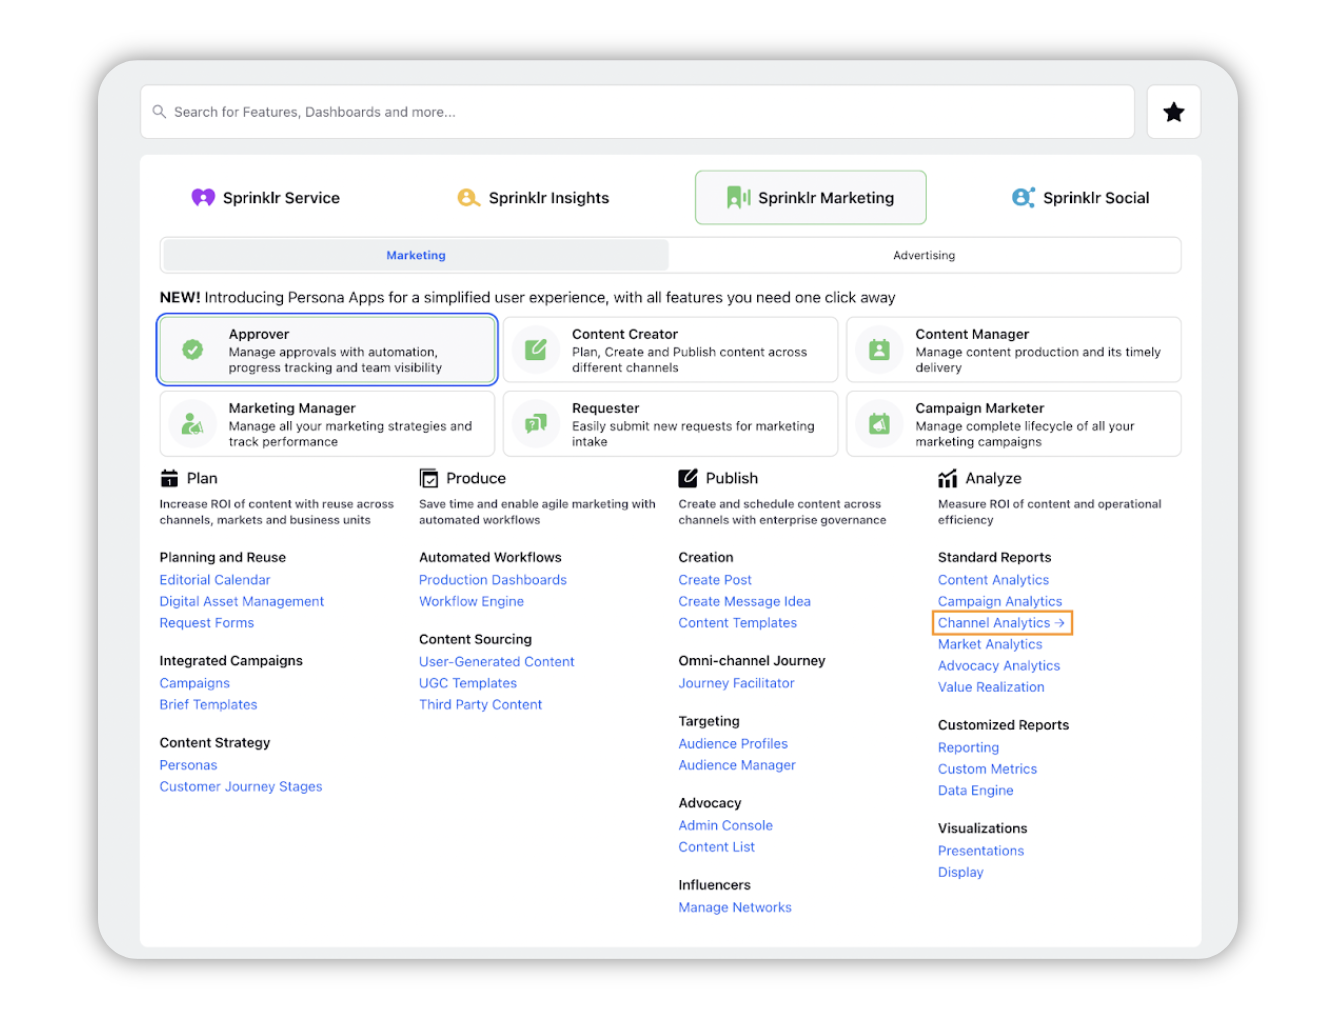
You can access this dashboard by:
Click the New Tab icon.
Under Sprinklr Marketing, select the Marketing section.
Then click Channel Analytics within Analyze.
Channel Analytics Widgets
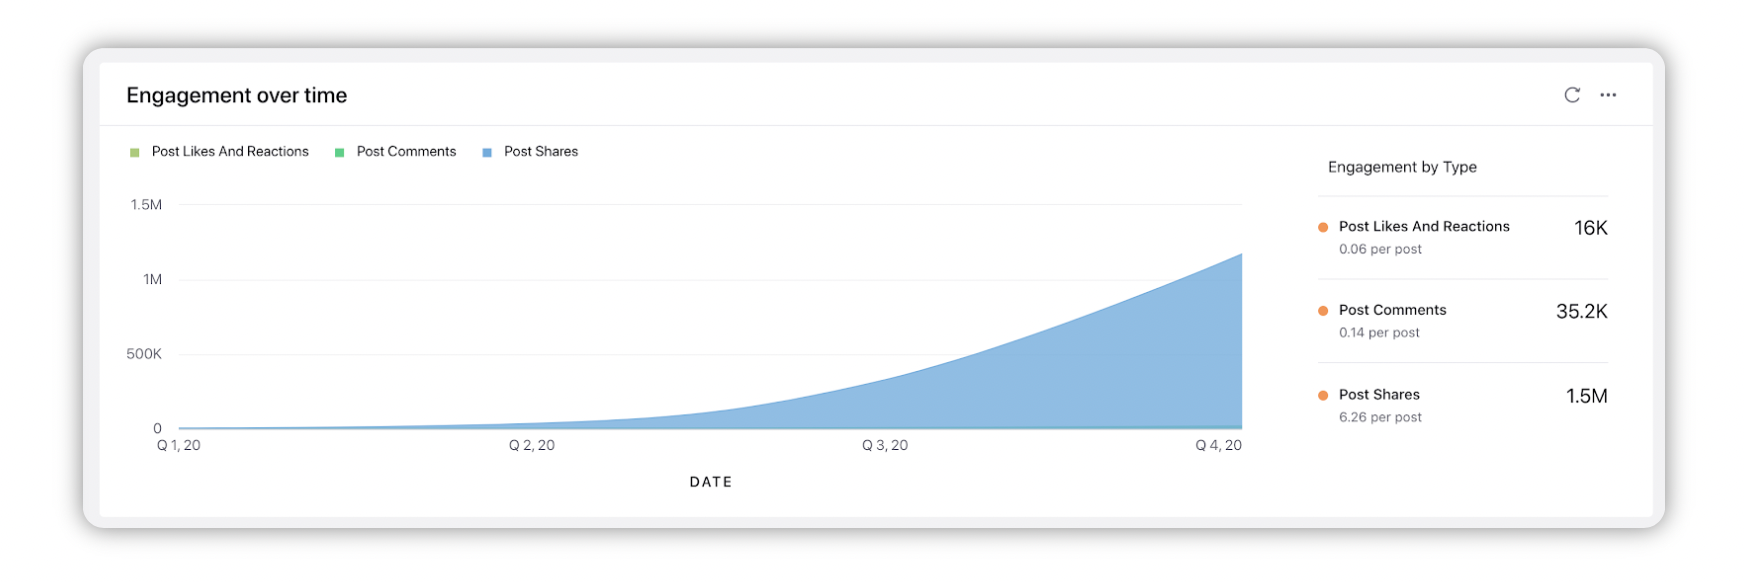
Engagement over time
In Engagement over time Insight, you can view Post Likes And Reactions, Post Comments, and Post Shares over a period of time.
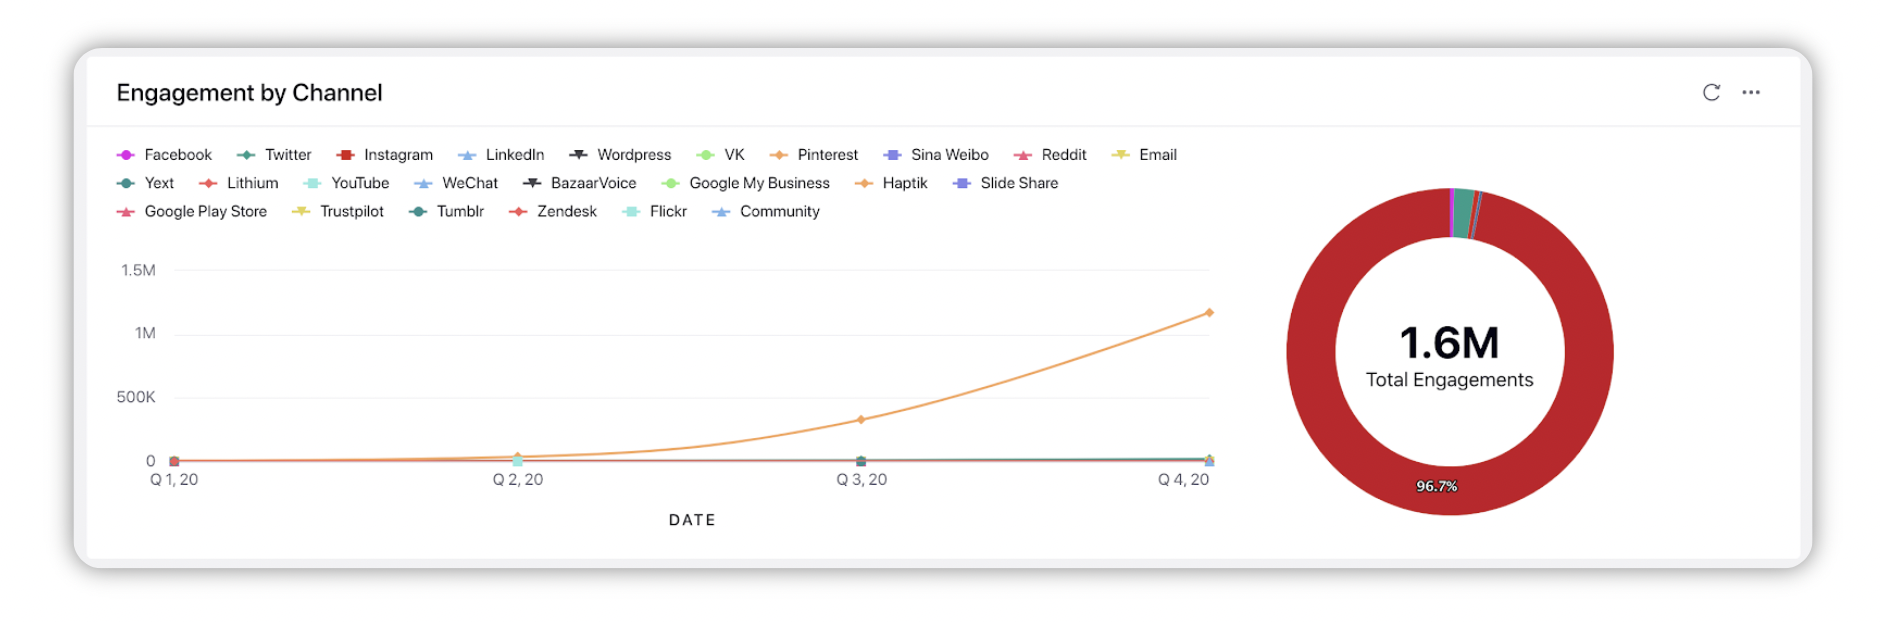
Engagement by Channel
In the Engagement by Channel Insights, you can select channels like Twitter, Facebook, etc. and view the Engagement of a Post in the selected Channel.
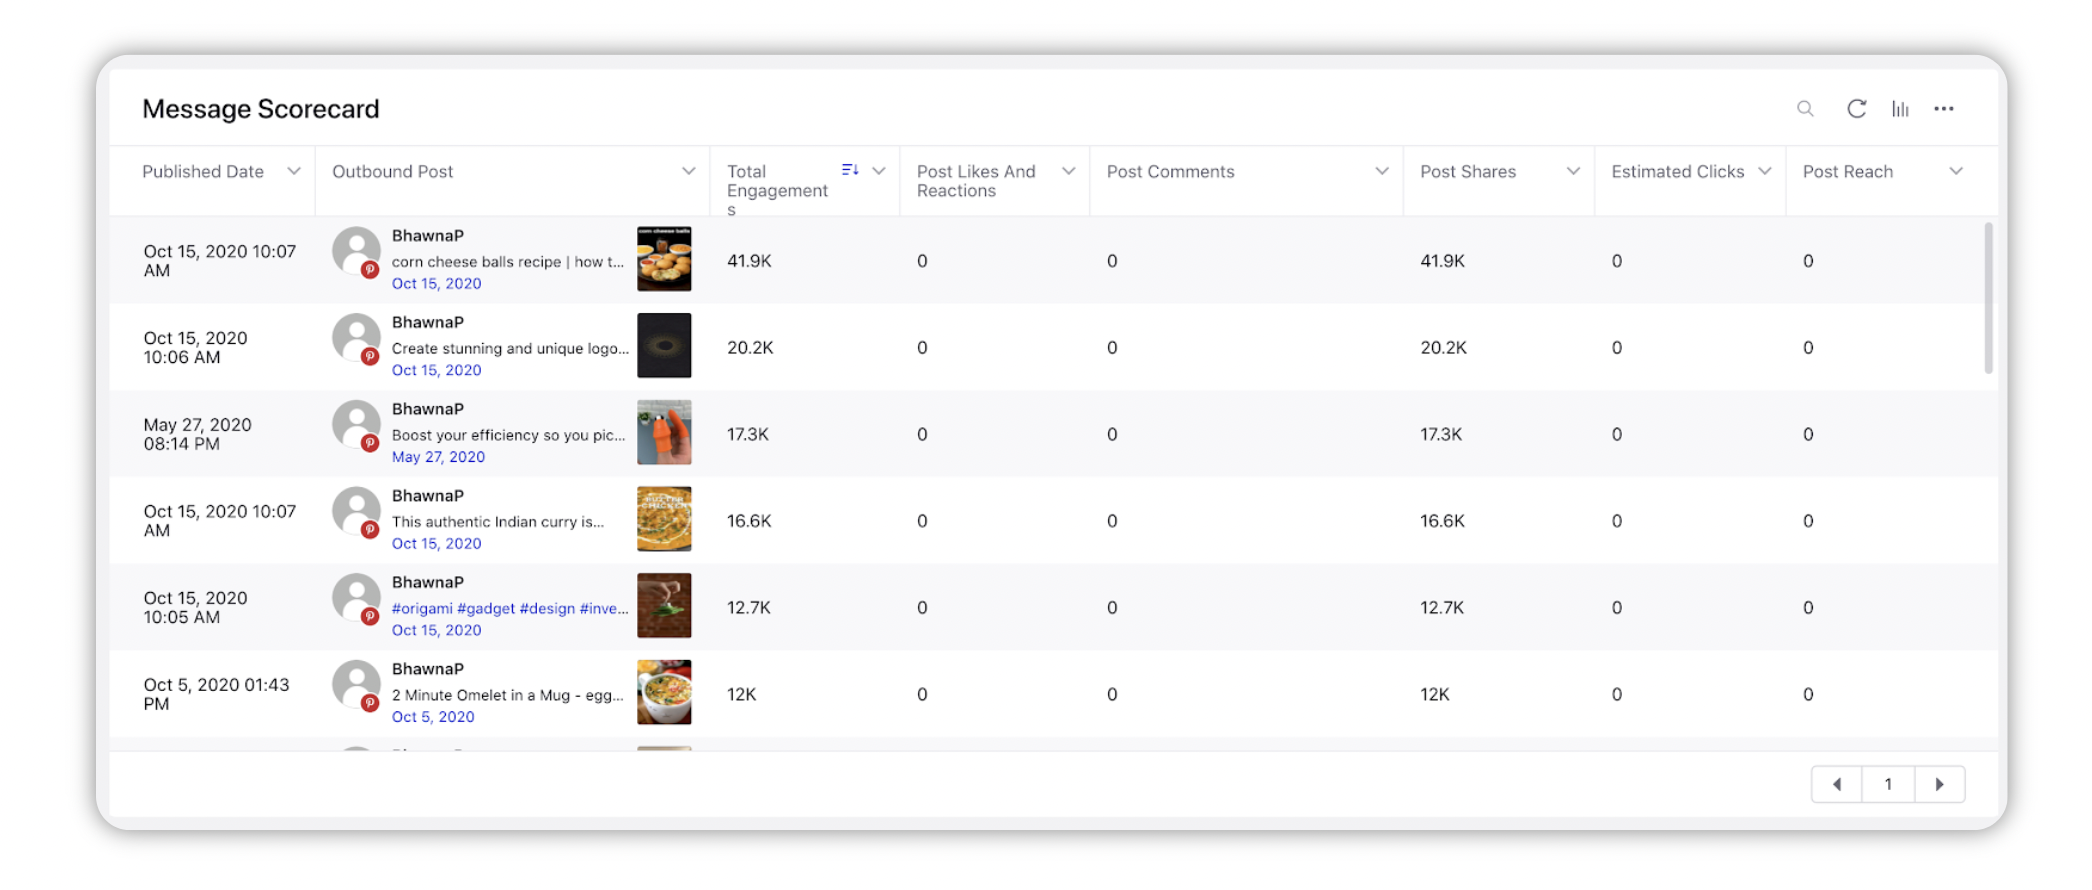
Message Scorecard
In the Message Scorecard Insights, you can visualize posts in Table or Postcard view. This insight displays Published Date, Outbound Post, Total Engagements, Post Likes And Reactions, Post Comments, Post Shares, Estimated Clicks, and Post Reach.
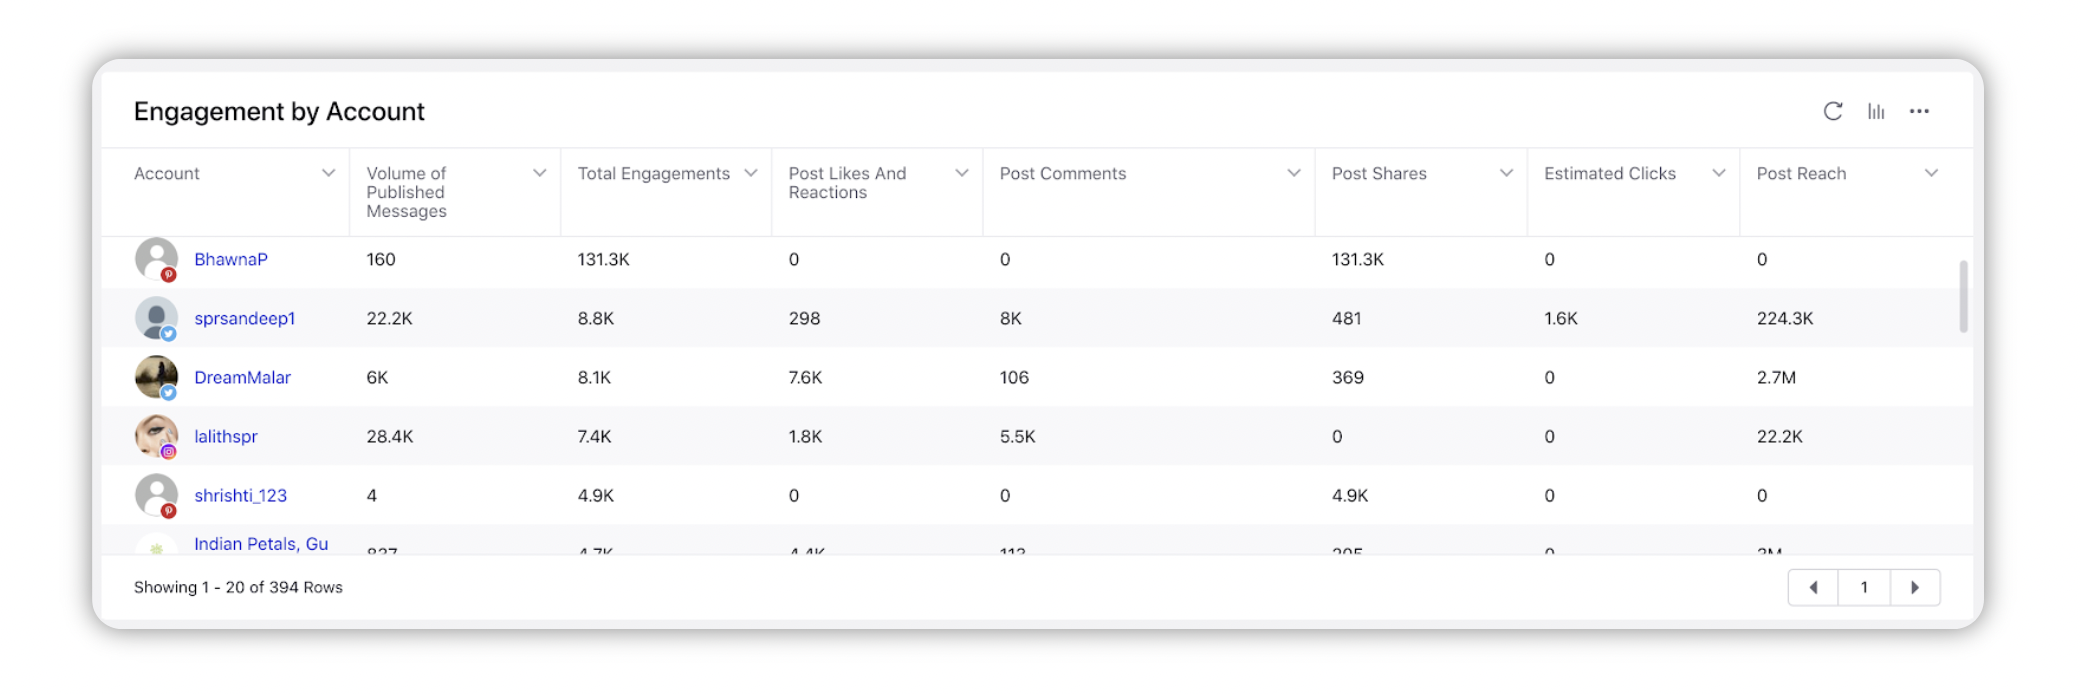
Engagement by Account
In the Engagement by Account Insights, you can visualize posts in Table, Stacked Bar, Stacked Column, Area Chart, Area Spline Chart, Spline Trend Chart, Line Trend Chart and Combinations view. This insight displays engagement by Account, Volume of Published Messages, Total Engagements, Post Likes And Reactions, Post Comments, Post Shares, Estimated Clicks, and Post Reach.