Content Analytics
Updated
The Content Analytics dashboard gives an overview of the Outbound Message posts and their engagements, multiple metrics like channel engagement, followers data, post engagement, etc. are used in the widgets present in this dashboard.
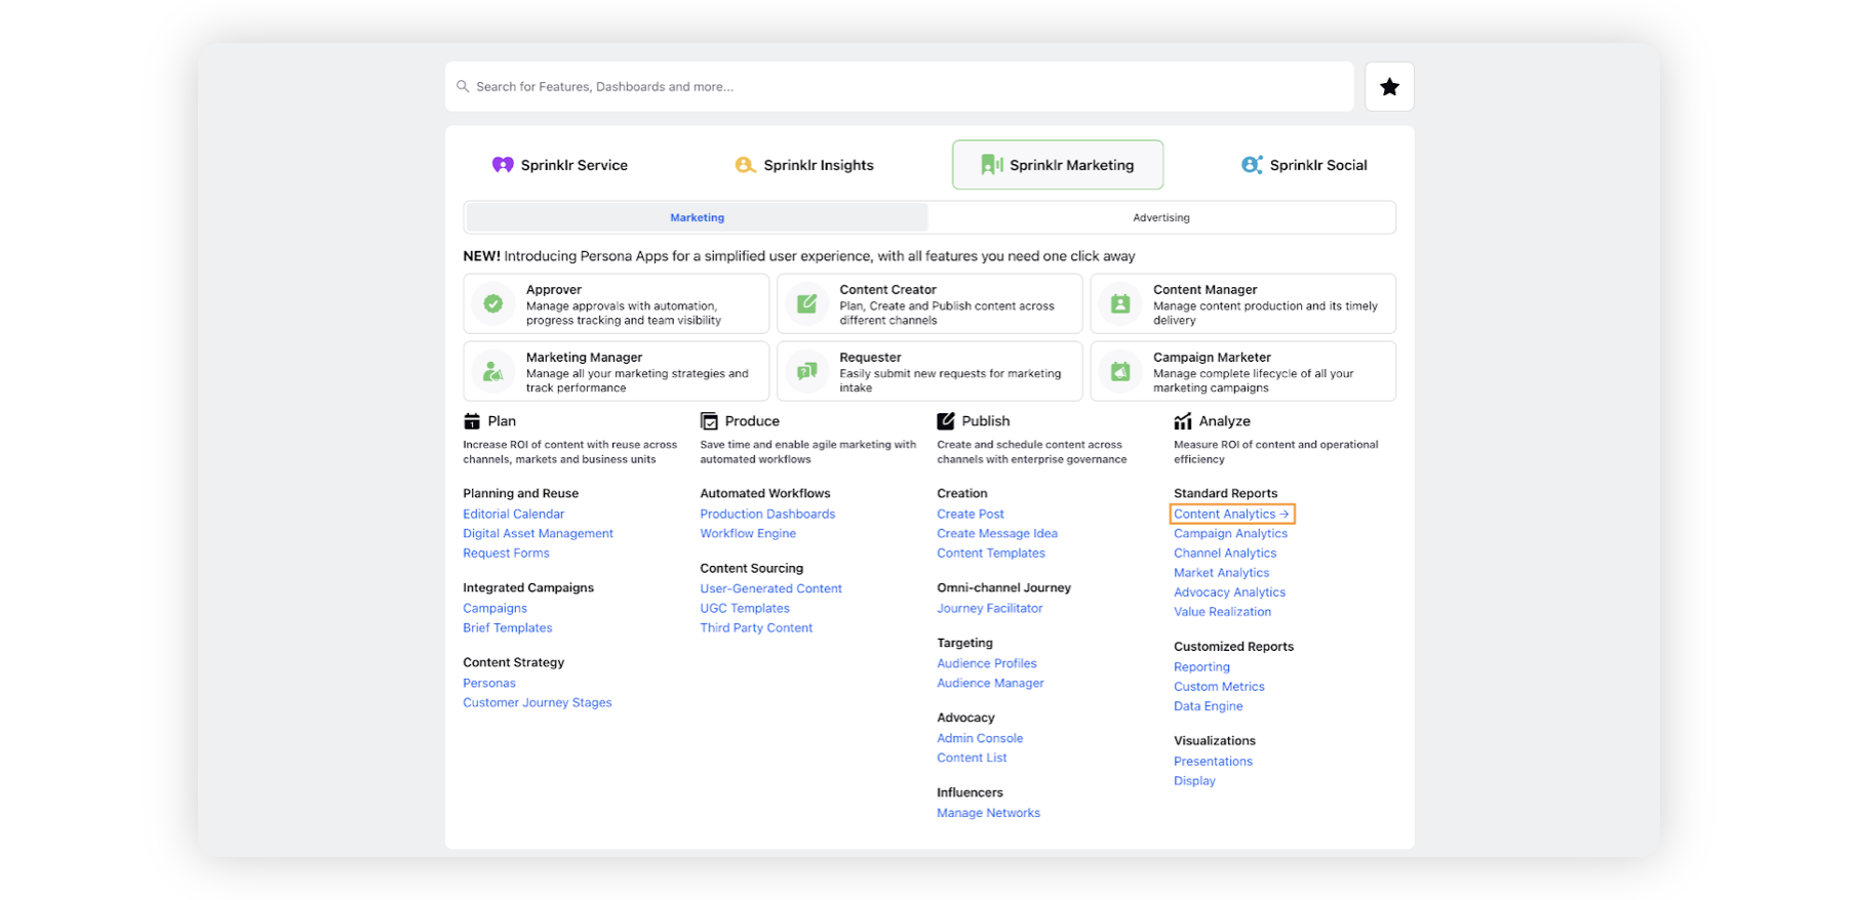
Marketing users can access the Content Analytics dashboard by following the steps mentioned below:
Click the New Tab icon.
Under the Sprinklr Marketing tab, select the Marketing section.
Click Content Analytics within Analyze.
Widgets in Content Analytics dashboard
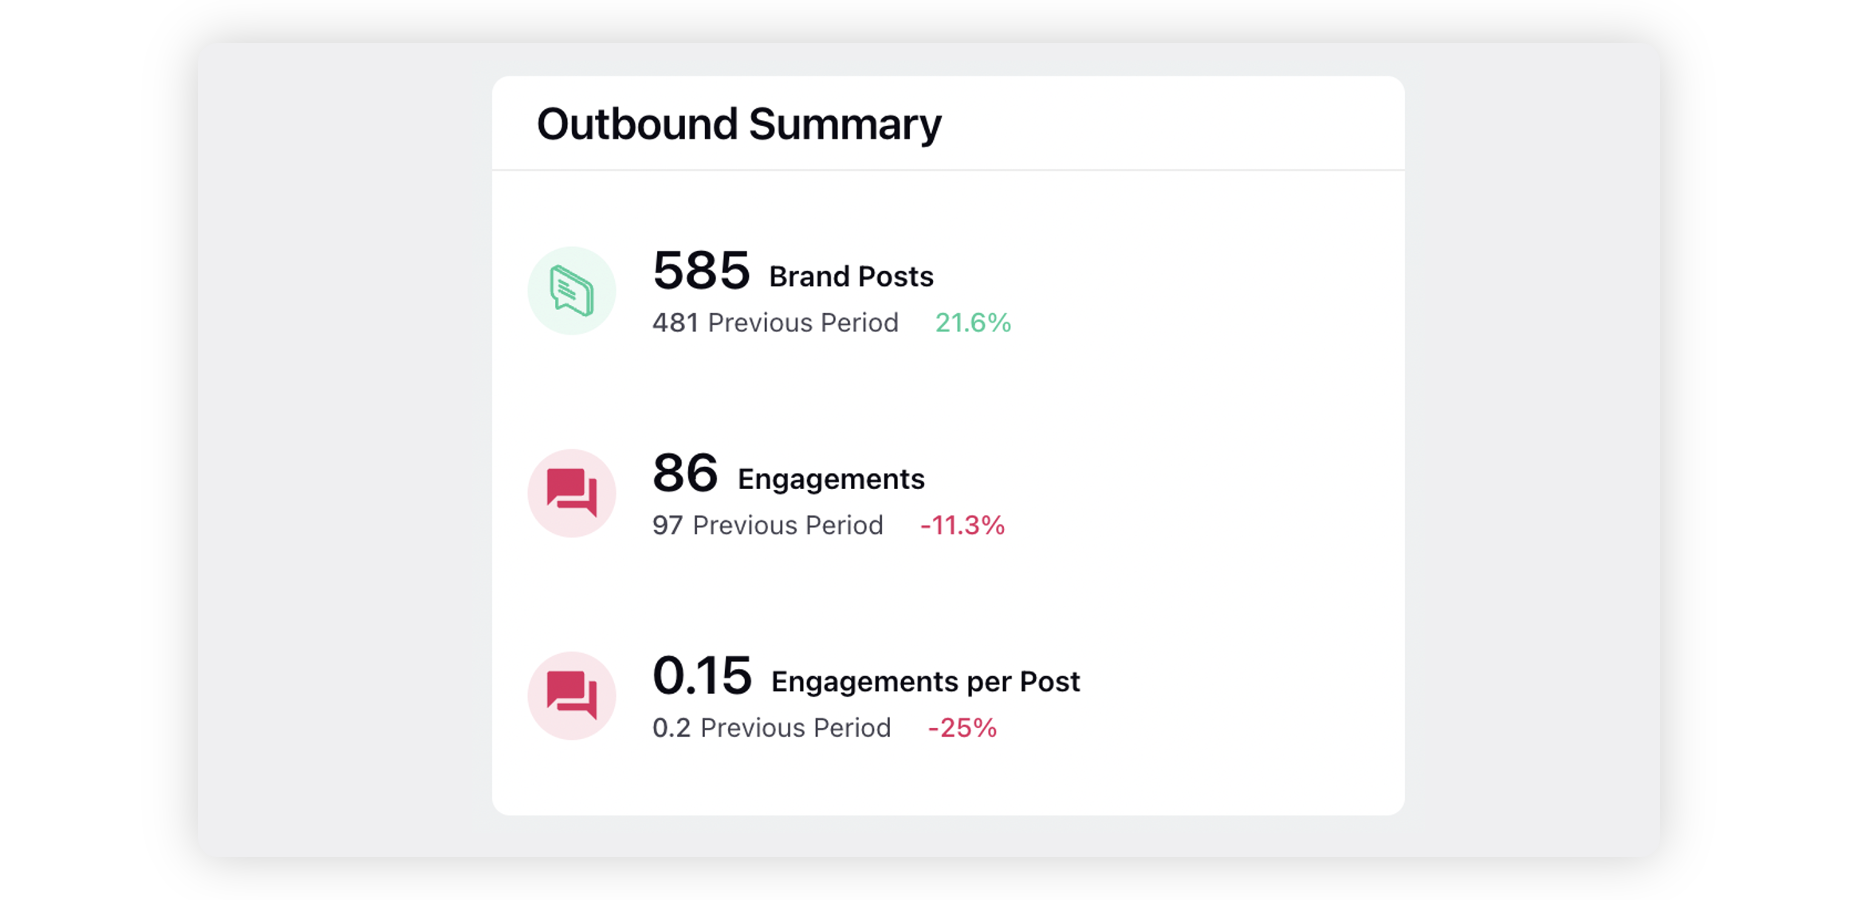
Outbound Summary:
Shows the outbound post level summary for the time duration selected.
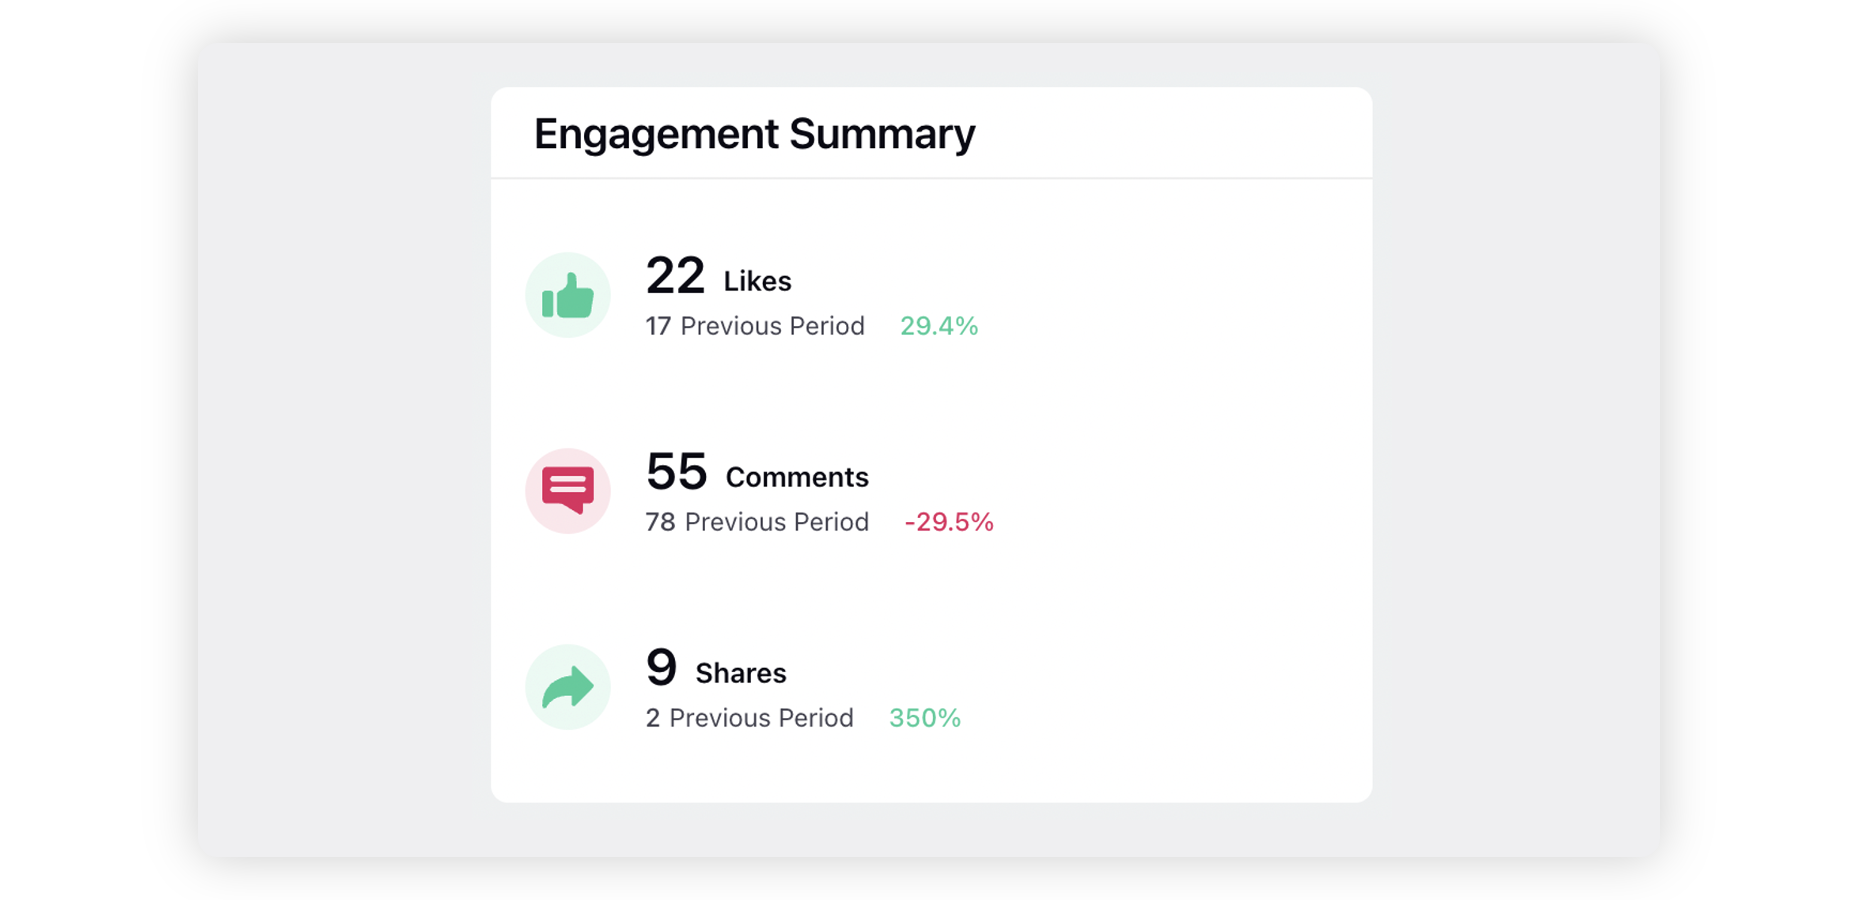
Engagement Summary:
Shows the total engagement summary for all posts for the time duration selected.
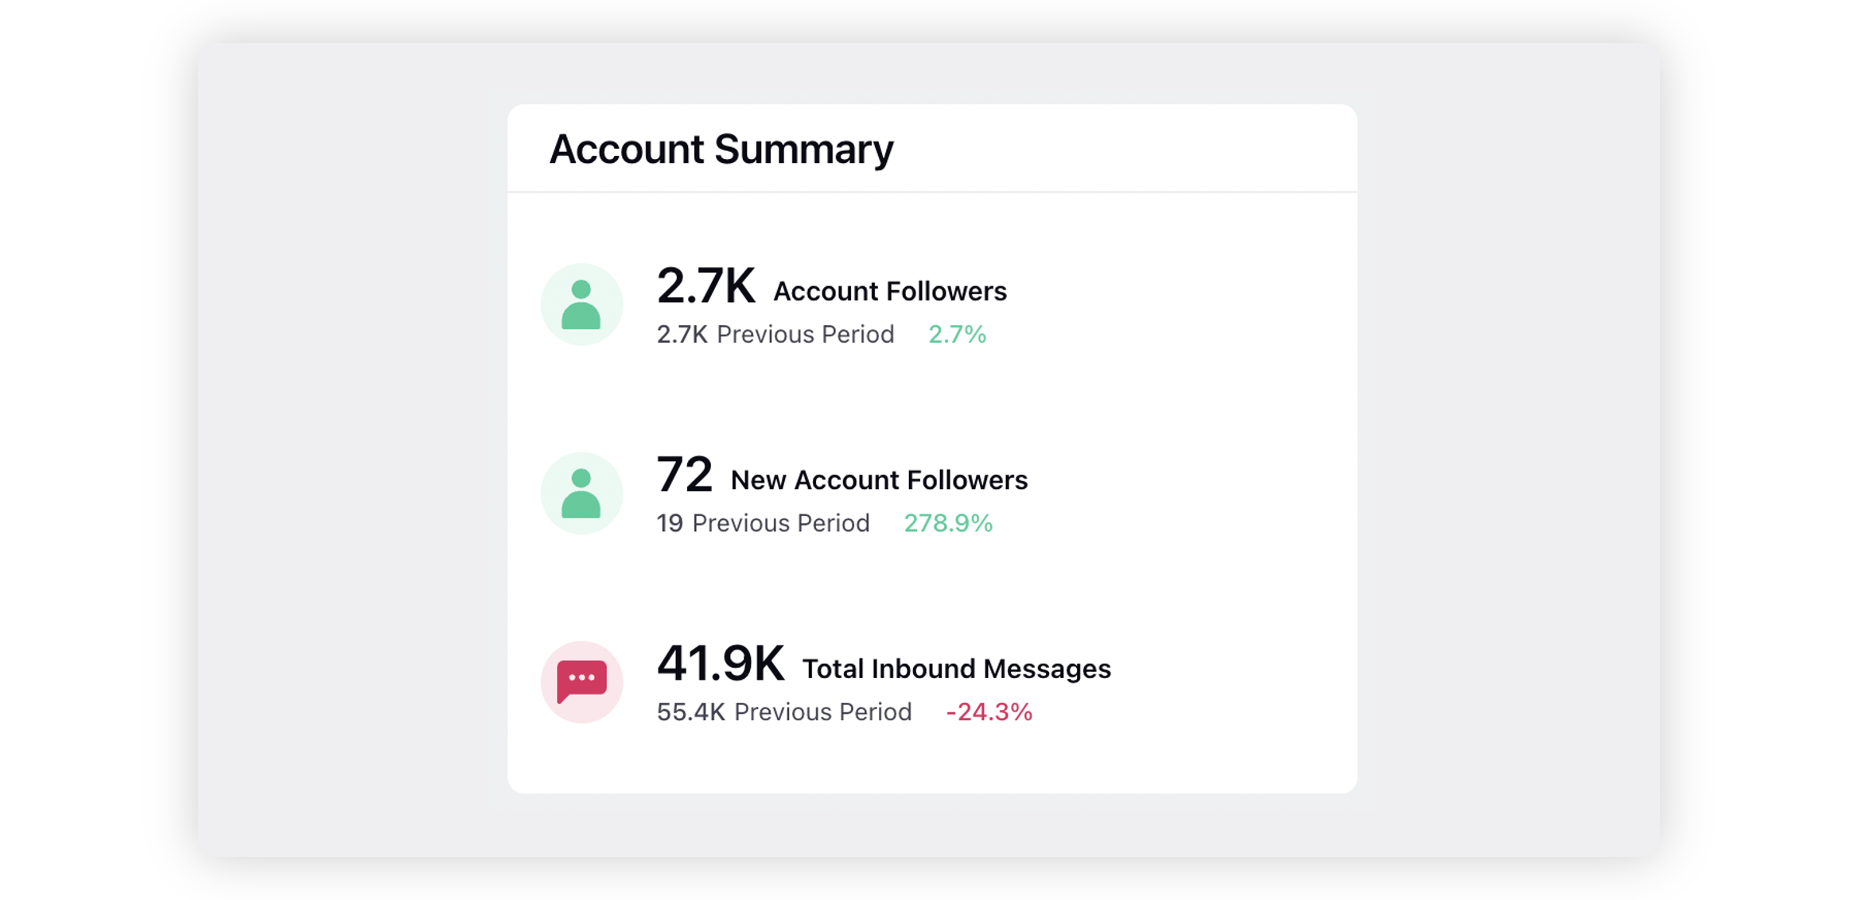
Account Summary:
Shows the Account level summary for the time duration selected.
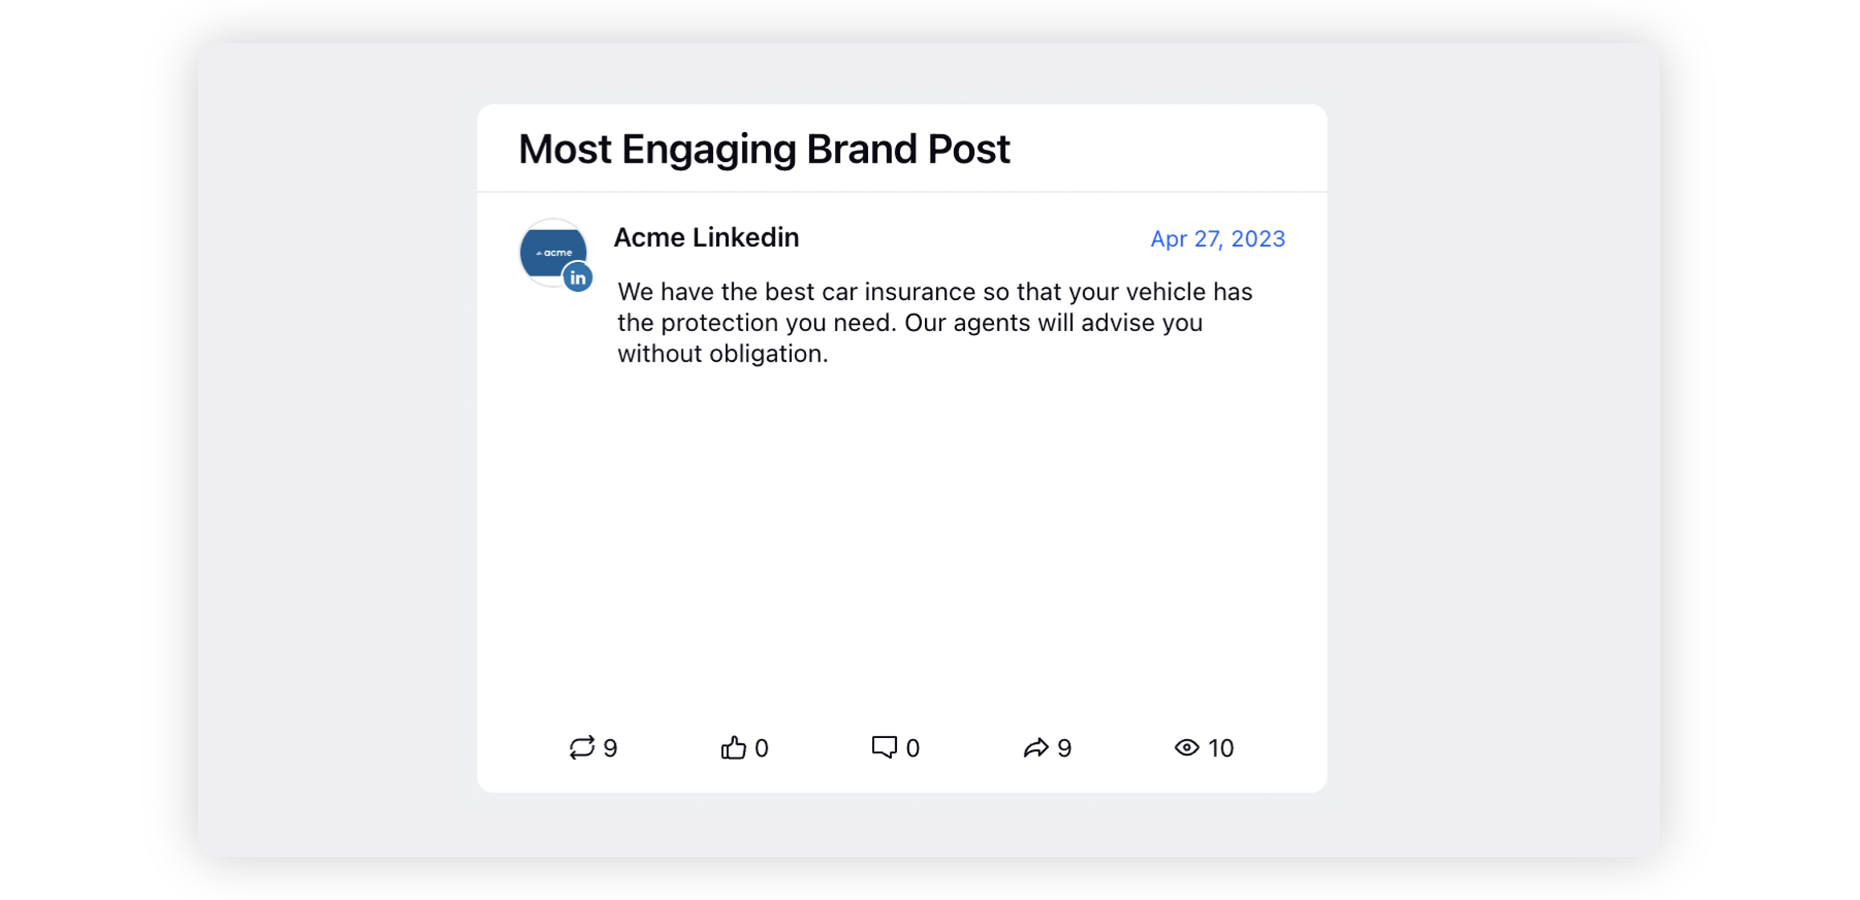
Most Engaging Brand Post:
Shows the brand post with highest total engagement in the time duration selected.
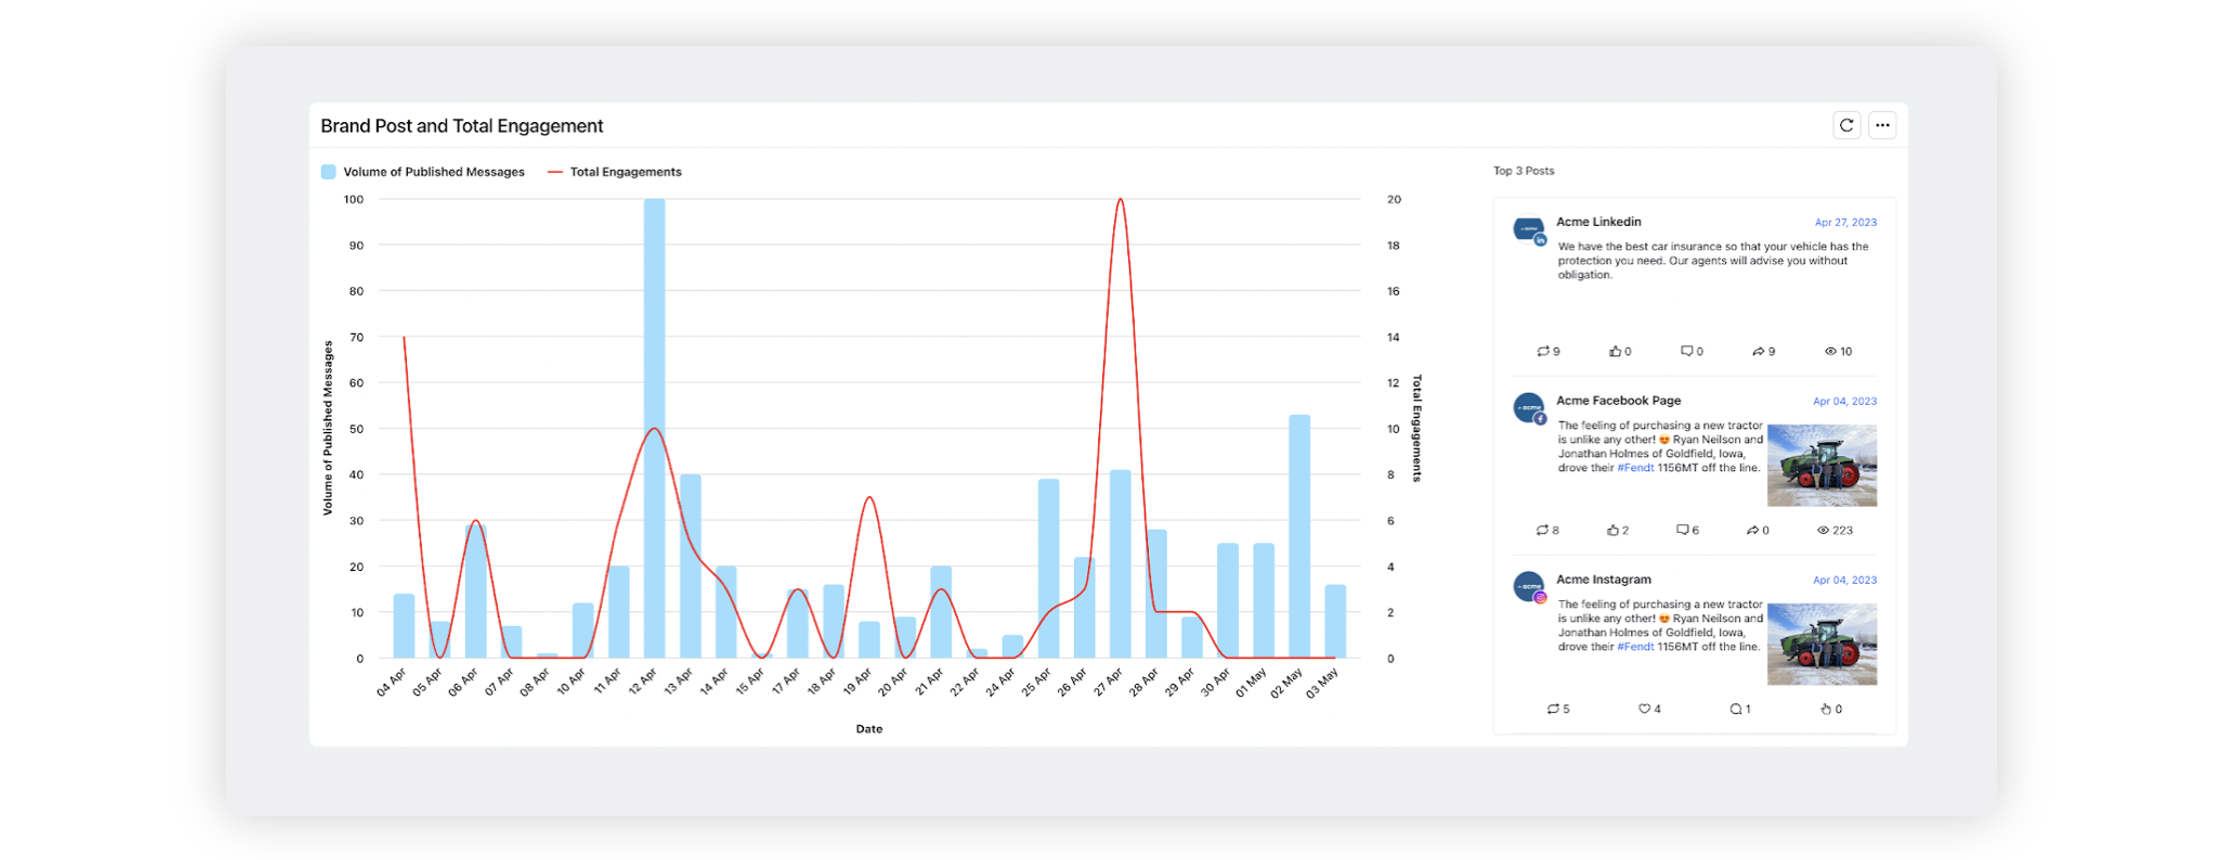
Brand post and total engagement:
Shows graphically the volume of posts published and the total number of engagements received as a trend within the bounds of the selected time duration.
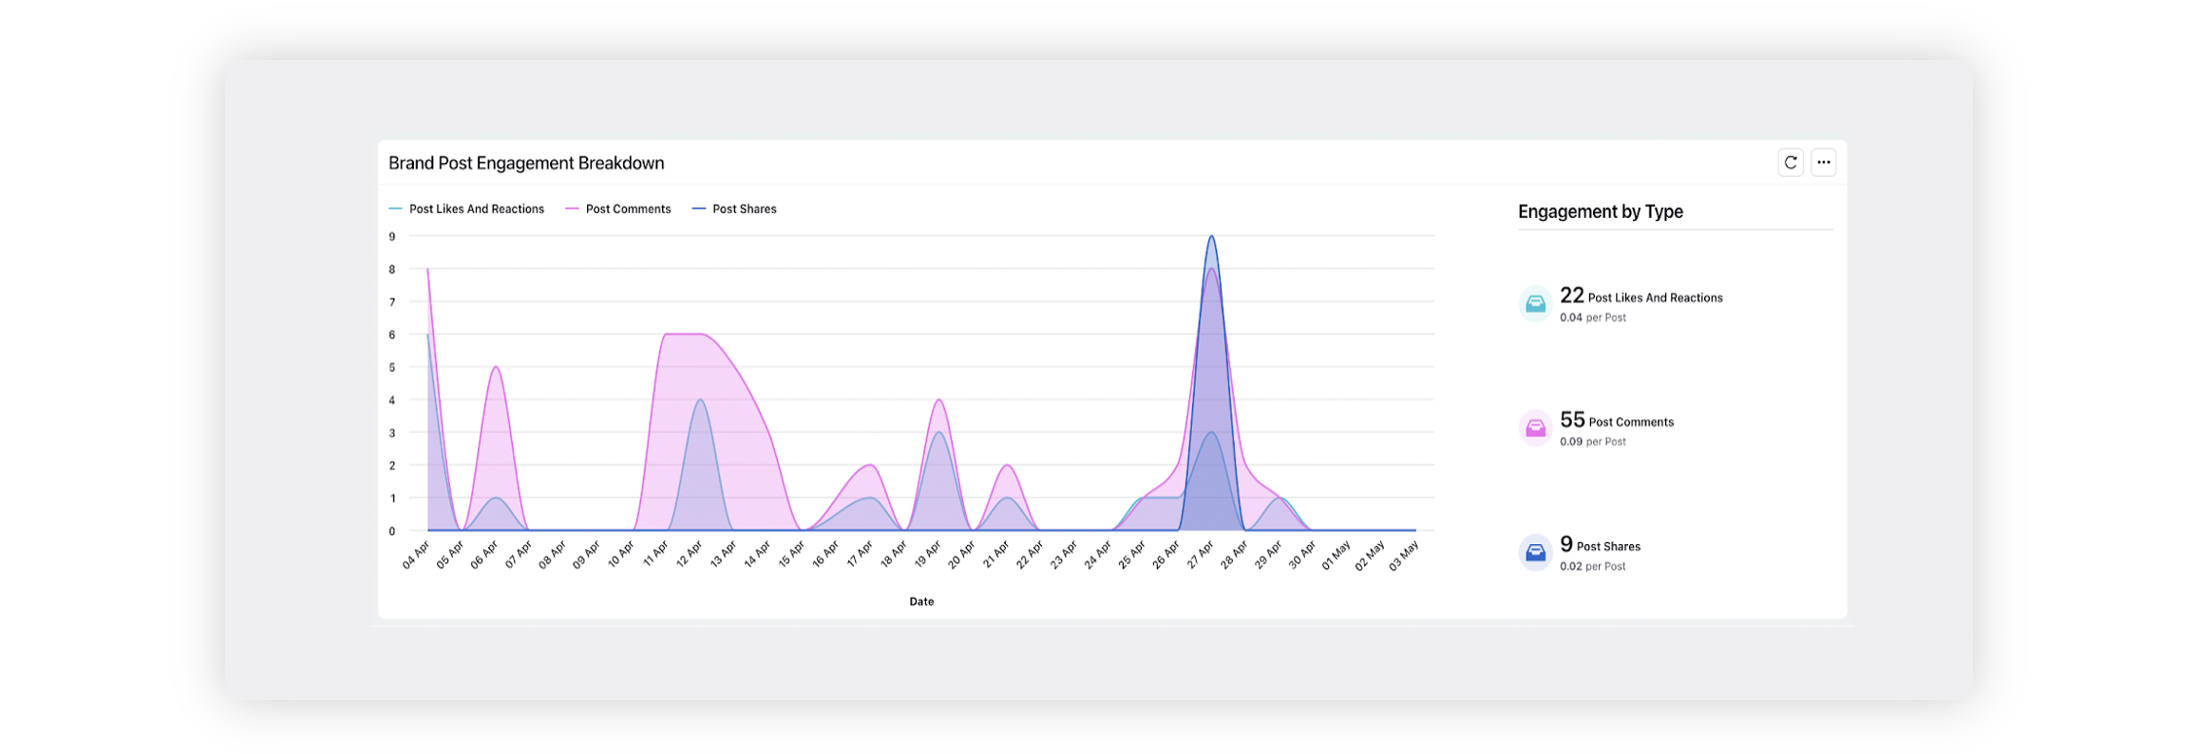
Brand post engagement breakdown:
Shows graphically the volume of different types of engagements received: Likes, Reactions, Comments and Shares as a trend within the bounds of the selected time duration.
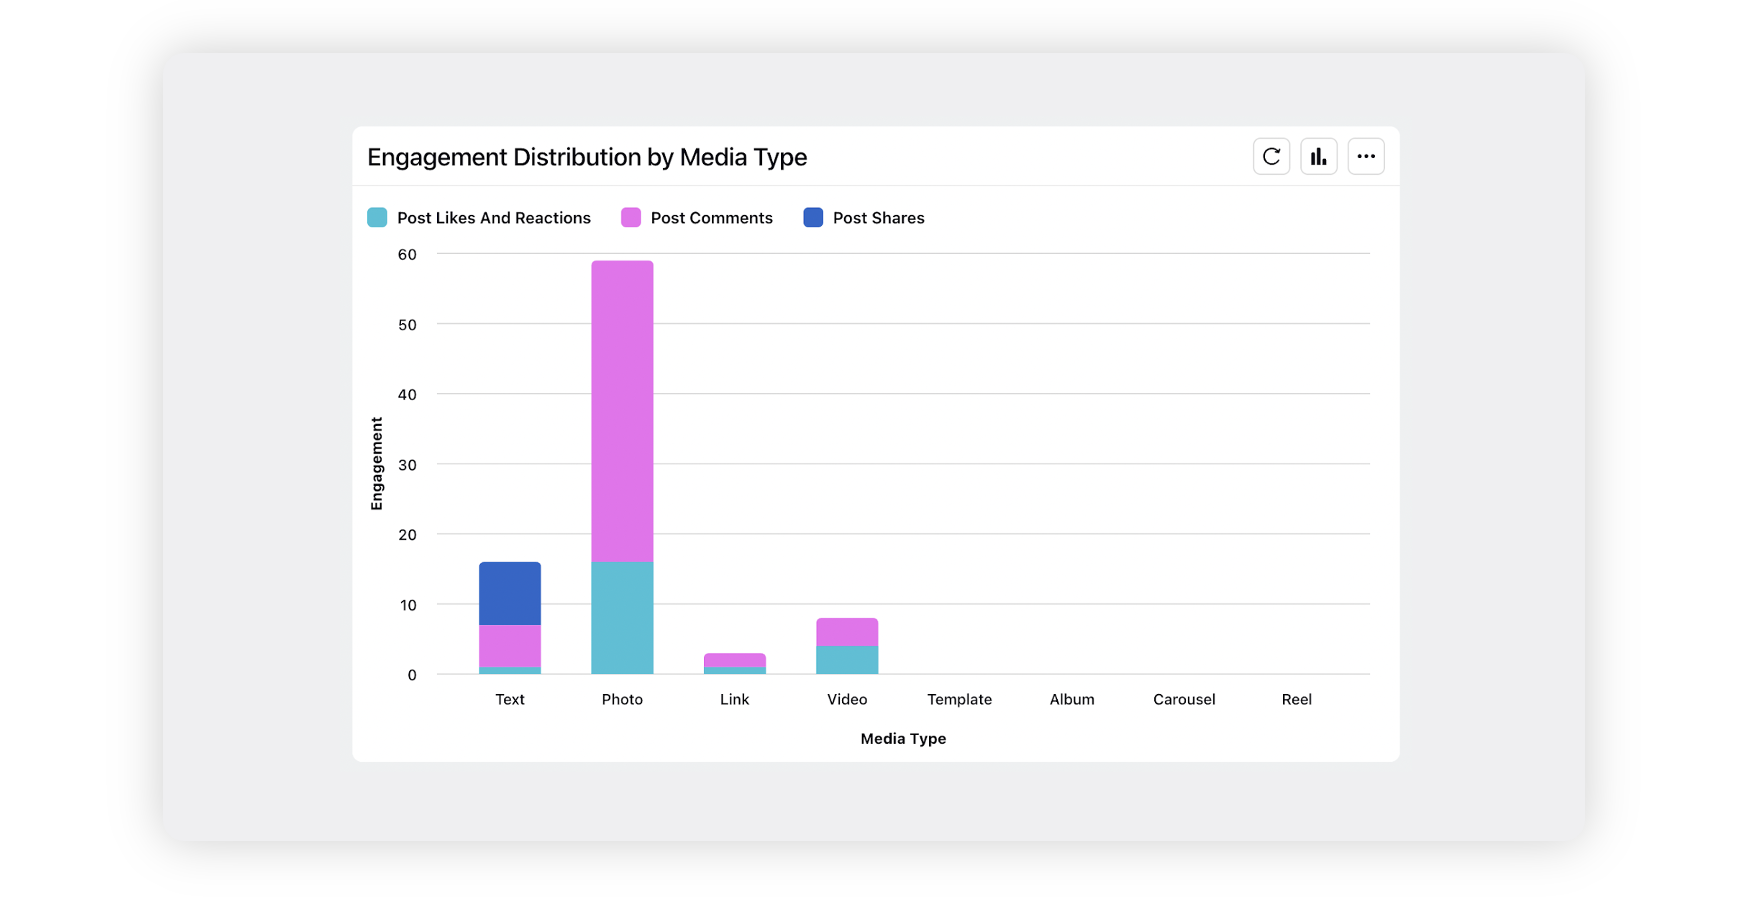
Engagement Distribution by Media Type:
Shows the distribution of different types of engagement received, distributed by the type of media used in the post.
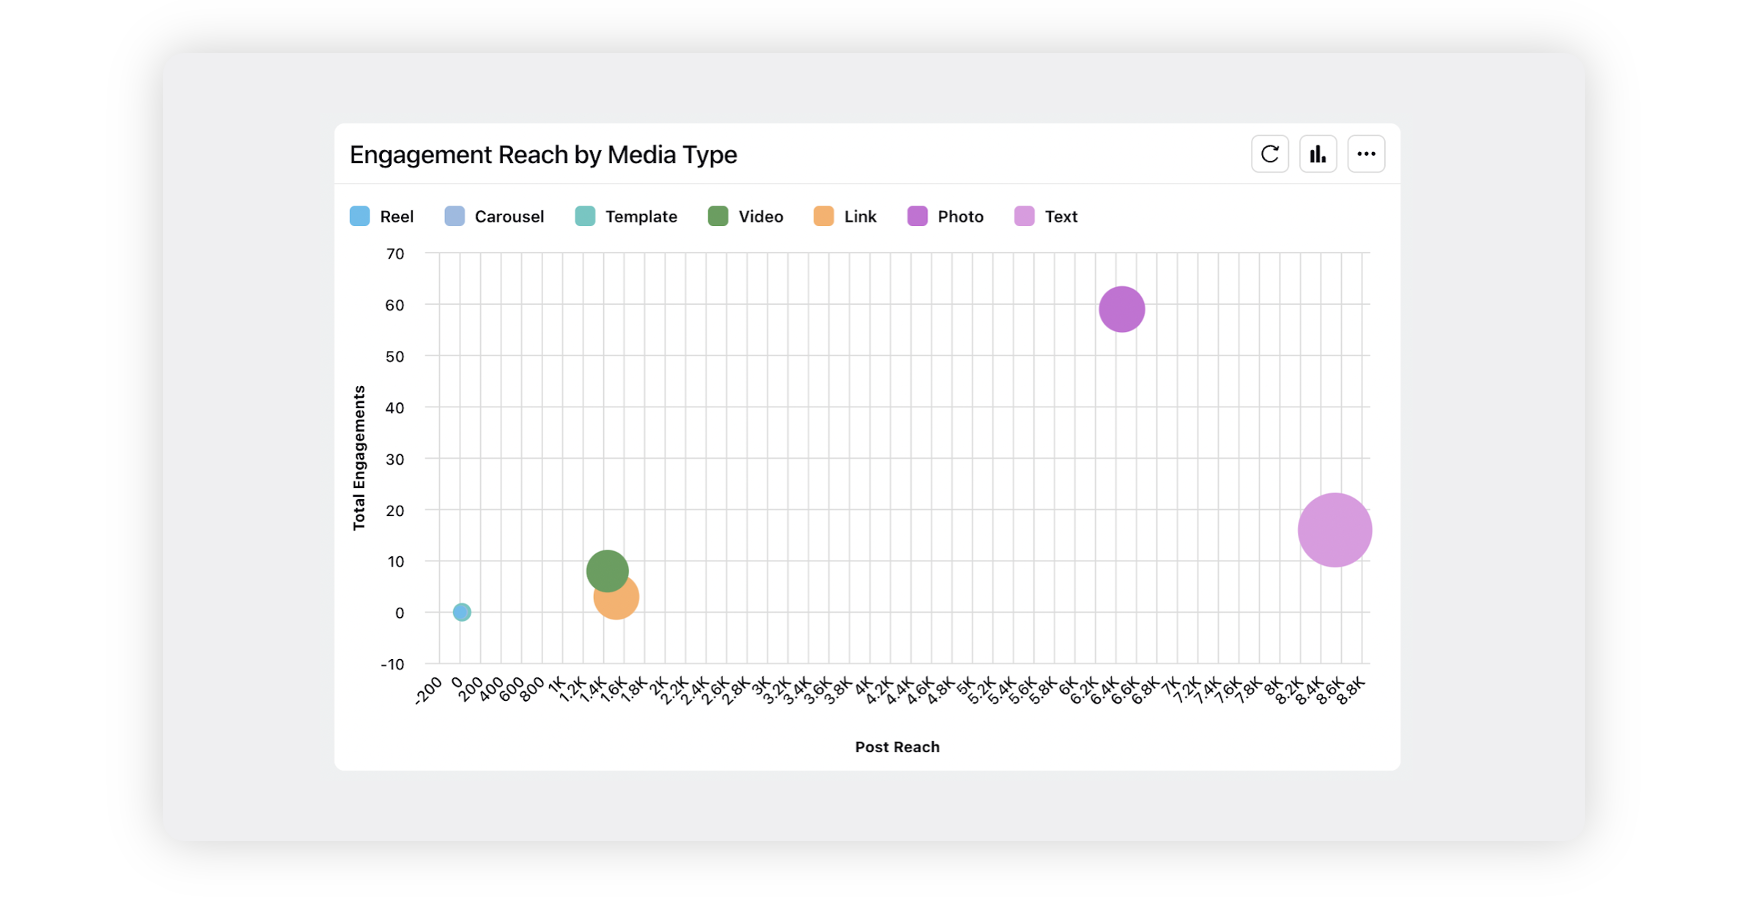
Engagement Reach by Media Type:
Shows the distribution of total engagements received against the reach for a post, distributed by the type of media used in the post.
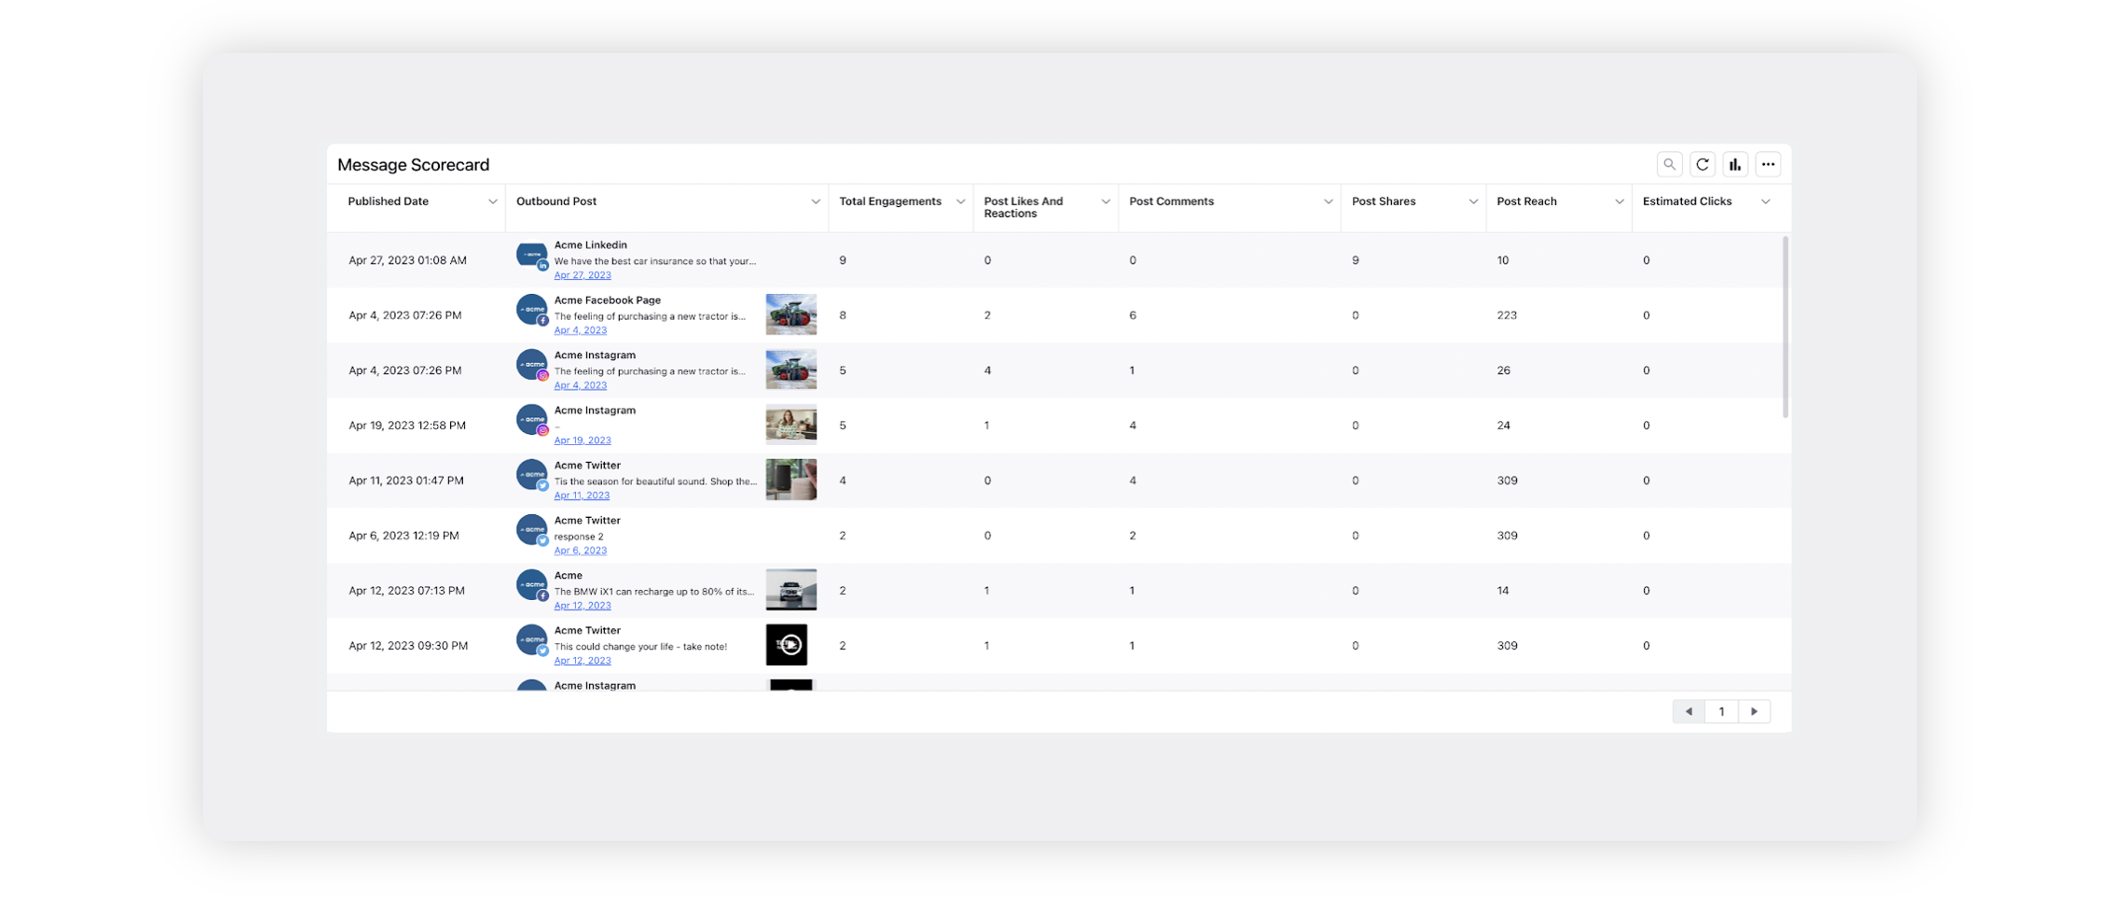
Message Scorecard:
In the Message Scorecard Insights, you can visualize posts in Table or Postcard view. This insight displays Published Date, Outbound Post, Total Engagements, Post Likes And Reactions, Post Comments, Post Shares, Estimated Clicks, and Post Reach.
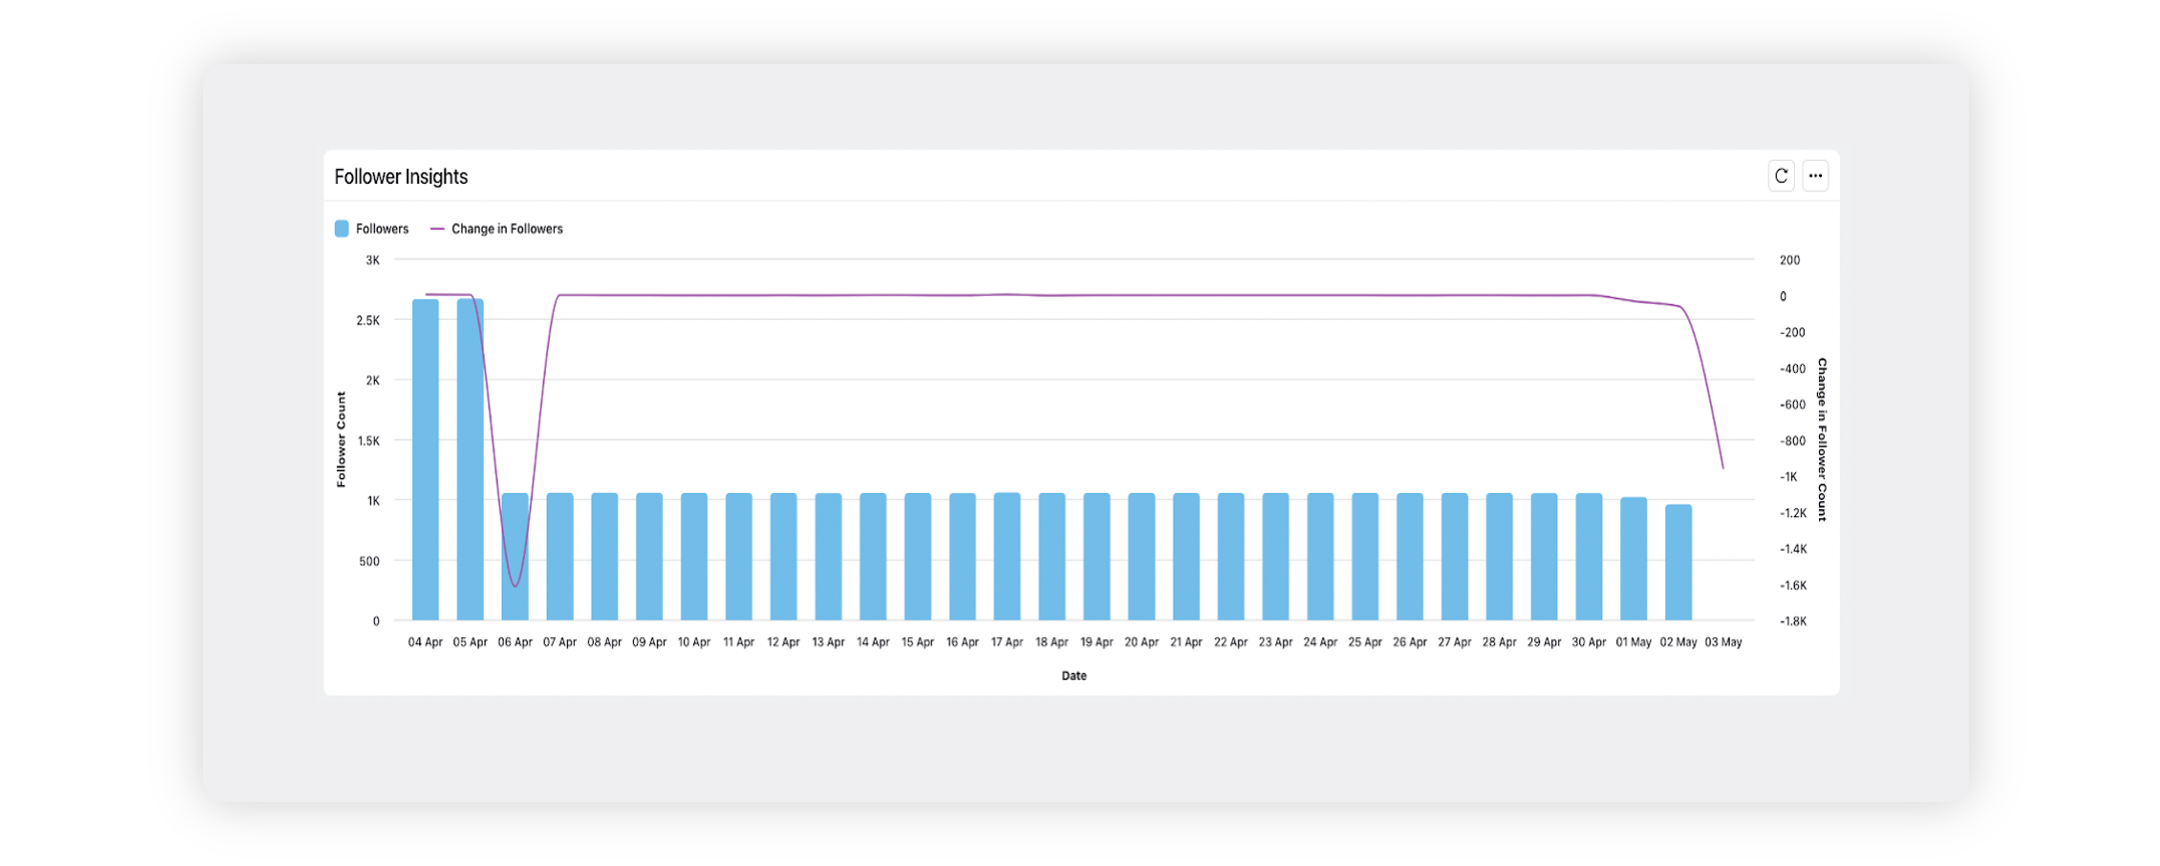
Follower Insight:
Shows the total number of followers and the change in this number for the time duration selected.
Social Engagement Breakdown:
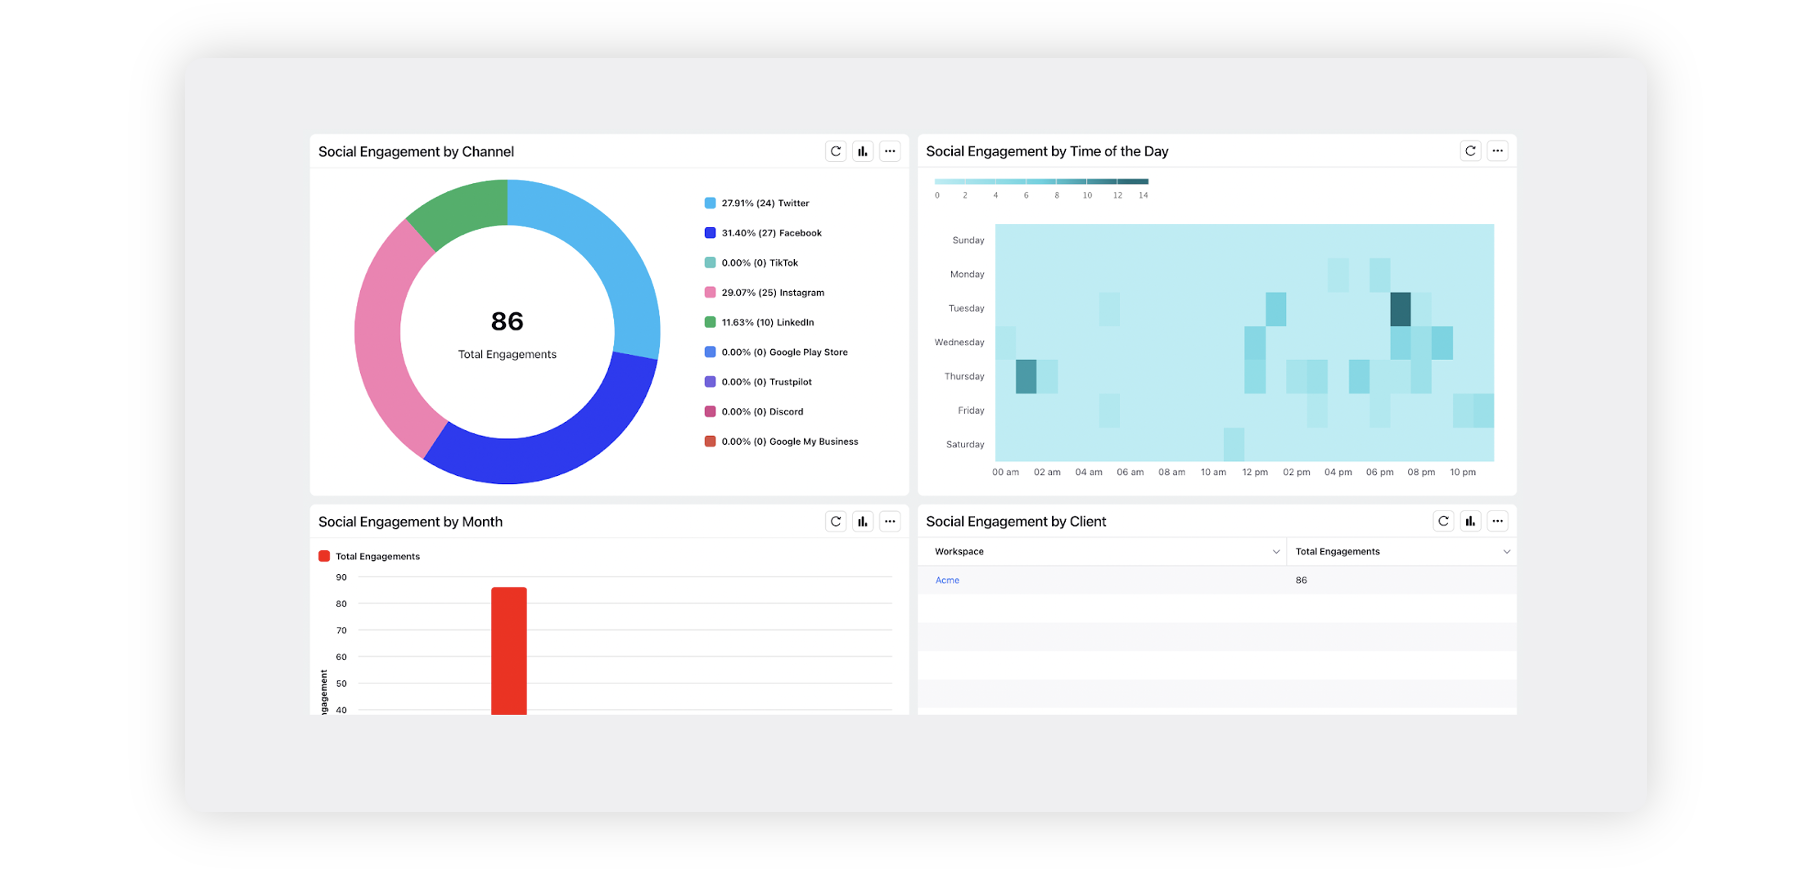
By Channel
Shows a pie chart depicting the total number of engagements received on all posts from different channels.
By time of the day
Displays the peak hours of the day in which the total number of engagements is highest.
By month
Displays a graph showing the number of engagements for different months for easily comparing engagements amongst them.
By Client
Shows a table with the total number of engagements for every workspace in the Environment.