Market Analytics
Updated
Market Analytics dashboard focuses on metrics such as Types of engagement by time and day, Types of engagement by channels, fan keywords, and Brand activity keywords. These metrics can be used to perform market analysis for various brands.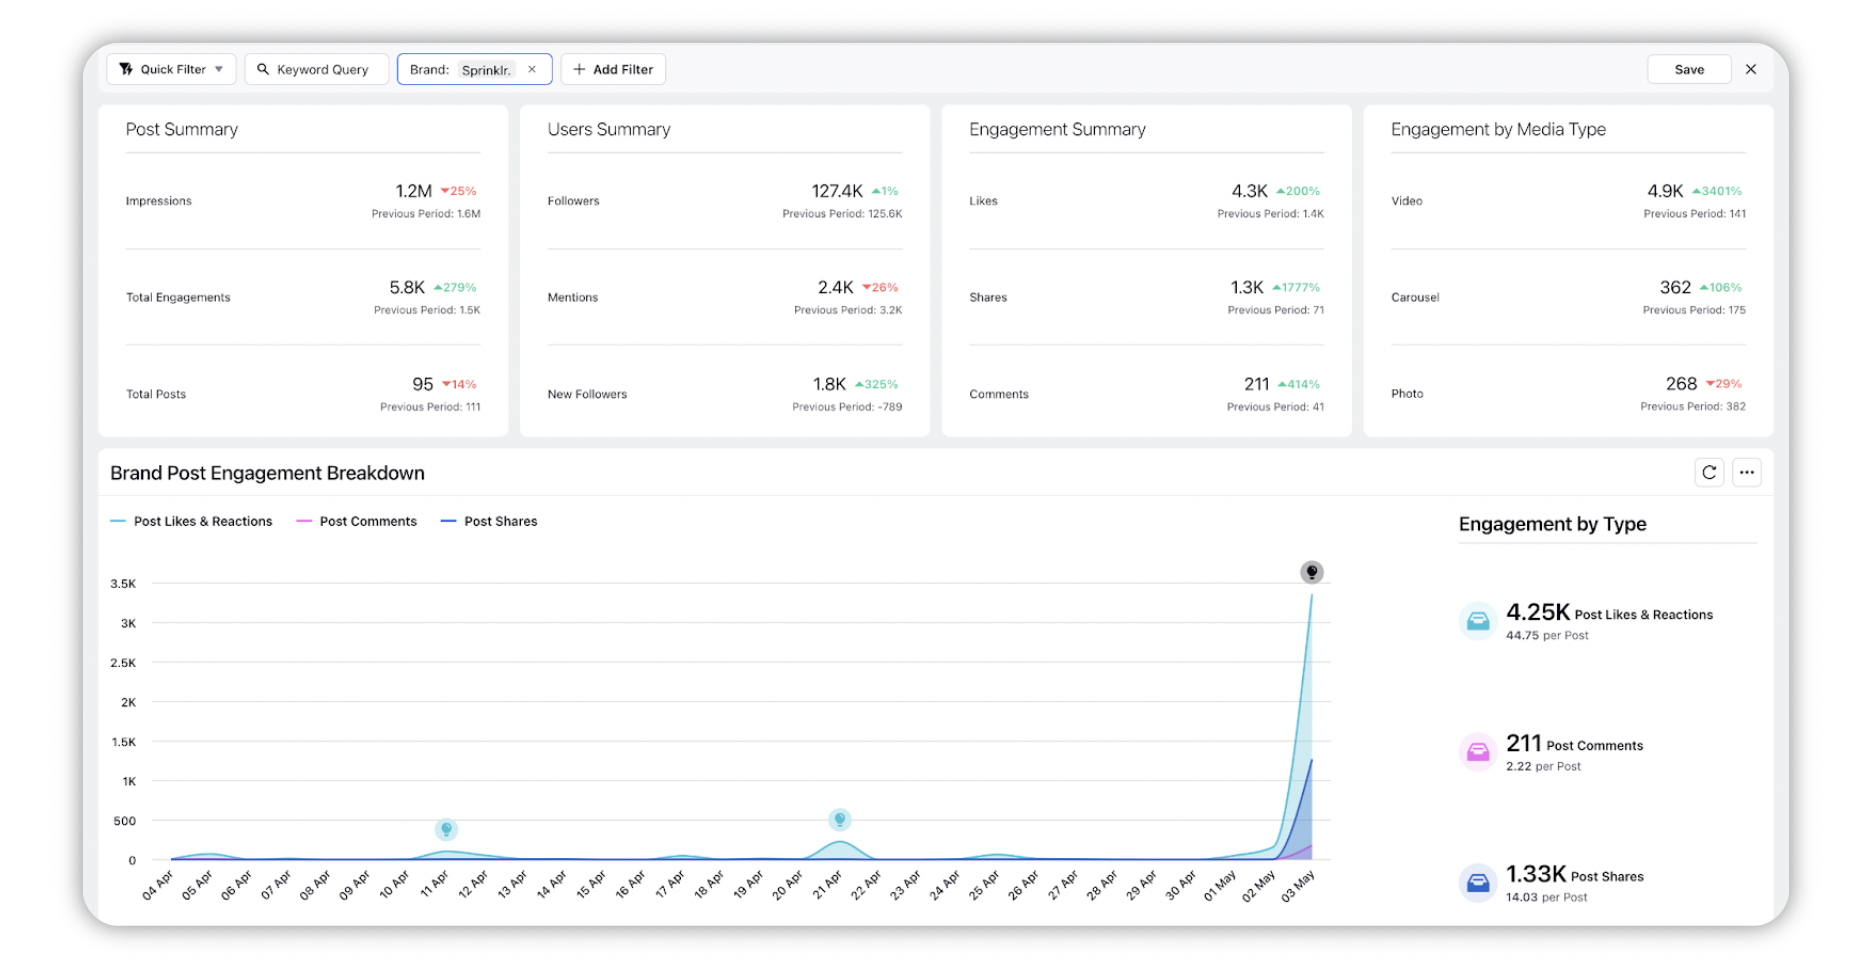
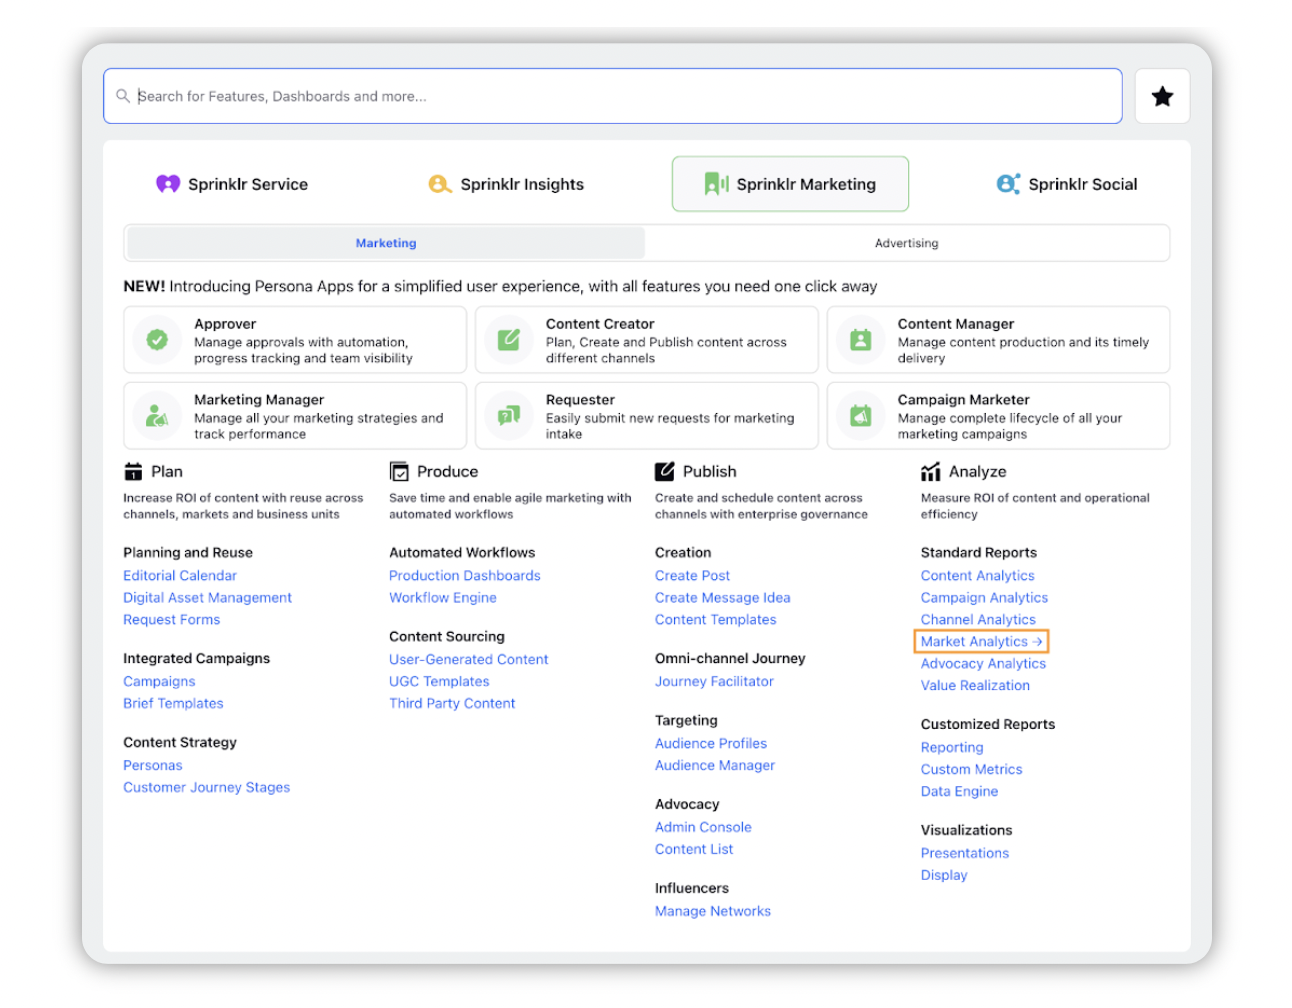
You can access this dashboard by:
Clicking the New Tab icon.
Under Sprinklr Marketing, switch to the Marketing section.
Then click Market Analytics within Analyze.
The standard widgets presented in this Dashboard are:
Post Summary—This widget displays the total number of impressions received, engagements received, and brand posts published by accounts under the dashboard brands during the time range (default: 30 days), as well as a percentage change in these metrics as compared to the previous time period.
Users Summary—This widget displays the total number of followers, new followers gained, and mentions received by accounts under the dashboard brands during the time range, as well as a percentage change in these metrics as compared to the previous time period.
Engagement Summary—This widget displays the total number of Likes, Shares, and Comments that content published by accounts under the dashboard brands during the time range, as well as a percentage change in these metrics as compared to the previous time period.
Engagement by Media Type—This widget displays the total number of engagements that each media type (photo, text, video) has received during the time range, as well as a percentage change in these metrics as compared to the previous time period.
Brand Post Engagement Breakdown—This widget displays a filled trend line graph of the number of engagements each dashboard brand's accounts received during the time range, as well as a numerical display of the total number of said engagements, broken down by Likes/Shares/Comments.
Engagement Distribution by Content Type—This widget displays a bar graph of your brand and brand competitors' accounts' content, broken down by media type and then how often that content was liked/shared/commented.
Share of Posts by Content Type—This widget displays a pie chart of the dashboard brands' posts, broken down by media type (text/photo/video), and shown as a percentage of total posts made.
Engagement Distribution by Channel—This widget displays a bar graph of the dashboard brands' content, broken down by social channel and then the amount of Likes/Shares/Comments the accounts on those channels received.
Share of Posts by Channel—This widget displays a pie chart of the dashboard brands' volume of posts per social channel shown as a percentage of total posts made.
Engagement by Day and Time—This widget displays a filled trend line graph of the number of engagements the aggregate of dashboard brands' accounts received during the time range, broken down by day of the week (line) total number of engagements (y-axis) and by hour interval (x-axis).
Mentions by Day and Time—This widget displays a filled trend line graph of the number of engagements the aggregate of dashboard brands' accounts received during the time range, broken down by day of the week (line) total number of engagements (y-axis) and by hour interval (x-axis).
Fan Activity Words—This widget displays an animated wheel of the words and phrases used most frequently by fans of the dashboard brands.
Brand Activity Keywords—This widget displays an animated wheel of the words and phrases used most frequently by the accounts under the dashboard brands.
Top Posts—This widget consists of a table of all posts made by the dashboard brands' accounts, sortable by number of Likes, Comments, and Shares, as well as by the total engagement and estimated reach of each of those posts.