Voice Debug Console
Updated
Voice Debug Console offers comprehensive insights into every aspect of incoming voice calls on Sprinklr. It provides detailed analysis, ranging from call quality assessments to identifying reasons for disconnections. Voice Debug Console simplifies the debugging process for voice calls from an administrator's perspective, streamlining troubleshooting, and ensuring optimal call performance on UI.
How to Use Debug Console?
Once you login to Sprinklr home page, Voice Debug Console will be present in the Persona Apps.
On clicking the Voice Debug Console, the user sees four tabs on the left side of the screen:
1. Reporting Tab
2. Conversation Analysis
3. User Session Analysis
4. Partner Level Configurations
1. Reporting Tab
The Reporting Tab in Sprinklr’s Debug Console allows users to track, analyze, and troubleshoot call performance in detail. This standard reporting dashboard helps administrators monitor specific call metrics like missed offers, rejected offers, and overall rejected calls, offering a comprehensive view for identifying and resolving issues efficiently.
2. Conversation Analysis
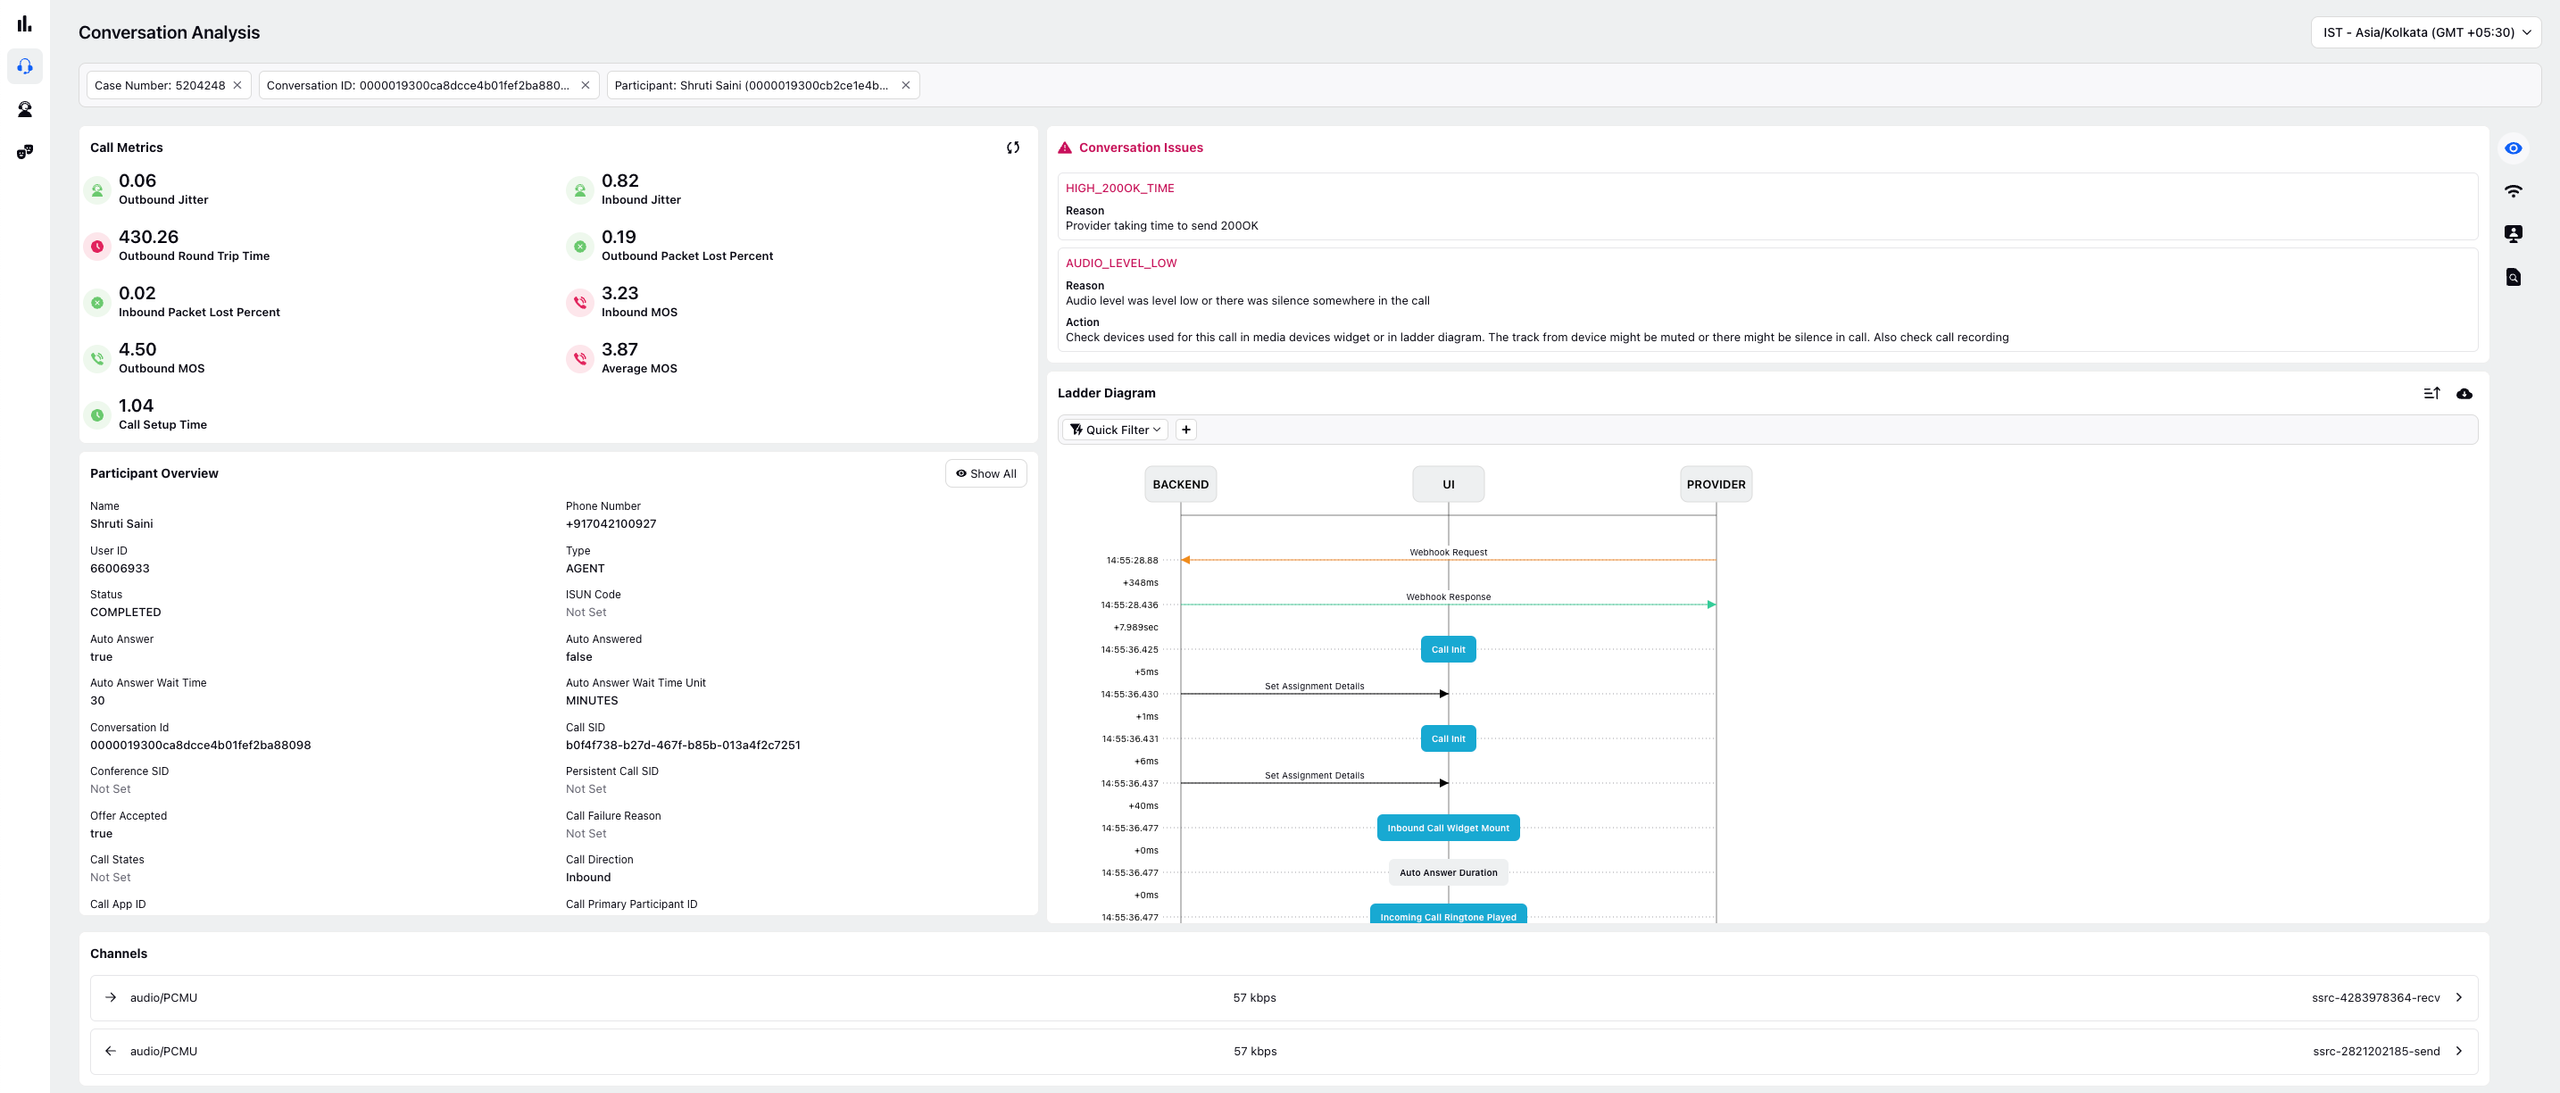
The Conversation Analysis Console is designed to provide an in-depth view of call quality and participant information in real-time. This console is segmented into four main tabs: Overview, WebRTC, Device Info, and Logs. Each tab focuses on specific aspects of call data, helping administrators diagnose and resolve conversation issues effectively.
Enablement
To enable the Conversation Analysis Console:
Access the Reporting Dashboard to retrieve the conversation ID of the specific call.
Implementation Steps
In the console, enter the conversation ID to pull up details for that call.
Agent/Customer

IVR Logs
This section displays the log of interactions that occurred during the IVR phase of the call.
View how the call navigated through the IVR menu.
Check DTMF inputs entered by the caller.
Verify call routing logic and transitions between IVR steps.
Identify IVR flow issues or drop-offs before the call reaches an agent.
For each IVR workflow initiated during a conversation, you can view the main workflow variables in the Workflow Variables tab.
You can also apply filters to IVR logs using the IVR flow name.
Access real-time values of IVR variables directly within debug logs.


ACW Logs
This section captures activities performed by the agent after the call ends.
Includes actions like entering call notes, dispositions, and wrap-up activities.
Helps in understanding how long agents take to complete post-call work.
Useful for evaluating agent performance and improving operational efficiency.
Guided Workflow Logs
This section logs the workflows triggered during the call.
Displays details of widgets shown to the agent.
Shows step-by-step actions taken within the guided workflow.
Helps identify workflow issues such as incorrect triggers, missing steps, or execution delays.
On the right side, there'll be 4 tabs - Overview, Web RTC, Device Info, Logs. Navigate tabs for in-depth analysis:
Overview Tab: Review high-level call metrics and issues.
WebRTC Tab: Analyze connection and WebRTC trace statistics.
Device Info Tab: Check device and system information for the participant.
Logs Tab: Access conversation logs to identify specific call events and troubleshooting data.
Tabs Overview
Overview Tab:
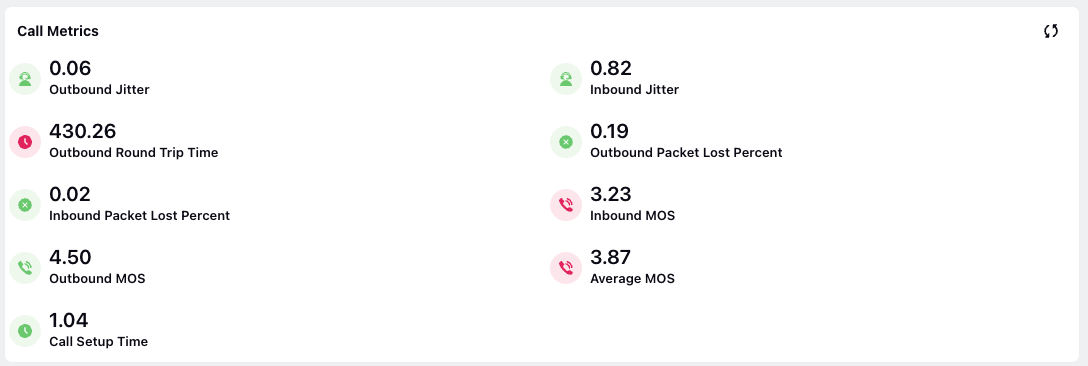
Call Metrics: Shows average call quality metrics for each participant.

Conversation Issues: Lists any identified issues during the call.
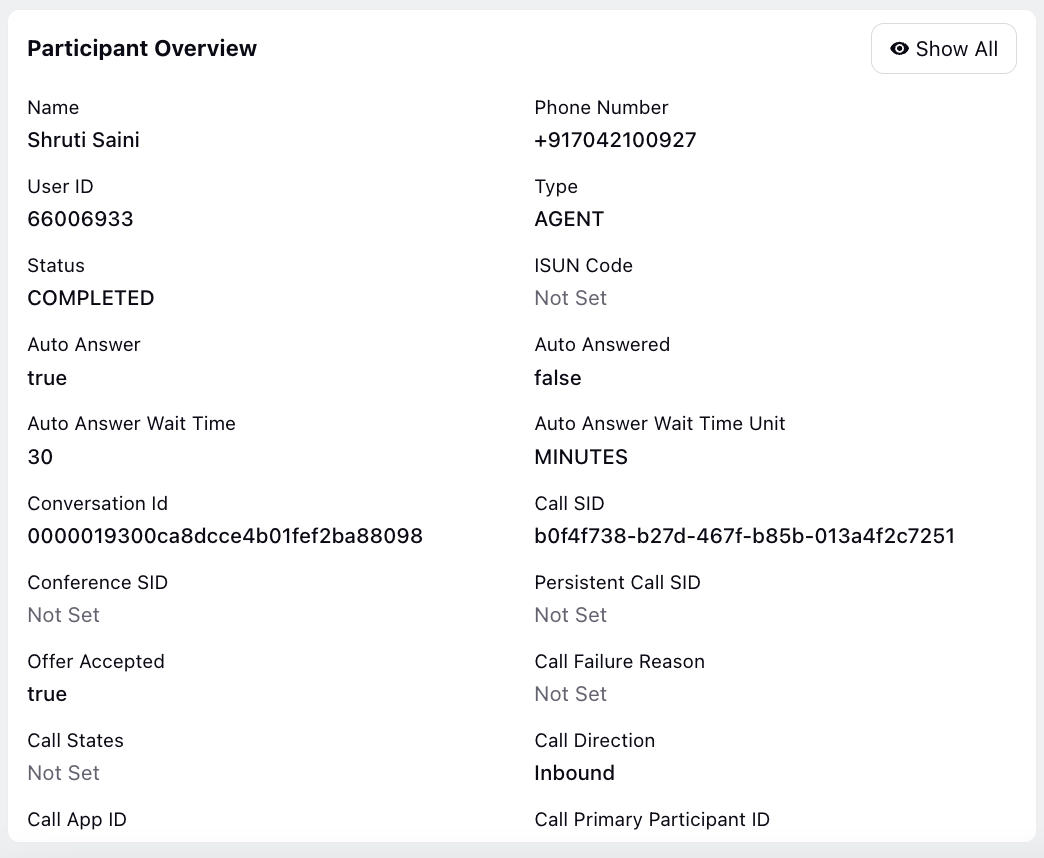
Participant Overview: Provides a breakdown of each participant’s performance.

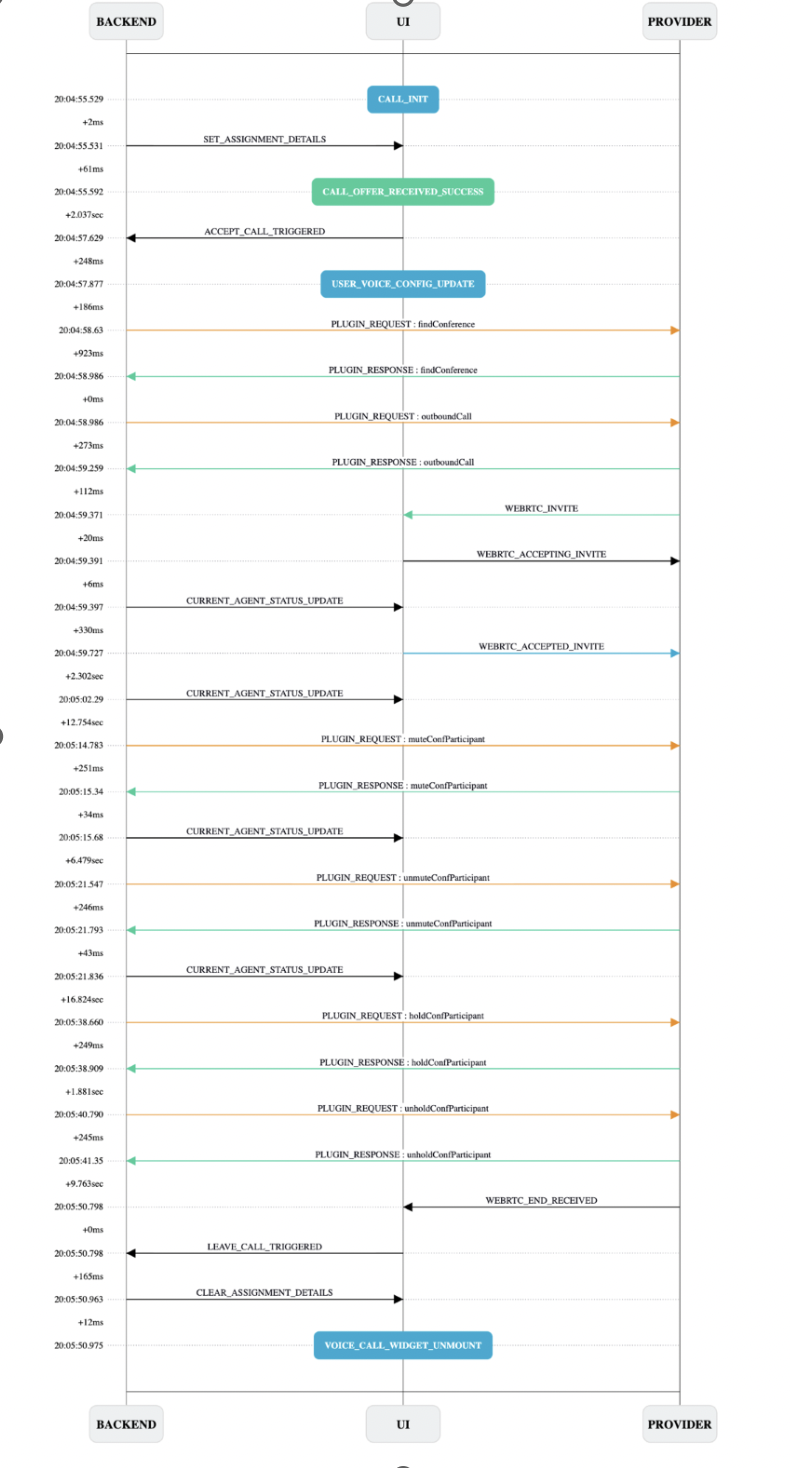
Ladder Diagram: Offers a step-by-step visual of call flow, useful for spotting any drop-offs or delays.

WebRTC Tab:
Ice Candidate: Displays information on selected network paths.
Connection: Shows connectivity information between call participants.
WebRTC Trace: Provides a trace of WebRTC activities.
Connection Statistics: Offers stats on WebRTC connection quality for troubleshooting.
Device Info Tab:
System Info: Lists system specifications and operating system data for the participant.
Media Devices: Shows details on the devices used during the call (e.g., microphone, speakers).
Logs Tab:
Conversation Logs: Provides a detailed log of call events, which is useful for tracking any technical issues throughout the call.