What Actions are Available in Widgets?
Updated
Summary
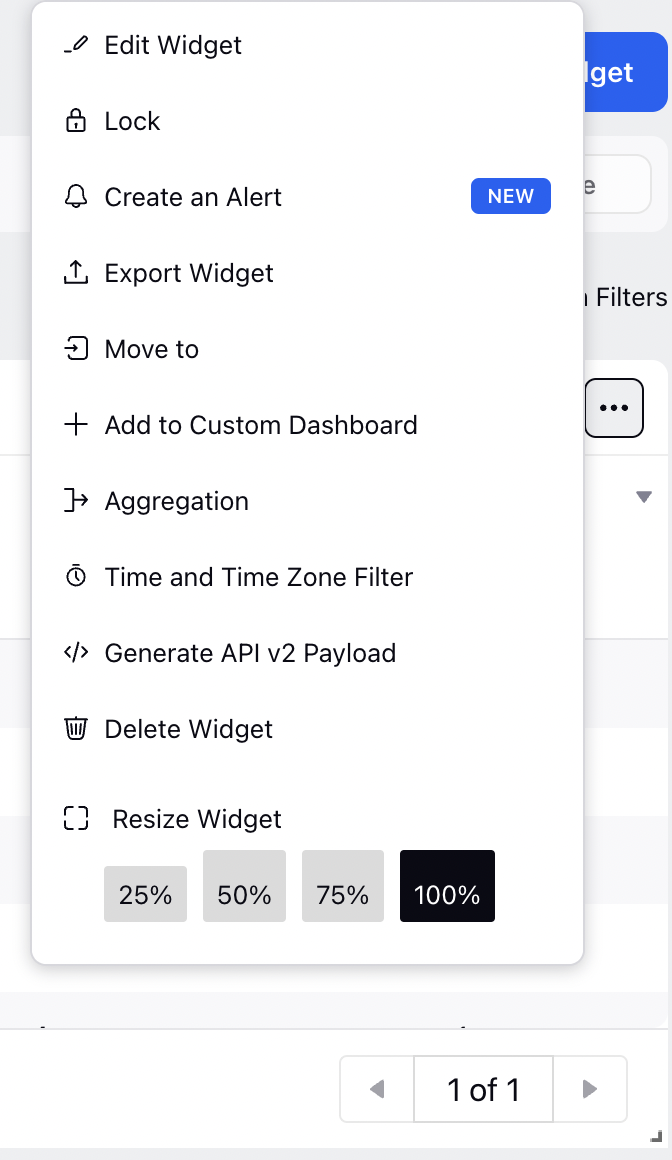
On the Ads Reporting Dashboard window, hover over the desired widget Options icon in the top right corner of the widget to see all the available actions. This article will cover about all the types of actions available in widgets.
Widget Options — Descriptions

Action | Description | ||
Edit Widget | Change the characteristics of the widget. | ||
Lock | Lock the widget so it cannot be edited or have its date range changed. | ||
Create an Alert | Click to set an alert for your widget against a threshold value. | ||
Export Widget | Export the individual widget as PDF, PNG, and XLSX. | ||
Move to | Move the widget into another tab of the report. | ||
Add to Custom Dashboard | Enables you to clone your widget within:
| ||
Time and Time Zone Filter | An individual date range can be selected for the widget that will override the dashboard date range. You can also change the time zone for that date range. | ||
Delete Widget | Remove the widget. Once removed, cannot be undone. | ||
Resize Widget | Resize the widget as desired. | ||
Circumstantial Widget Actions - The following actions only appear on some widgets: | |||
Visualization | Widgets can be changed to another compatible format, e.g. spline graphs can be changed to line graphs. The dimensions, metrics, widget filters, etc. are preserved but the widget type is altered. | ||
Aggregations | The aggregation period can be used to change how the data is grouped within a widget using Date. | ||
Annotations | Annotations can be added from this menu for graph widgets using Date. | ||
Targets | Targets can be added externally to graph widgets. | ||
View All in Ads Manager | Click to view the widget data in Ads Manager. | ||
Show Unique Total | Show Unique Total option is available only for pie chart widgets to resolve any discrepancy in the total data projected.
| ||
Widget Actions — Descriptions
# | Action | Description | |||||||
1 | Drop-down Options (Only for Table widgets) | Hover over the Drop-down icon | |||||||
| |||||||||
2 | Refresh | Click to reload and refresh the widget data. | |||||||
3 | Filter | Hover over this icon to learn about the applied filters. | |||||||
4 | Change Visualization Type | Click to change the visualization type of your widget. Learn more about visualization types in Visualization Type. | |||||||