Sprinklr Unified Platform and Cross Products: 19.11 Capabilities and Enhancements
Updated
Sprinklr Unified Platform and Cross Products' latest 19.11 release introduces a range of exciting new capabilities to enhance customer engagement, agent efficiency, and seamless integration. Here are the key features included in Sprinklr's latest release:
Sprinklr iFrame Enhancements in CRM
Sprinklr is upgrading its iFrame functionality by leveraging the Sprinklr Care Console’s Record page as an iFrame. This enhancement allows you to configure the iFrame based on your business use cases and directly utilize Sprinklr Care Console widgets such as Smart Assist, Agent Nudges, Product Catalog, and Smart Comprehend from the CRM. These features are designed to enhance customer engagement, agent efficiency and average handle time (AHT).
Refer to Care Console Widgets in iFrame for more details.
Unified Marketplace Library
We’re excited to announce a revamped marketplace in the 19.11 release, featuring a fresh design and enhanced user experience to help you navigate applications more easily.
Key Enhancements:
1. Connections Manager: A centralized tool for simplified integration management, giving you clear visibility of all installed integrations.
2. Unified Marketplace Library: Now includes compliance documentation for each connector and an improved search and filter system for quicker connector discovery.
3. Details Button: Access key information for each connector, including an overview, installation steps, FAQs and compliance documentation.
4. Partner-developed Integrations: New cards highlight integrations created by partners, broadening your options for solutions.
5. All-in-One Marketplace View: Combines the Connections Manager, installation documentation and FAQs in one convenient location.
Refer to Unified Marketplace Library for more details.
Sprinklr V2 API | The Read Asset V2 API now Supports More Asset Types
You can now fetch additional asset types using the Read Asset V2 API. The supported asset types include:
PRESENTATION, PHOTO, VIDEO, AUDIO, FLASH, HTML, PDF, DOC, DOCX, EXCEL, ZIP, PSD, SKETCH, FONT, SUBTITLE, TEMPLATE_ASSET, RAR, SVG, EML, MSG, EDB, ICS, EPS, INDD, LINK, POST, RICH_TEXT, TEXT, POLL, GEO_LOCATION
Display
Ability to setup drilldown Custom Lens for different metrics and dimensions
Sprinklr has enhanced its features to allow you to effortlessly delve deeper into your data by drilling down on display widgets in real time. Listed are the benefits of this feature:
Customise lenses independently for any of your metrics or dimensions in charts to have more flexibility.
Enhanced visibility on command center interface like list of agents available, agent 360 view( how many cases are handled, closed)
Faster and more flexible setup for storytelling, saving time in implementation and gaining insights seamlessly.
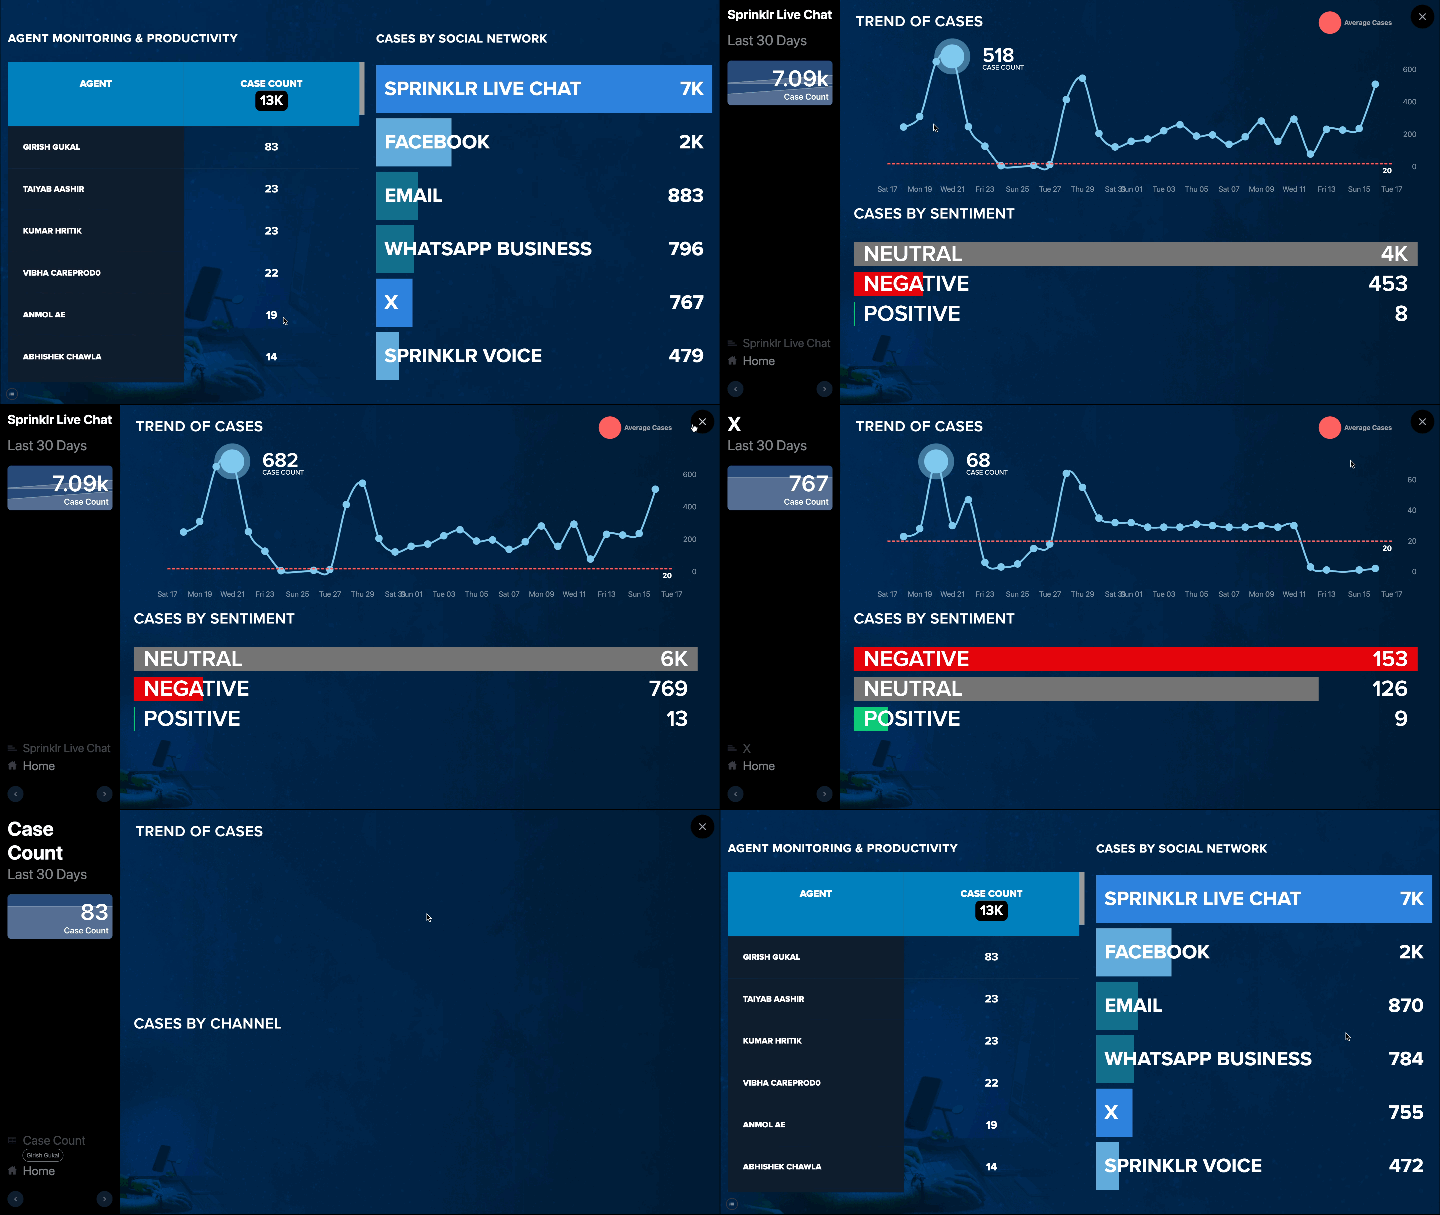
Ability to drilldown using remote for any custom lens setup
In this release, the display remote has been upgraded to include touch screen support and drill-down features for all custom lens setups.
Simply open the desired remote, navigate to the specific scene or panel, and click on the widgets with drill-down enabled to access additional information—eliminating the need for costly touch screen upgrades and hardware setups.
New Displays to have Fixed as default mode
In this release, when a new display is created, it is automatically set to "Fixed" mode, allowing it to scale up or down in resolution based on screen size. If needed, it can be switched to "Fluid" mode from the settings tab of the specific display.
Presentations
The following features are introduced to Display and Presentation for improved experience and effeciency:
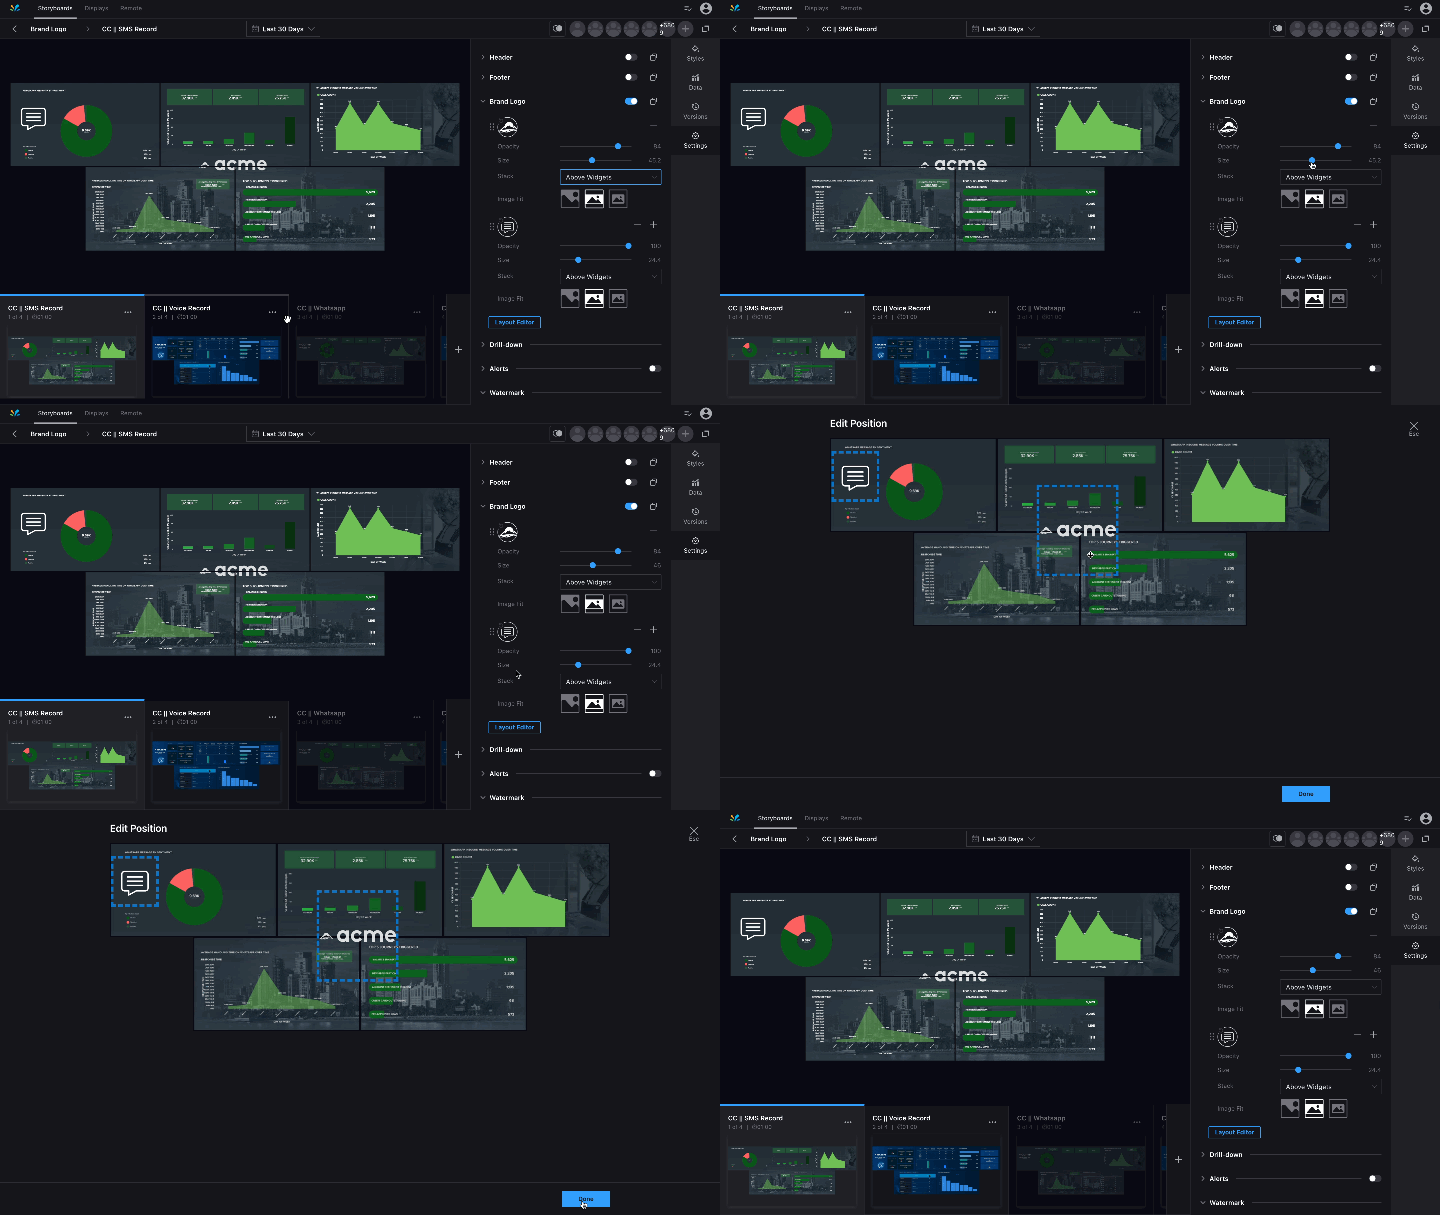
Ability to dynamically add and manage logo at scale
With the new enhancement it's easier than ever to set up and manage logo across all the scenes and slides(while setting up storyboard and presentation) ensuring consistency and efficiency. You can effortlessly upload and position your logo, which will automatically sync across all slides. The new Layout Editor tab also makes it simple to position and manage the logo across multiple panels.
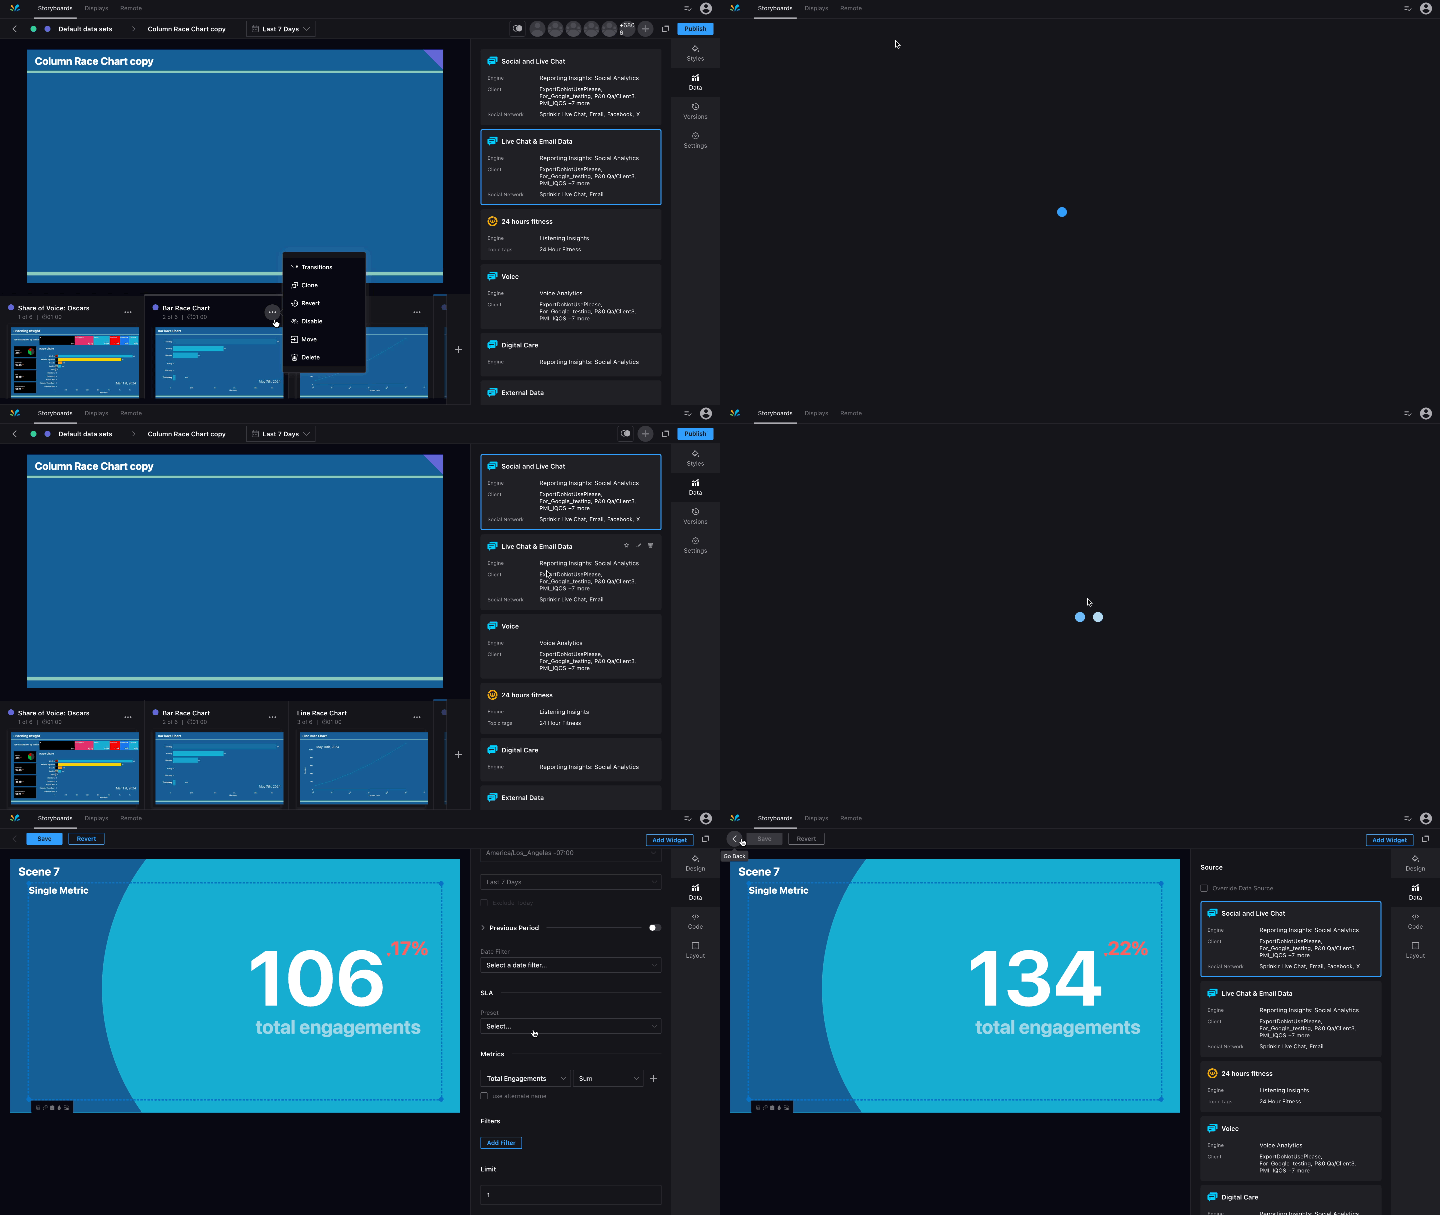
Sort and set default data presets for quick widget setup
With this enhancement, you can create global data presets for presentations and storyboards, enabling them to stack presets as desired and designate one as the default. This ensures that whenever a new widget is created, it automatically configures the data engine and filters, significantly enhancing efficiency.
Enhanced interactivity with all new Layout Formatting in widget
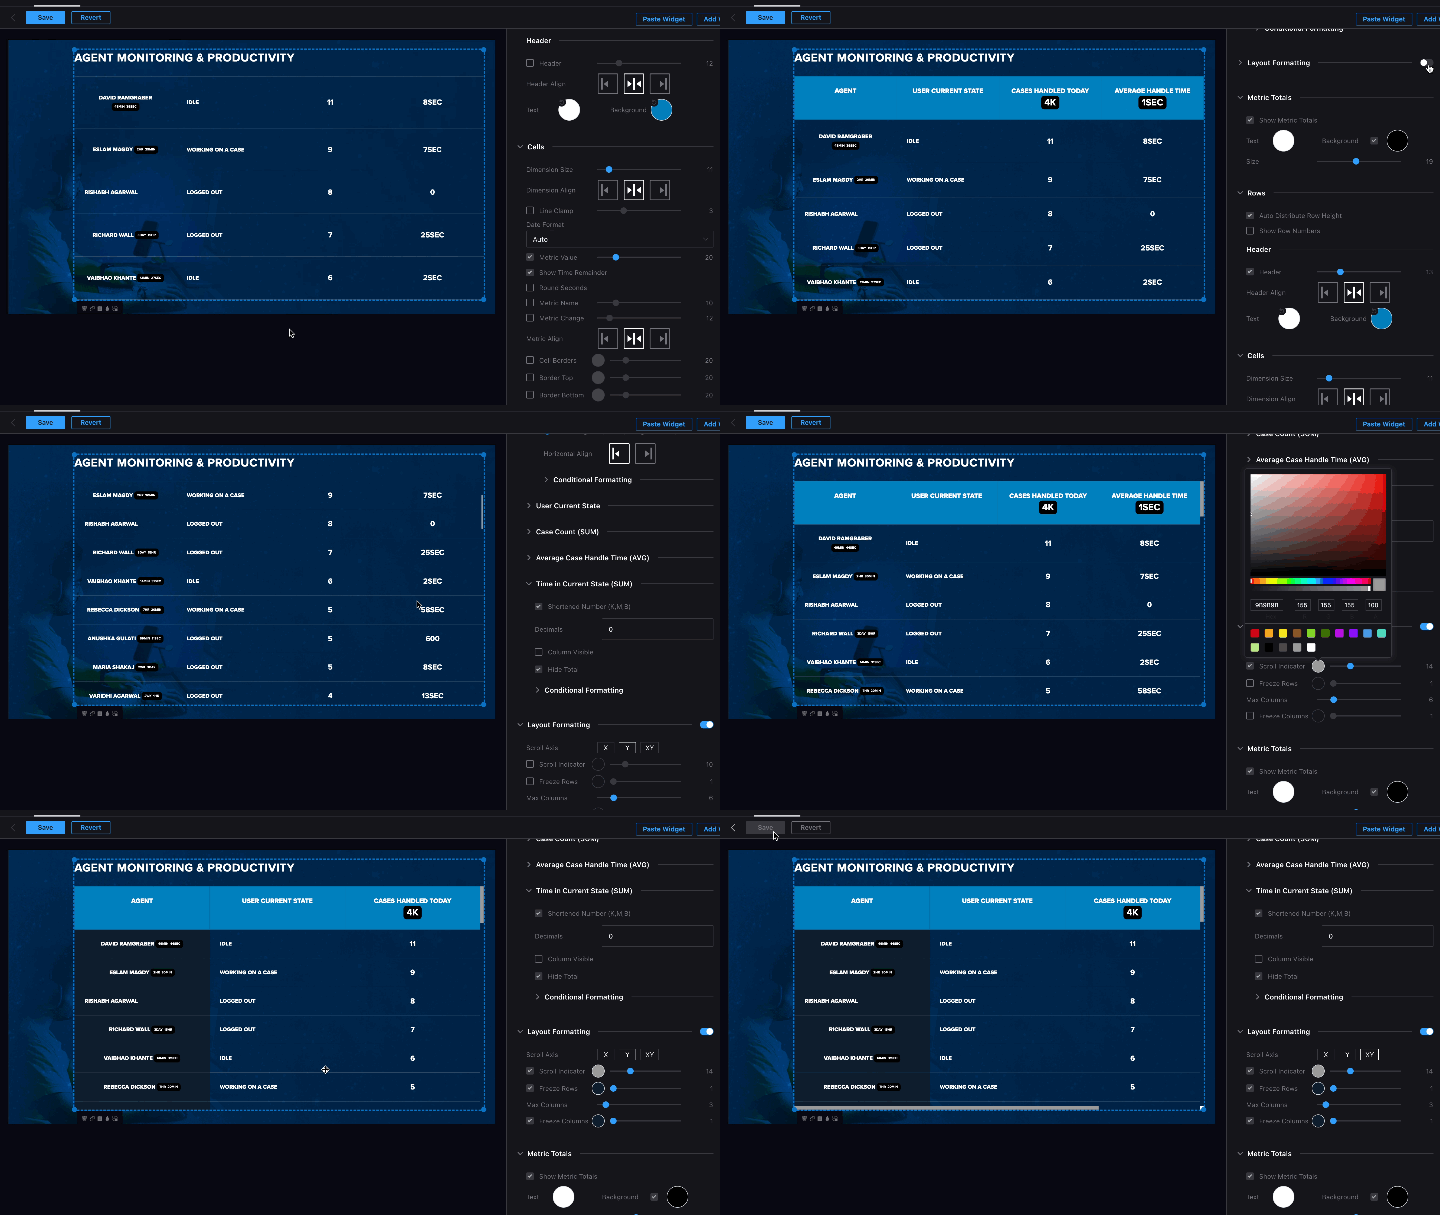
In this release, with the new layout formatting option, table widgets have been enhanced with interactive options that facilitate smooth scrolling along both the X and Y axes, removing the need for multiple tables to display extensive data. You can also freeze panes and apply design options for clear, consistent visual cues, ensuring immediate insights at a glance.
Dynamically sync and update Style Kits
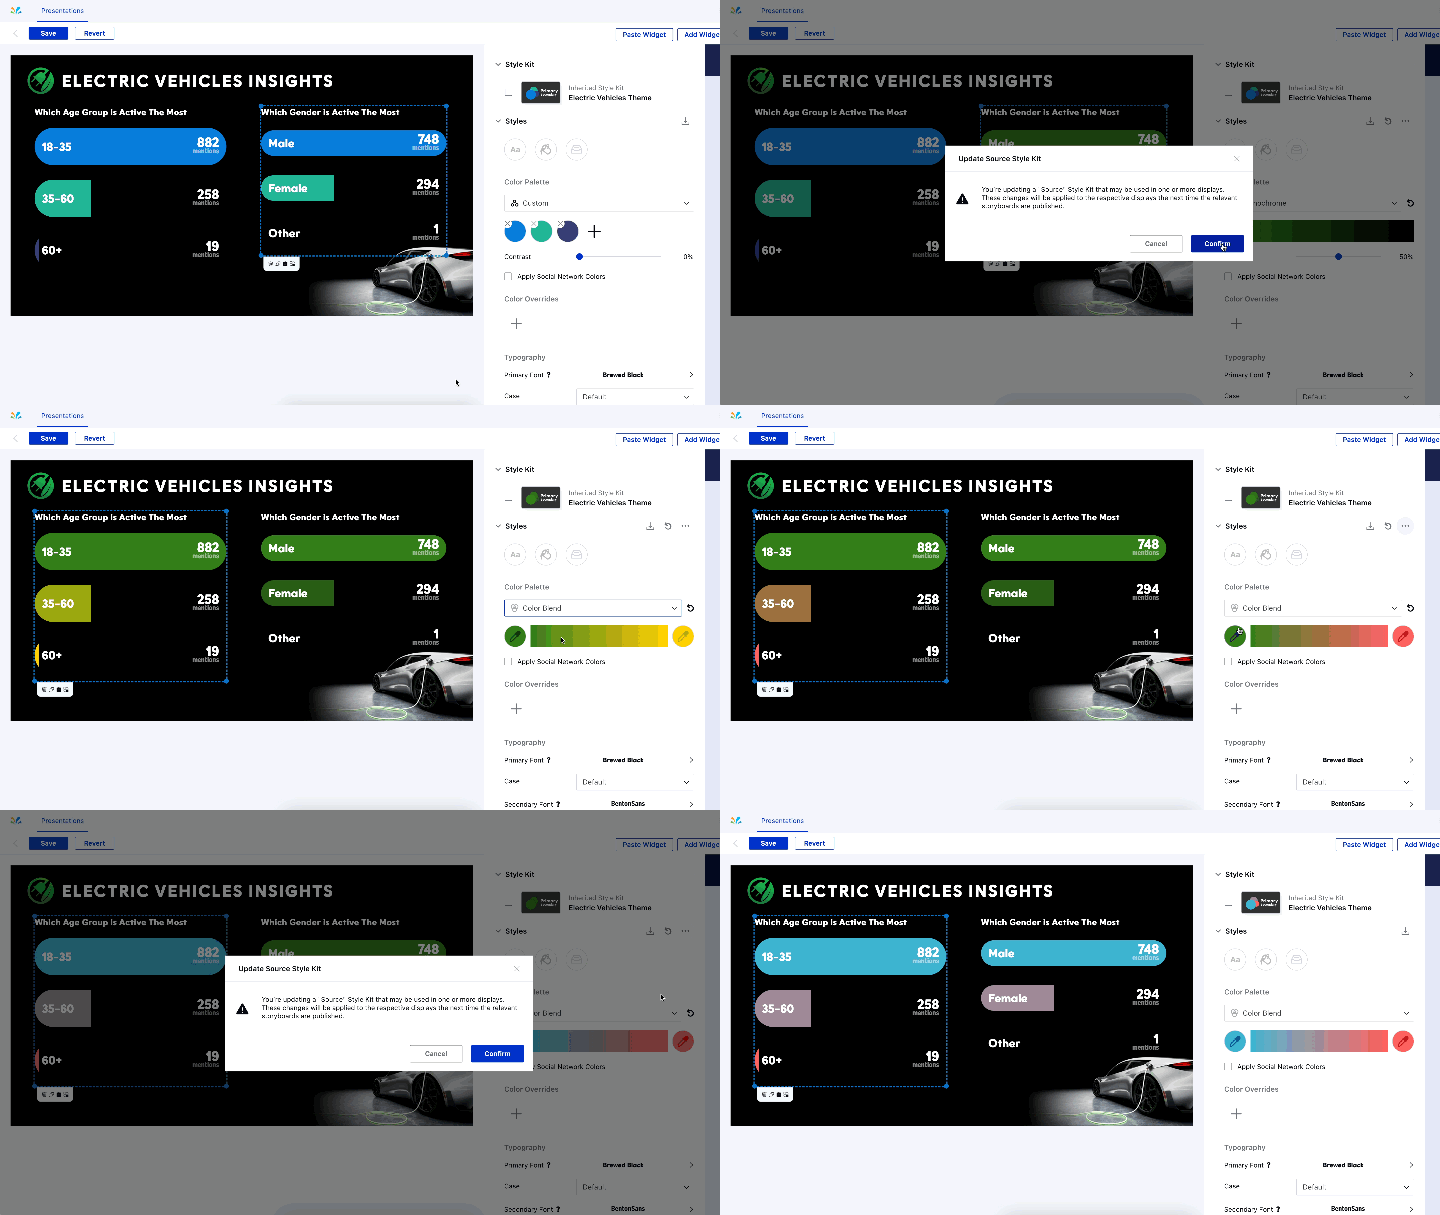
Style kits enable you to save branding guidelines, including color palettes, typography, and other visual elements as templates. With the introduction of dynamic style kits, you can now easily apply these templates across multiple slides and presentations, streamlining workflows and ensuring consistent designs during updates or distribution
New improved dynamic hyperlink buttons
Sprinklr has introduced a hyperlink button that can be configured to dynamically navigate to specific scene or slide locations. This means that when scenes or slides are reorganized in the future, the hyperlink options will continue to function correctly, eliminating the need for any reconfiguration.
Ability to add animations for custom icon sets
Background animations that animate on real time basis can now be included while adding any custom icons from inbuilt library or asset manager.You can also configure these animations based on your preferred frequency and duration settings.
![]()
New design formatting options for Stacked and Pie charts
In this release, stacked bar and column charts now feature enhanced design formatting options for managing "Radius," making it easier to set up rounded corners and edges. Additionally, pie charts have been improved to support data labels that display either percentages or absolute values.
Support for Listening Explorer in new widgets
Listening Explorer as a data engine is now supported with multiple enhanced widgets like World Heat Map, Emoji Cloud, and Sunburst/Topic Cluster. This provides you with a broader set of tools to aid in your research and market exploration.
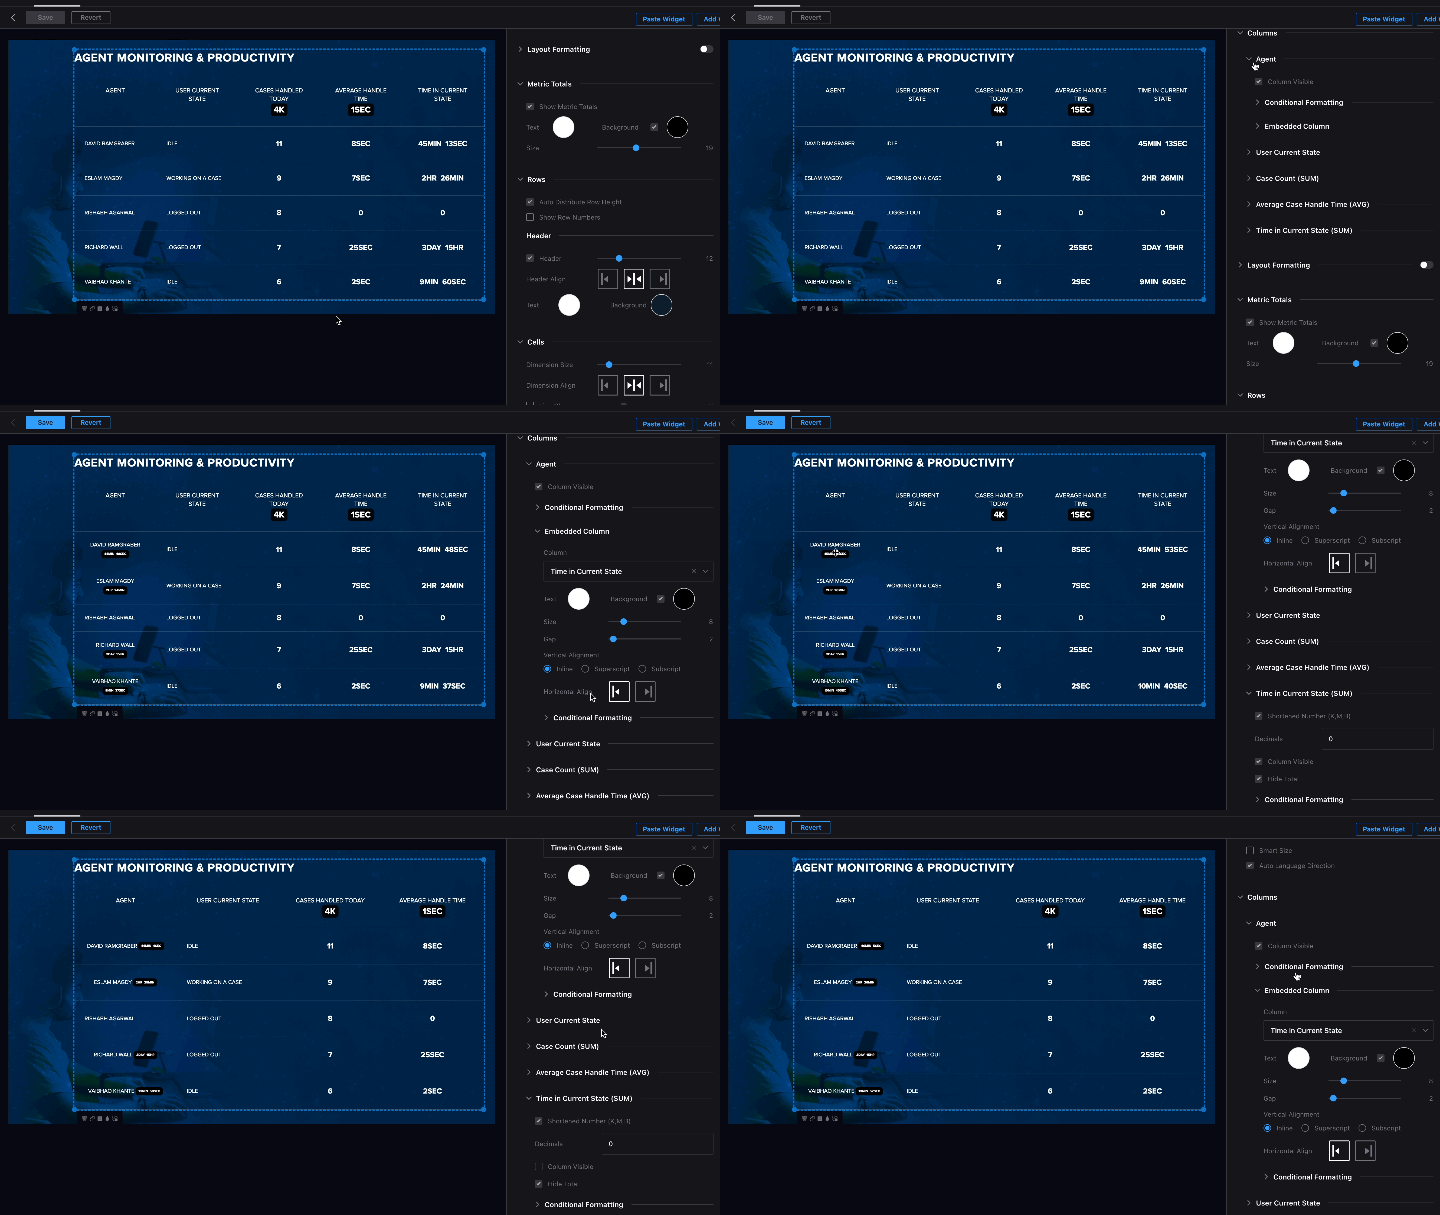
Ability to hide or unhide and embed columns in table widget
You can now choose to hide or unhide specific columns in a table without needing to constantly add or remove them from the data tab, providing greater flexibility in management.
Additionally, you can choose to embed specific columns to present more organized and relevant information upfront, enhancing readability and transparency.
Example: You might include the current time in the agent's name column, giving you quick insights into agent status at a glance.
