Sprinklr Insights: 19.8 Capabilities and Enhancements
Updated
Sprinklr's latest release introduces a range of exciting new capabilities aimed at empowering your business to create more meaningful customer experiences across all touchpoints.
Here are the key features included in Sprinklr's latest release:
![]() Note: These are preliminary release notes and may undergo changes till the release (Aug 24-31, 2024).
Note: These are preliminary release notes and may undergo changes till the release (Aug 24-31, 2024).
Sprinklr Insights | |||
Sprinklr Social | Unified Platform | ||
Sprinklr Surveys
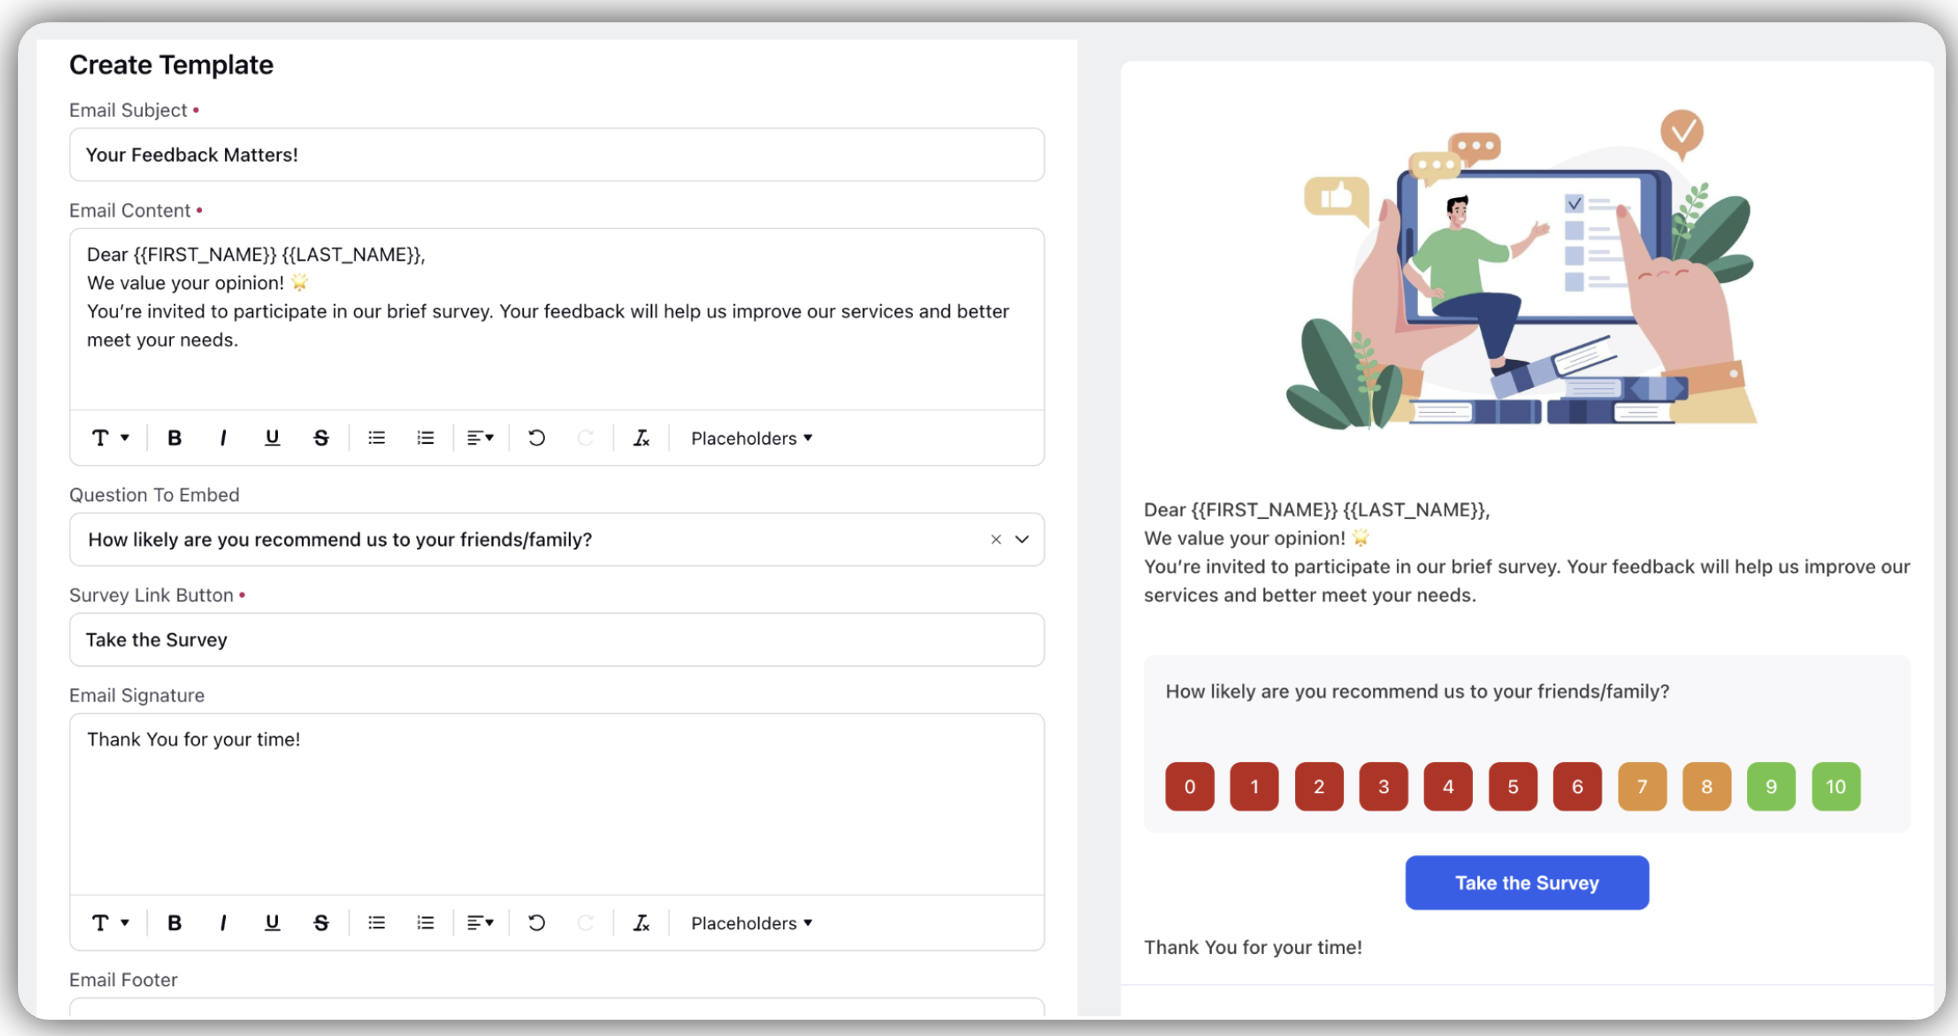
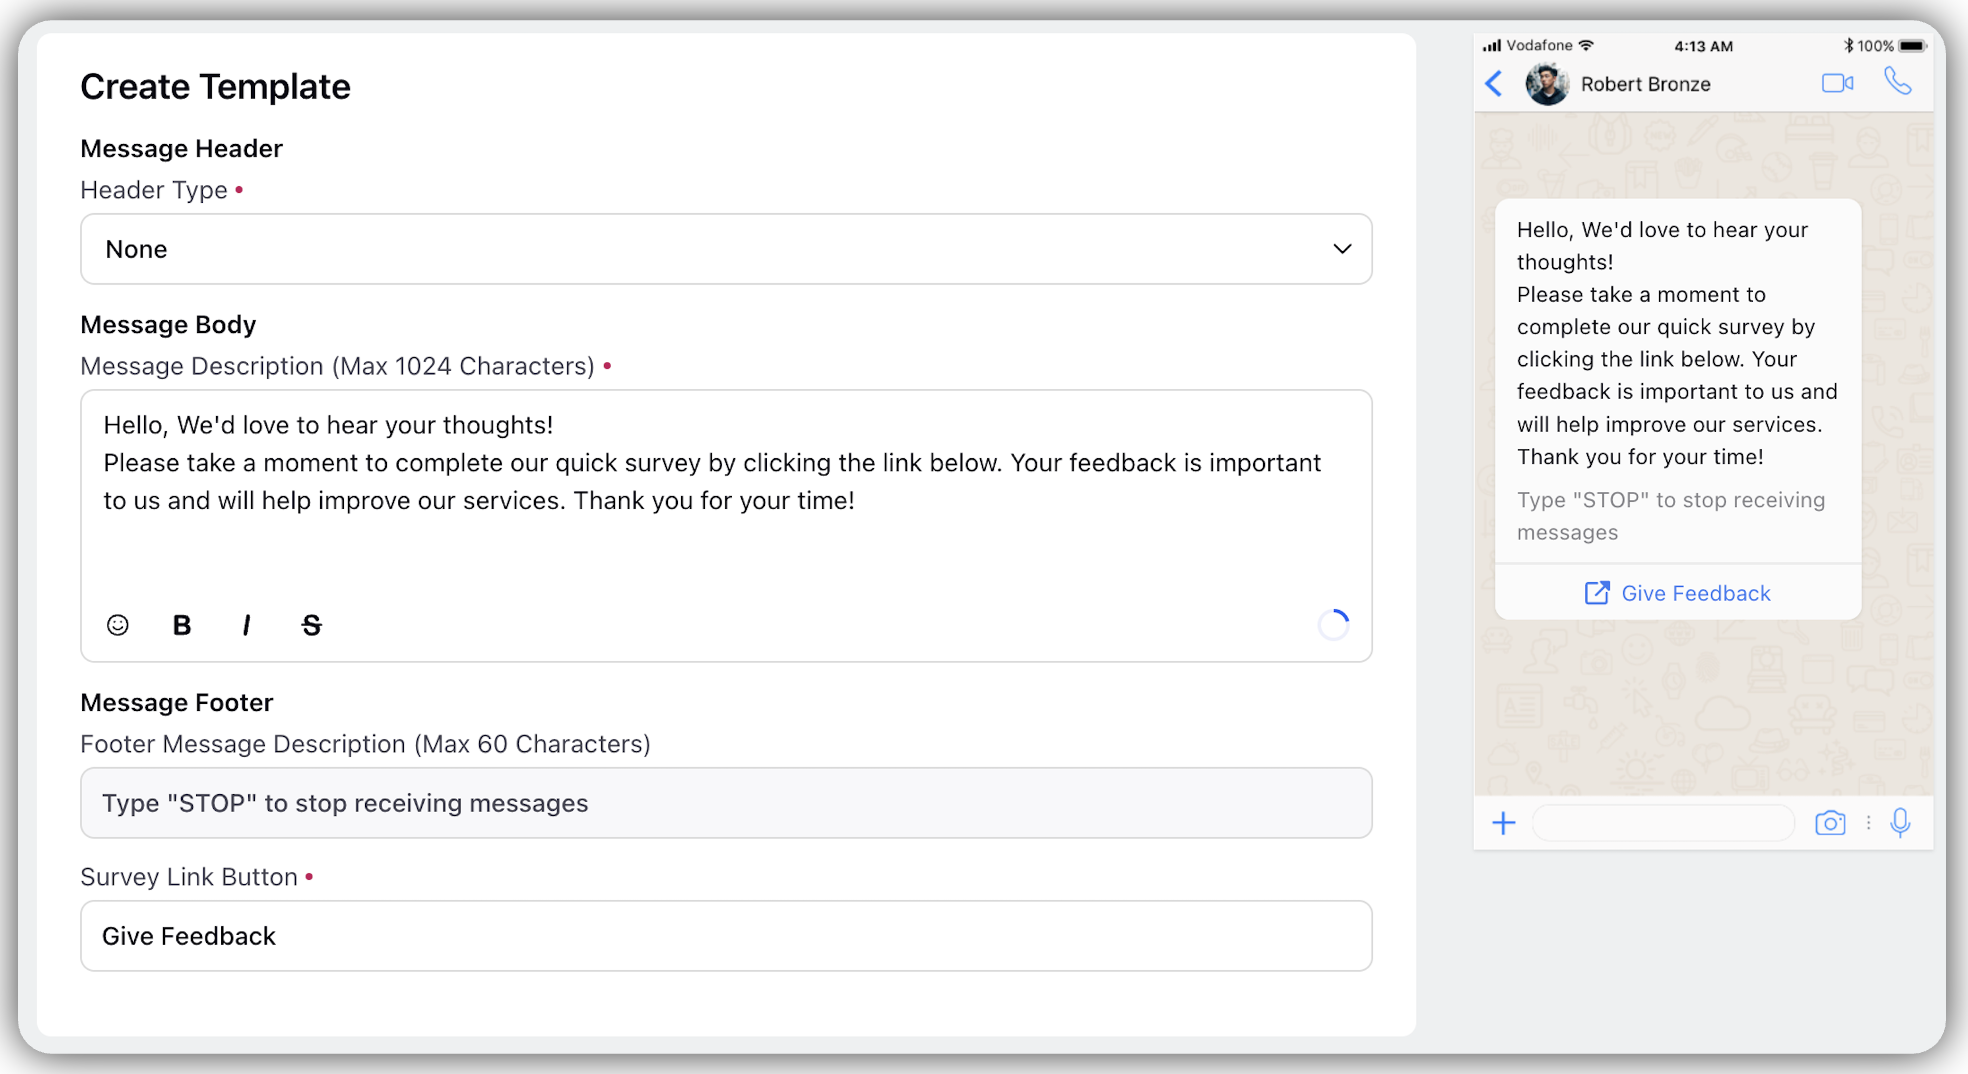
Omnichannel Survey Distribution
This feature provides users the ability to gather solicited customer feedback via Email and WhatsApp enabling brands to capture insights at every customer touchpoint. It will increase the rate of response and improve the quality of feedback.
User Benefits: This sets the base for expanding our distribution to other channels like social, improve customer feedback volume and quality by sending surveys on right channels.
There are multiple ways in which you can design the distribution survey like Whatsapp and Email Messages.
We can customise the workflow to schedule optimum distribution to suit the needs to get impactful feedback. Both active and passive feedbacks can be collected from the customers.
![]() Note: This is a part of Sprinklr Survey Module which is paid.
Note: This is a part of Sprinklr Survey Module which is paid.
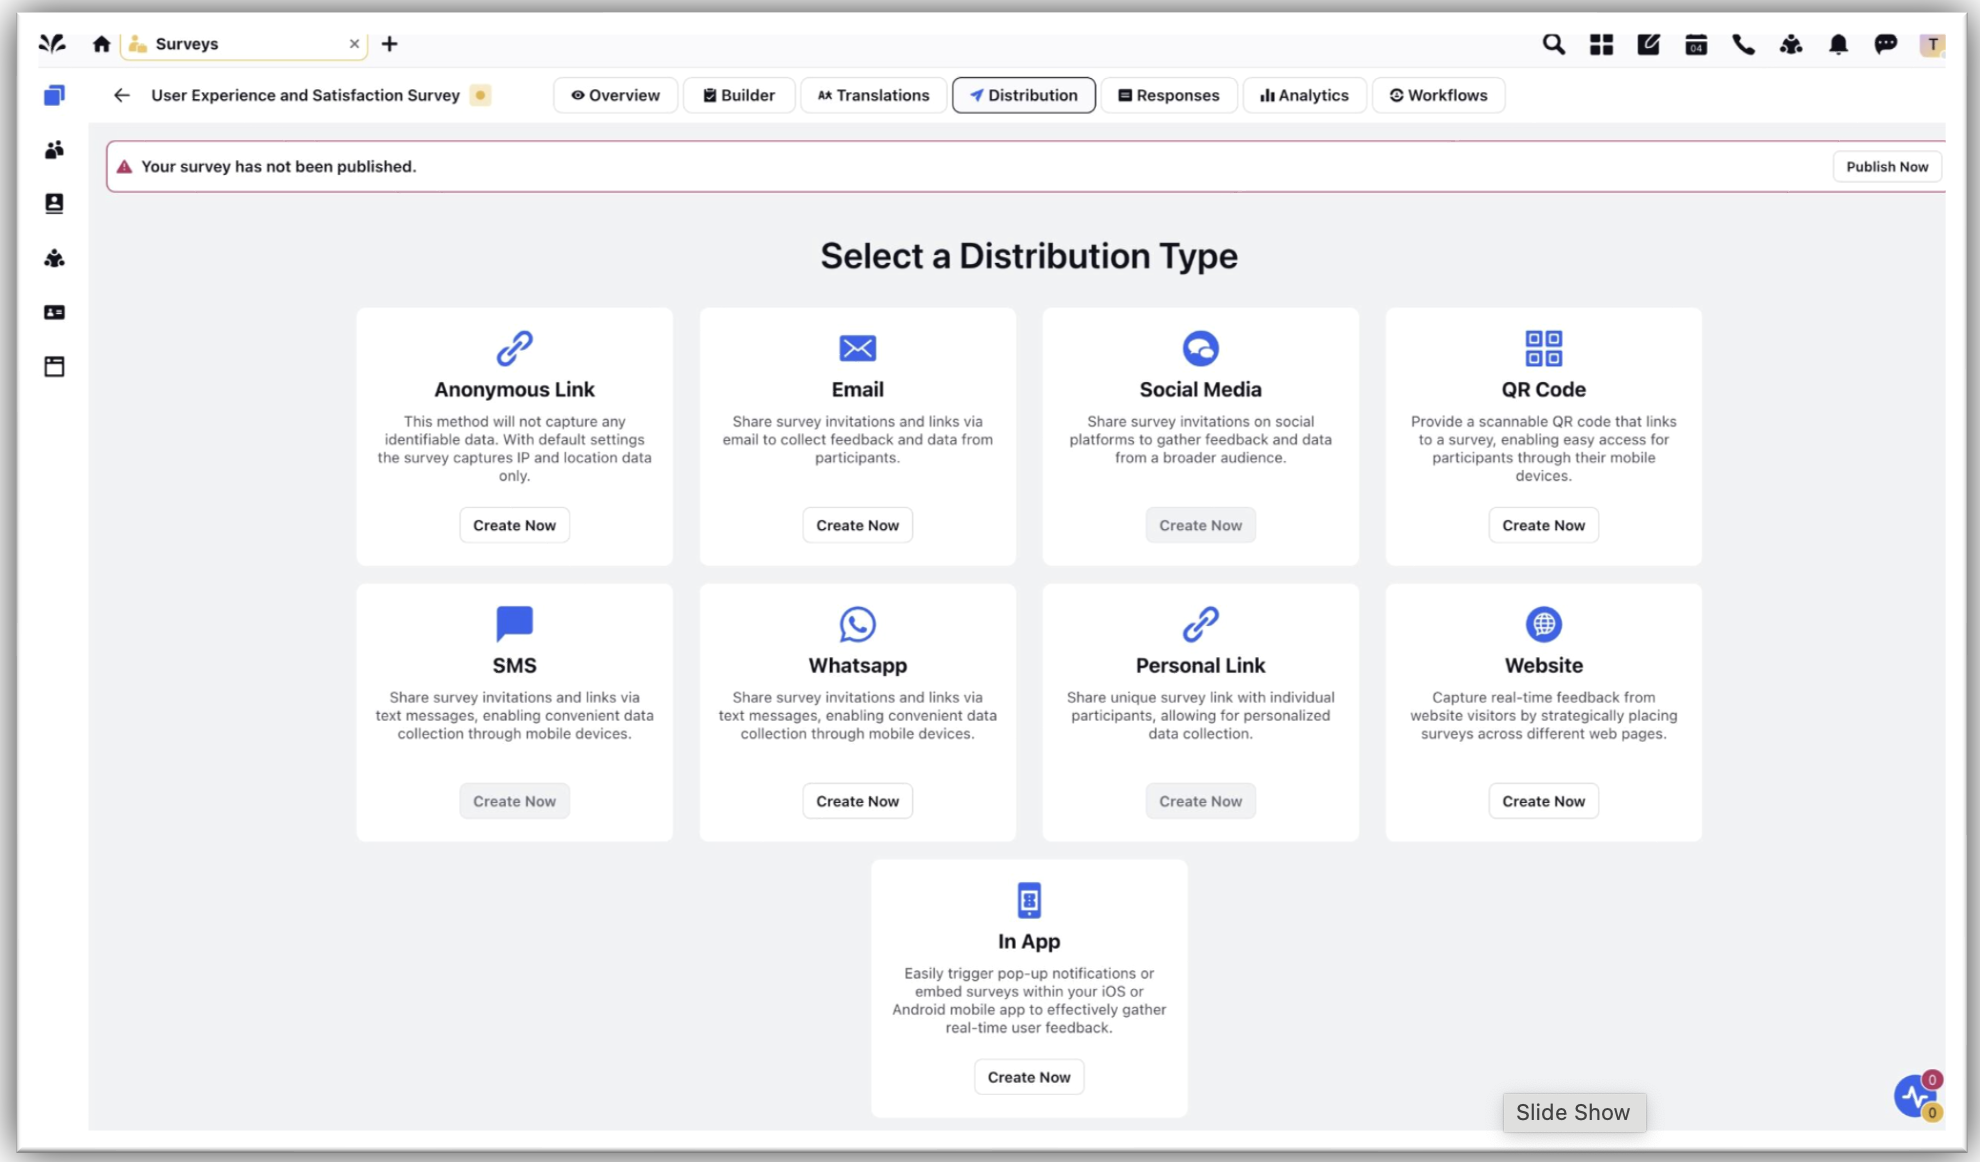
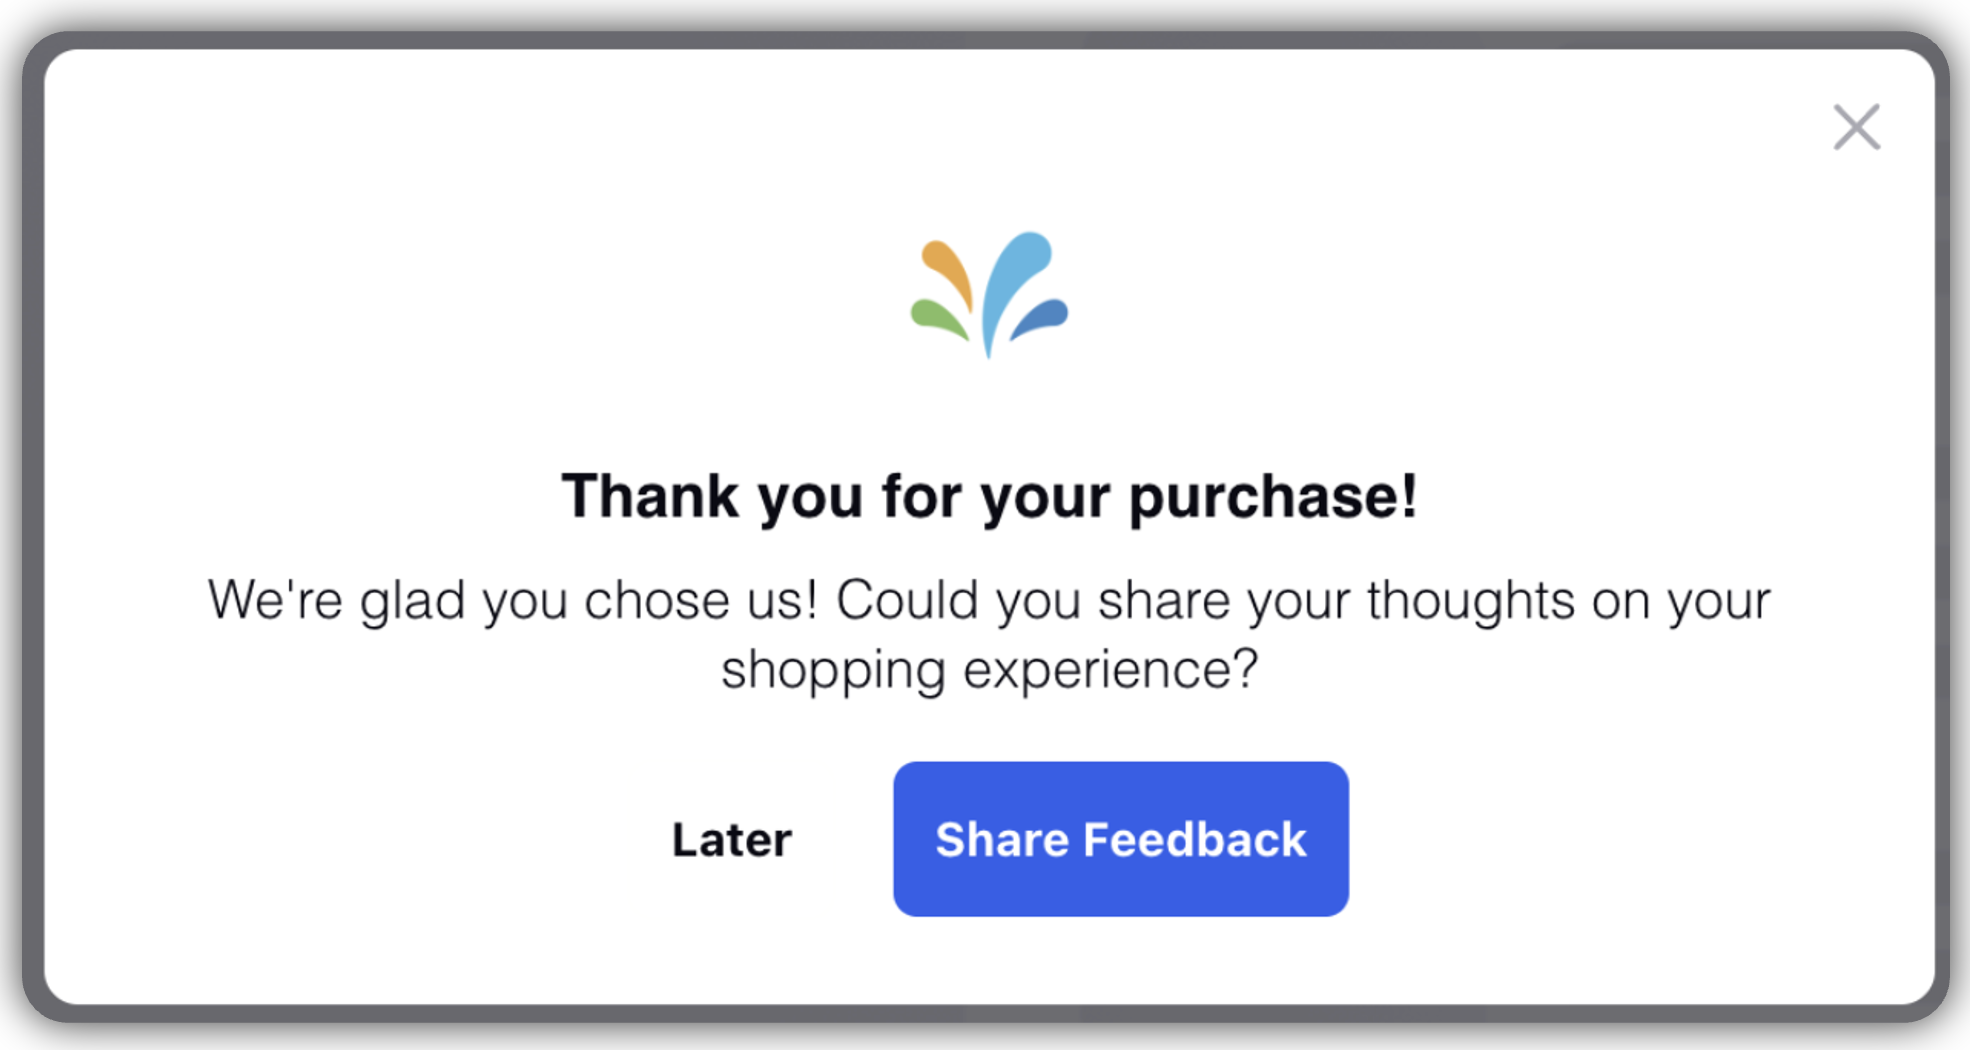
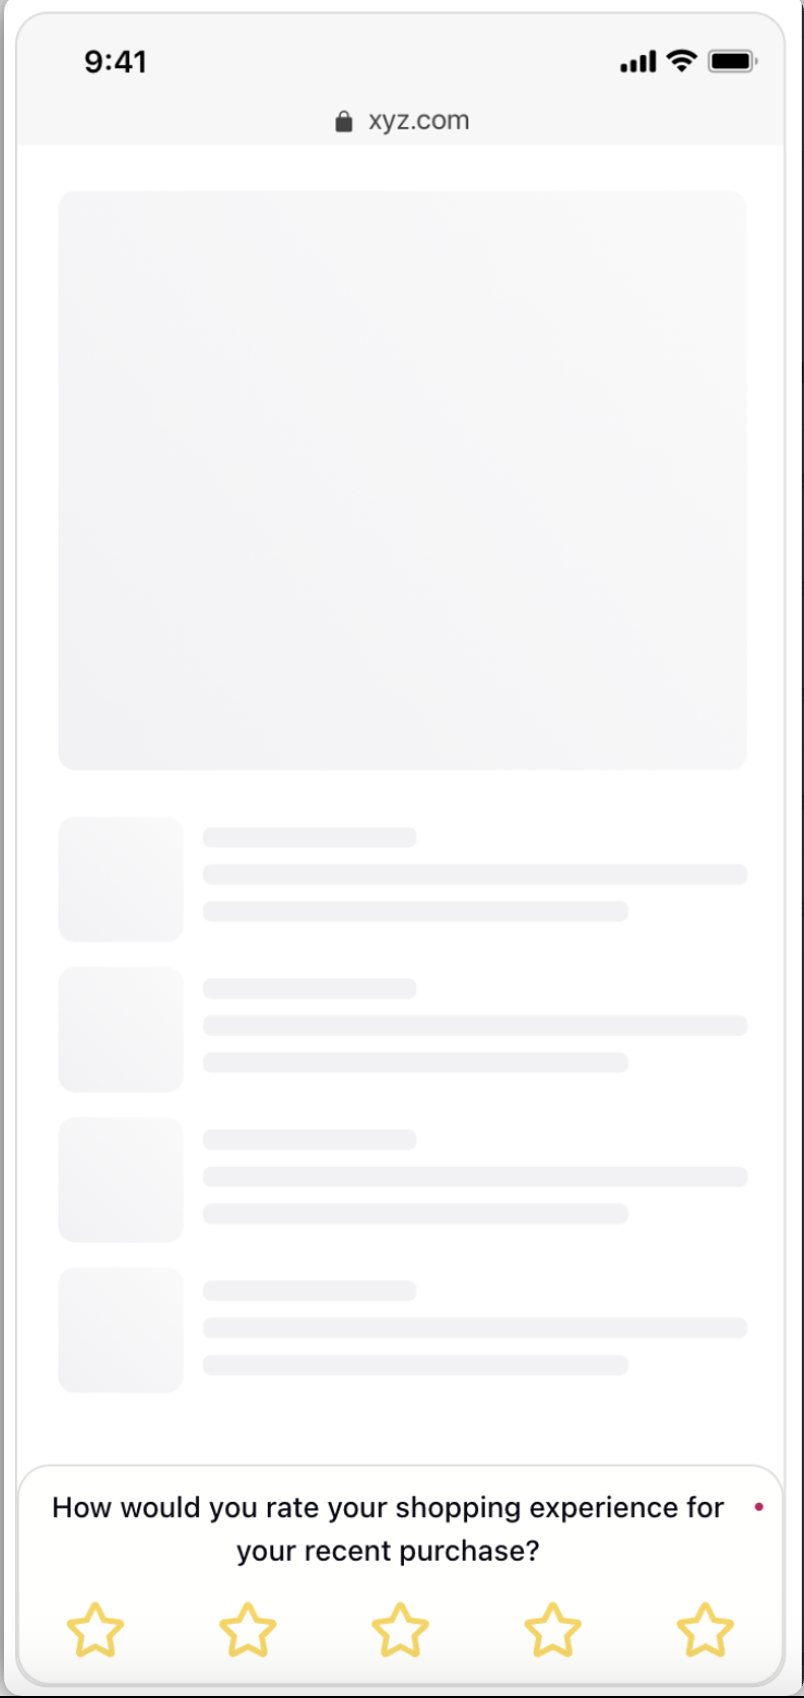
Website and In-App Surveys
This feature provides users the ability to gather solicited customer feedback via Websites and In-App, enabling brands to capture insights at every customer touchpoint. It will increase the rate of response and improve the quality of feedback.
Website and In-Apps enables one to gather feedback on digital platforms at critical points in the user journey.
Users can explore a library of pre-built creatives such as pop-ups, feedback buttons, micro surveys or tailor their own survey as per brand requirements.
Users can deploy surveys on digital platforms using 30 pre-defined conditions like browsing behaviours and session length or create custom trigger for targeted event based feedback.
User Benefits:
Users can embed code or SDK on their websites and mobile apps and effortlessly handle all survey management, creative updates and trigger settings directly from Sprinklr.
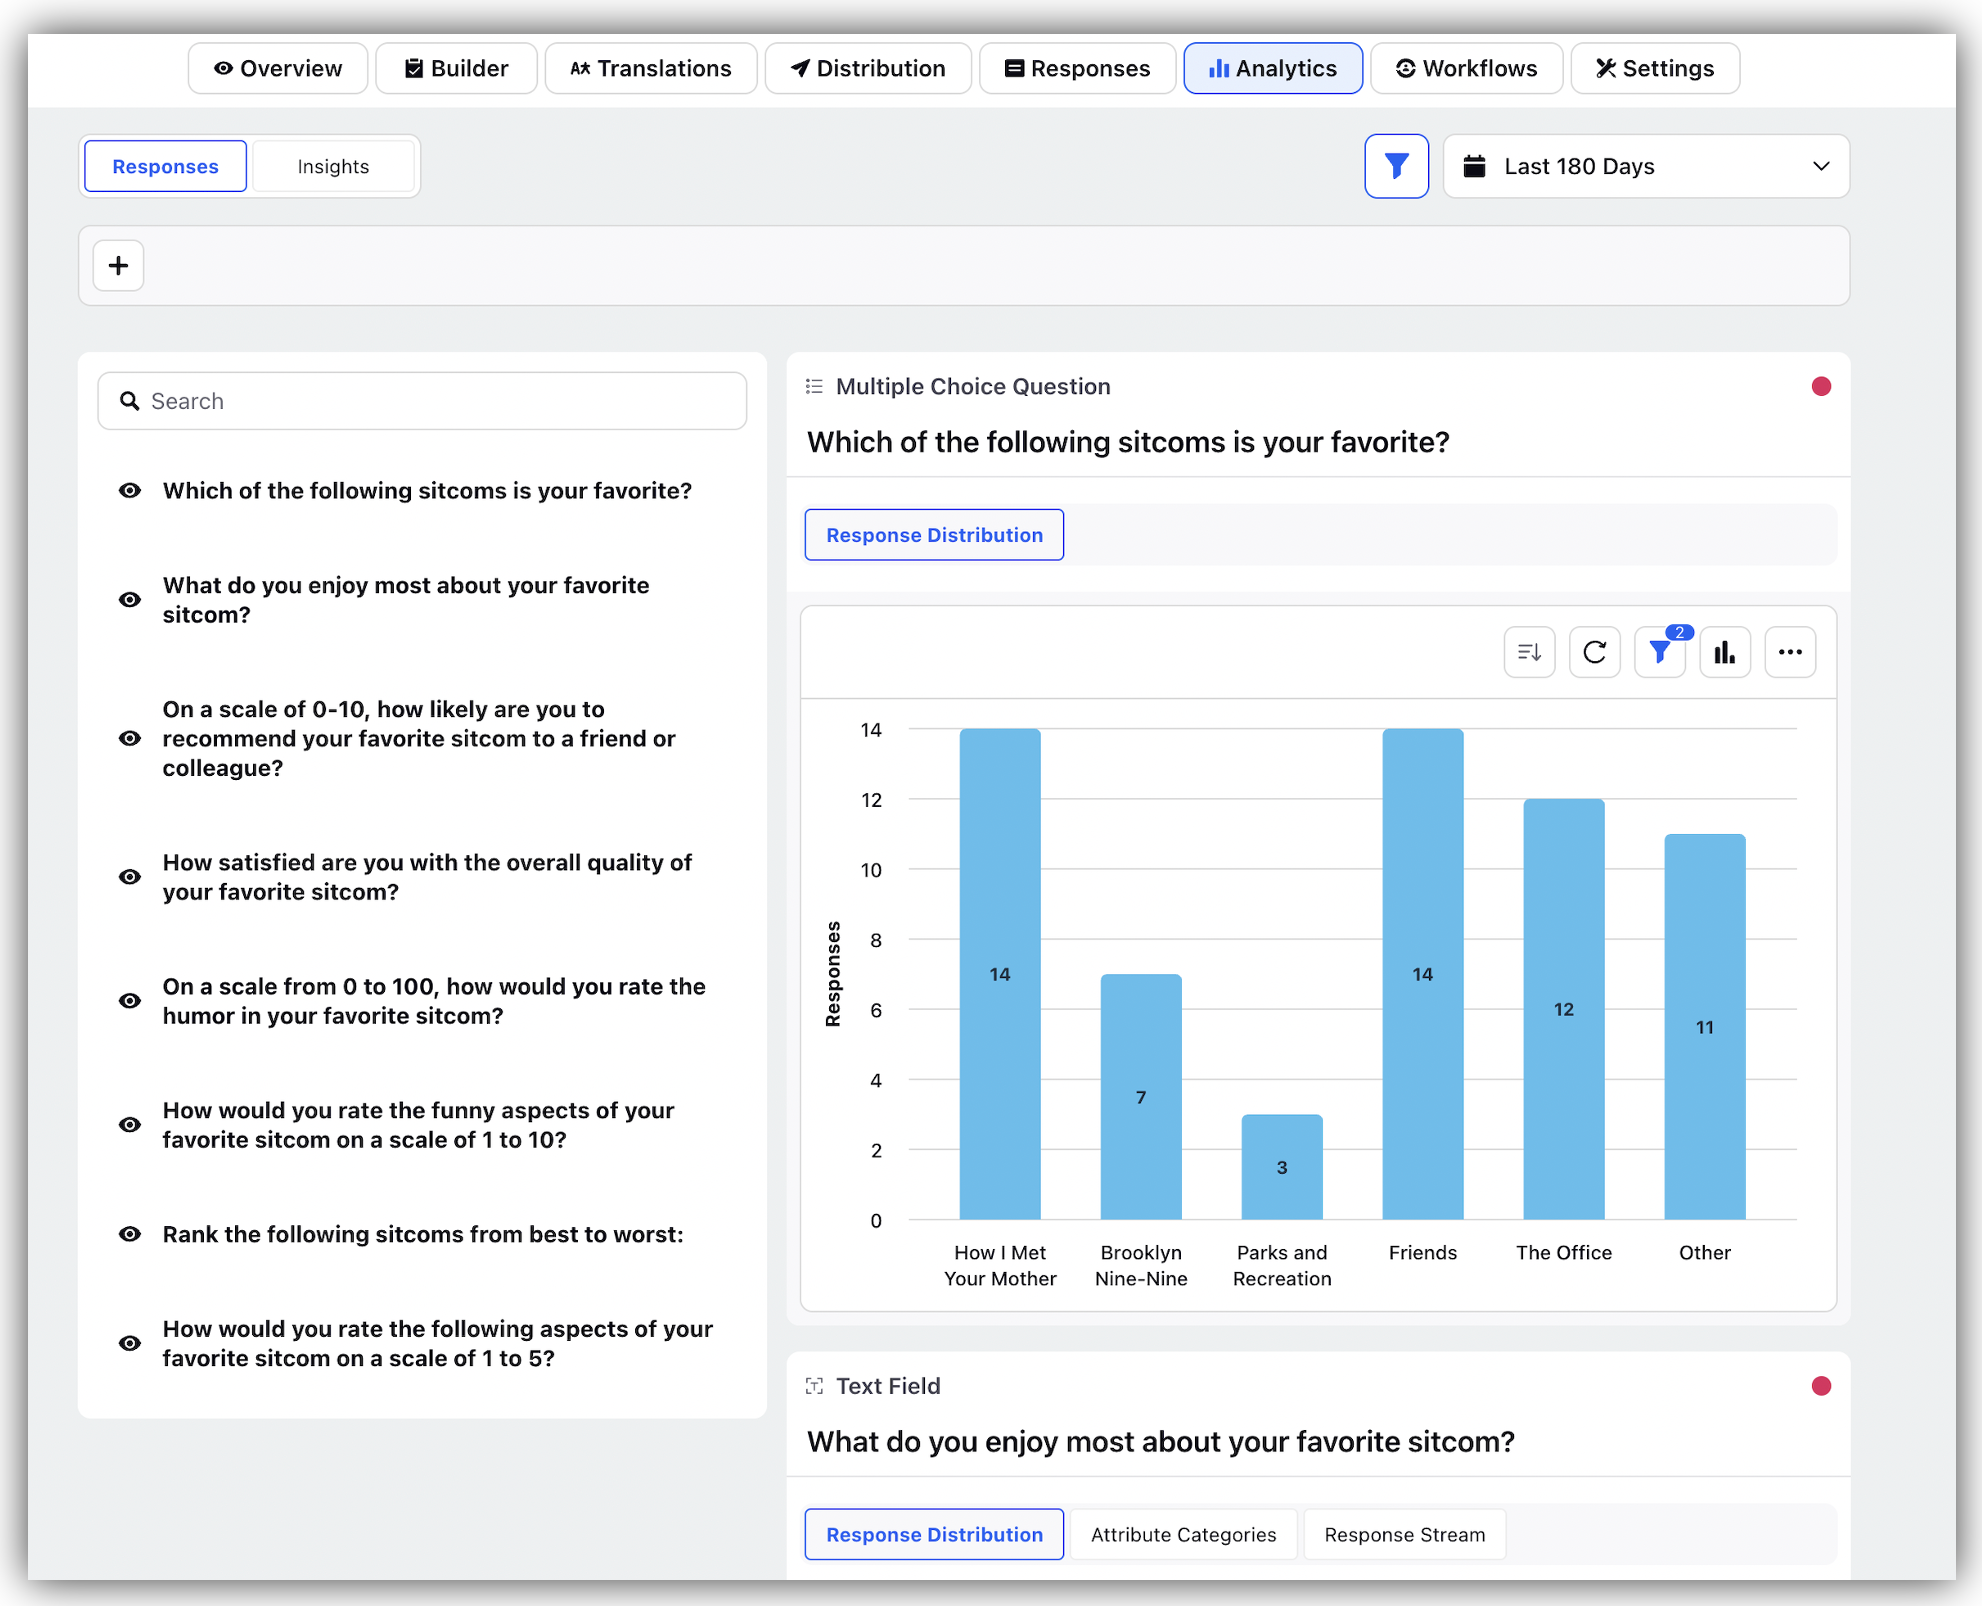
Advanced Survey Analytics
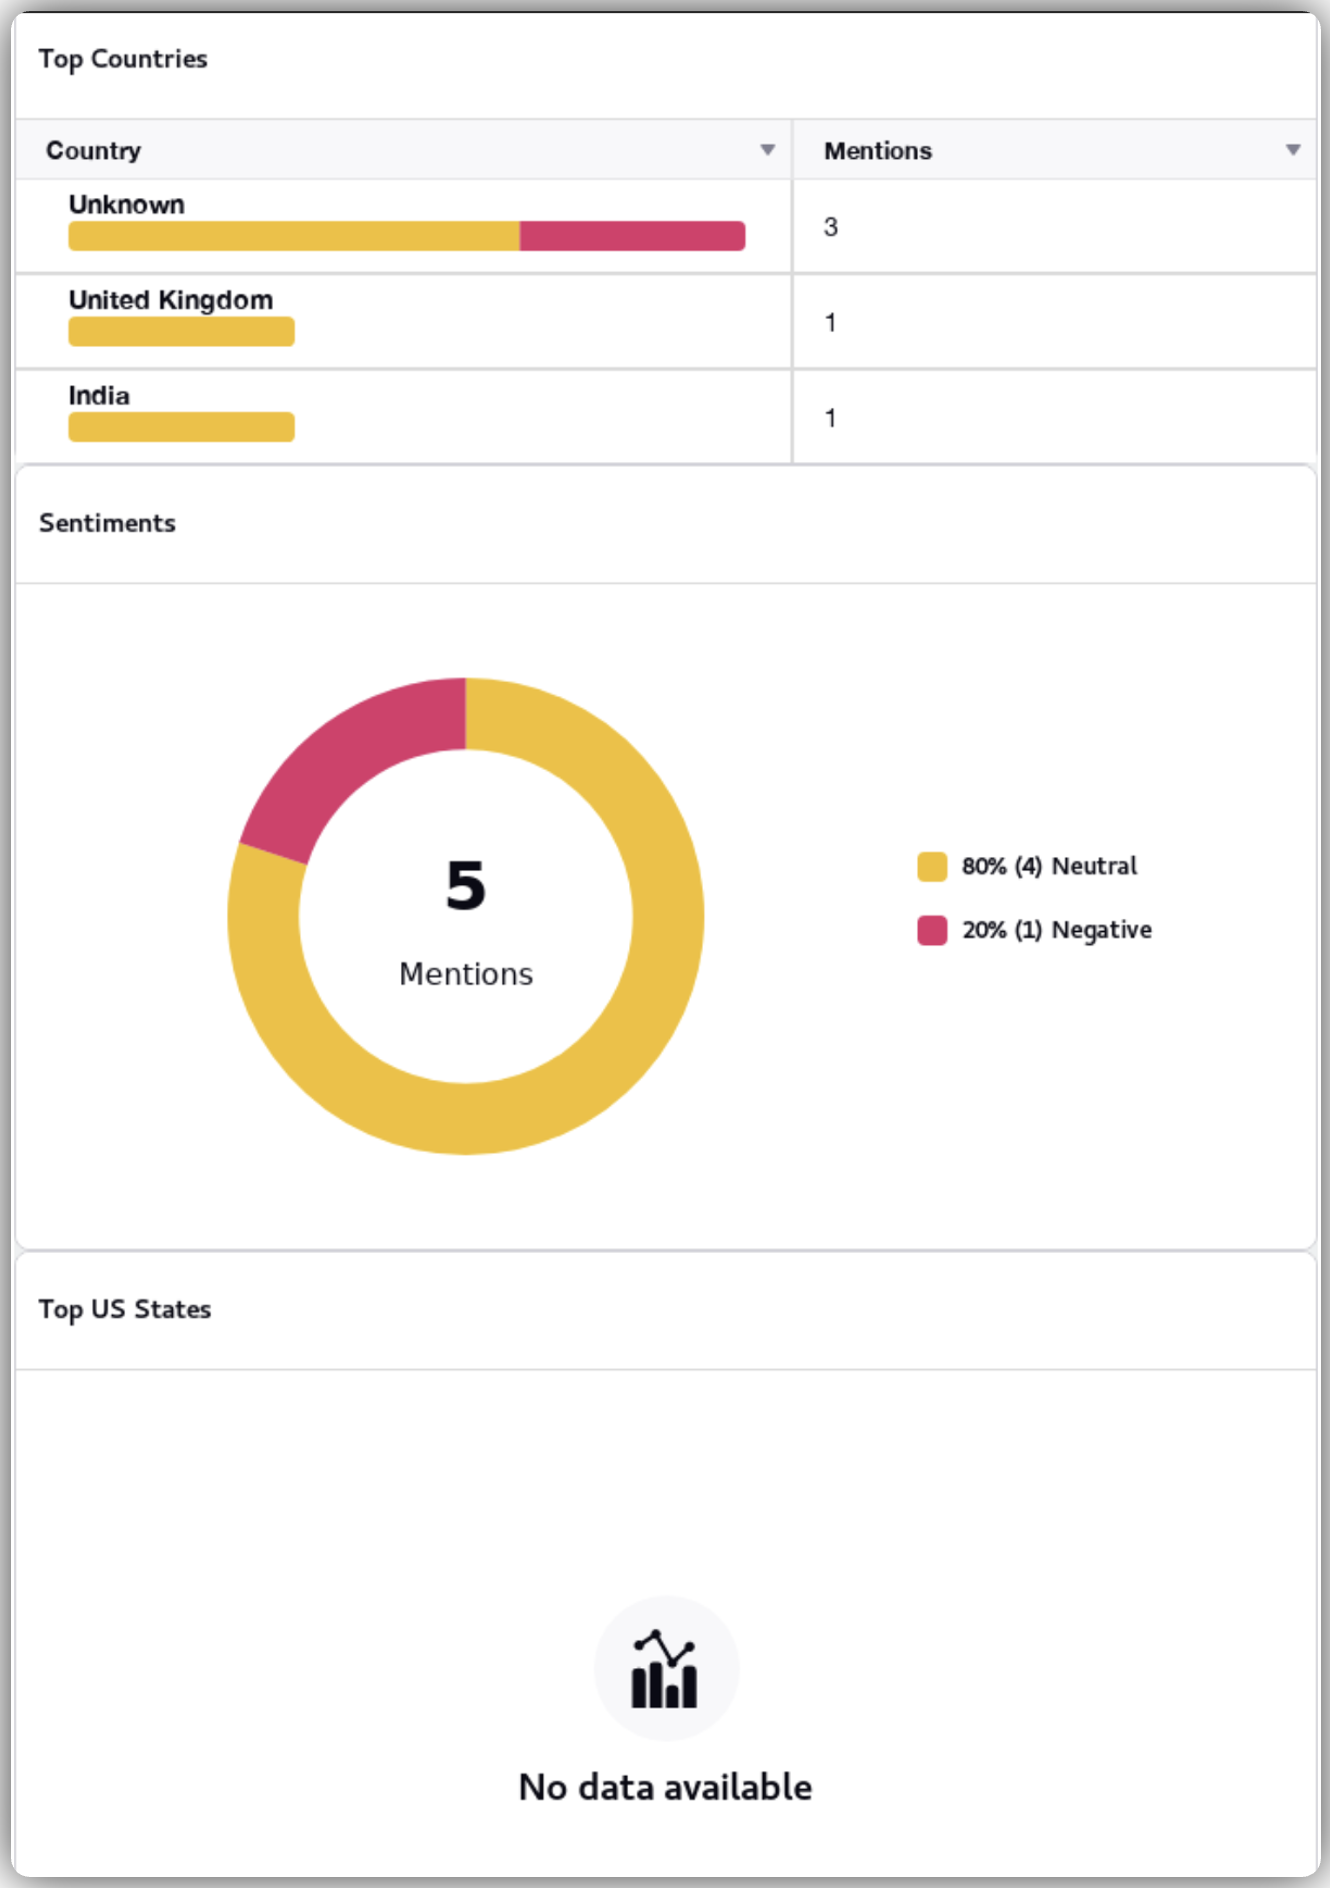
Introducing Advanced Survey Analytics
Reporting feeds for Surveys have been enhanced to improve the experience of analyzing survey results. Each survey question now includes one or more widgets that summarize results, ensuring quick and easy navigation. The data can be filtered and analyzed for specific time periods.
Furthermore, each question section is equipped with the ability to generate dynamic insights automatically. These insights include descriptive, correlational, trend and regression analyses, providing a more dynamic and comprehensive analysis experience without requiring any additional clicks.
User Benefits: This feature helps in extracting meaningful insights from survey data and enhancing the decision-making process.
The feature includes several analysis steps, types of analytics and statistical tests applied to various question types. Users can create visualizations, summarize data and derive insights from survey responses.
AI-powered Insight stream with drivers of customer sentiment, emerging themes, suggestions to improve sentiment, automated correlation and regression analysis.
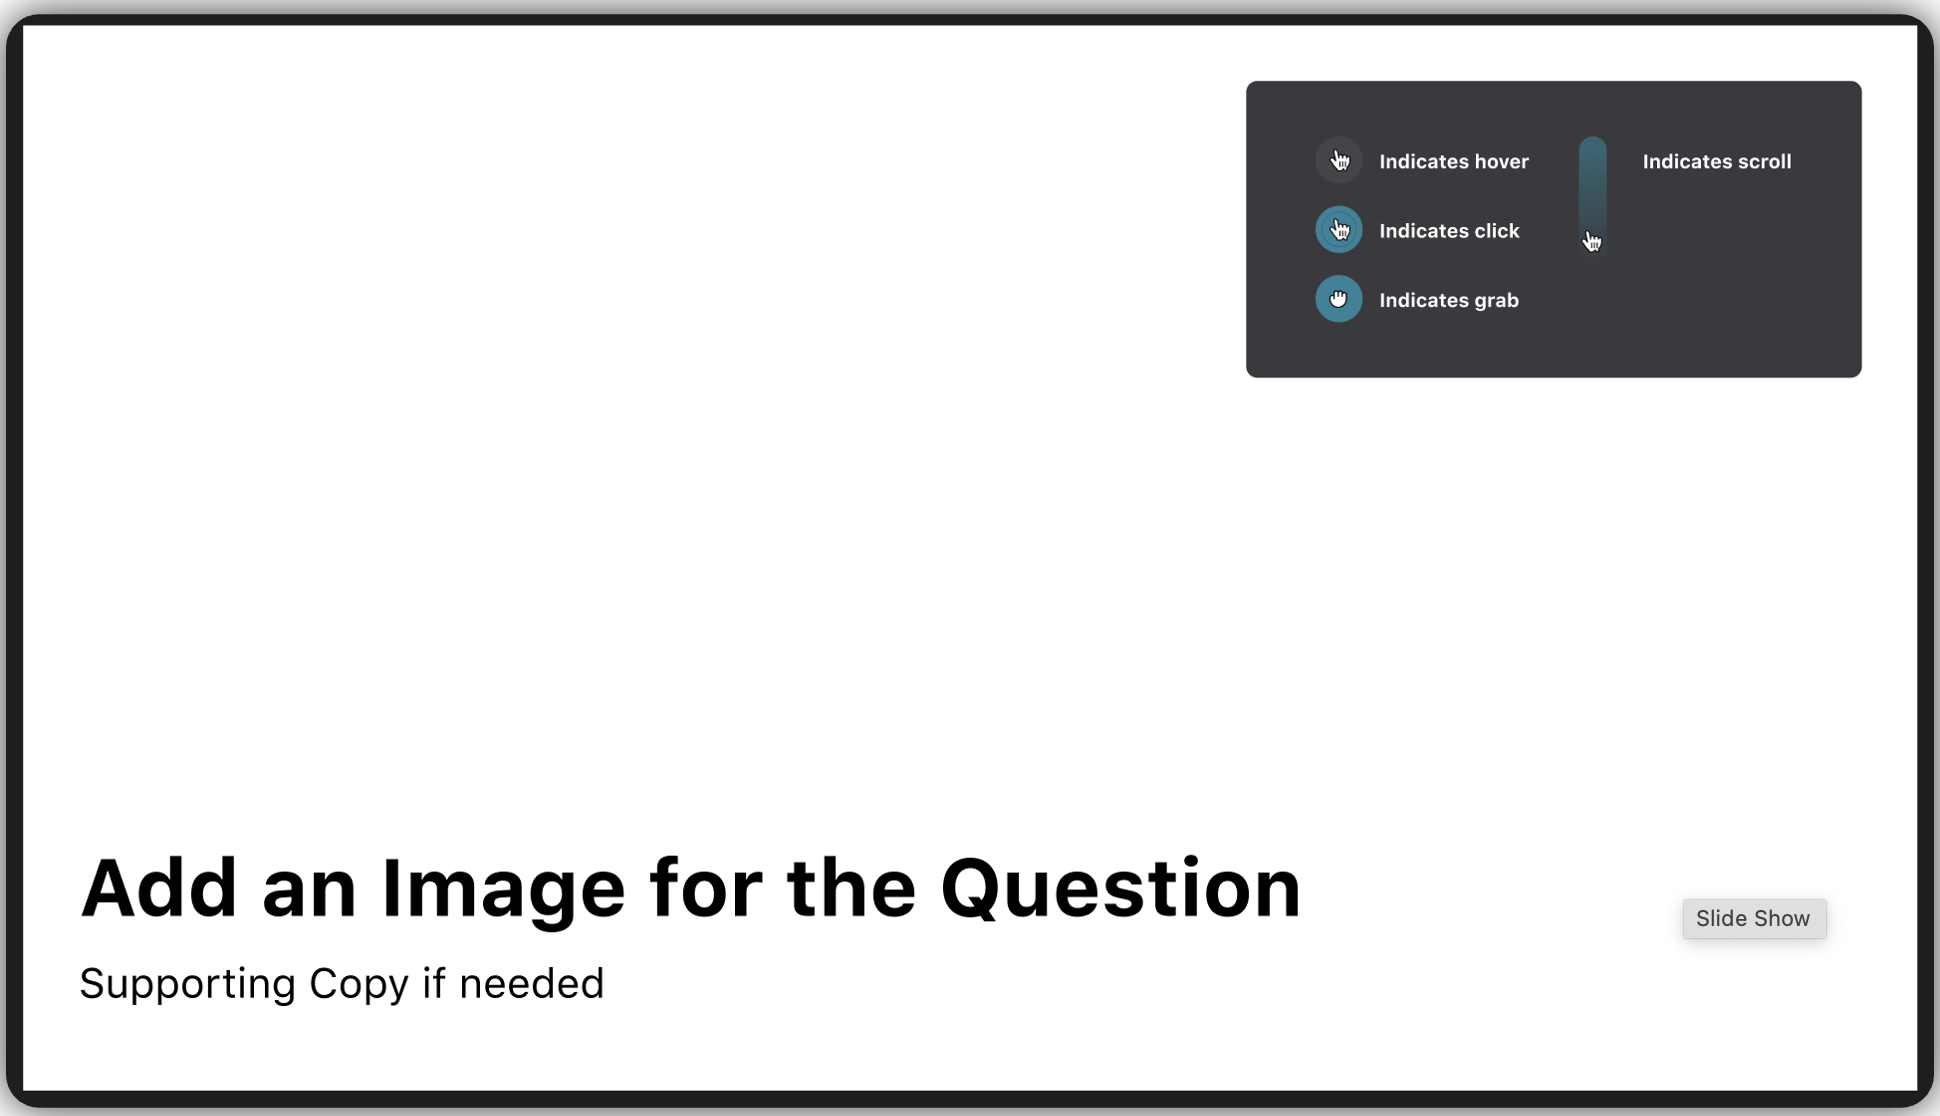
Survey Styling and Rich Media
Introducing Survey Styling and Rich Media
The Rich UX support for Surveys allows users to upgrade their surveys to presentation mode with the option to display one question per page.
This helps to enhance the look and feel of the survey and ensures better response rate. The user can also add images and videos to the survey questions to improve survey context and design.
The out of the box styling theme which is readily available helps users to select best suited combination of colours and styles to align with the brand elements.
Sprinklr Surveys helps to provide easy ways to switch between different layouts without loss of any configuration or settings.
User Benefits
Ensures better responses rate.
Benchmarking
Text Crowding Score
Metric to Reflect how clearly is the mention of brand visible in the posts
Calculate Text Crowding Score (Score out of 100):
It computes the number of text features surrounding the brand name/hashtag/link. More the number of text features around it, more the "crowding" - which would reduce visibility hence should reduce the score.
Computation follows:
Initial Score Allotted to each post = 30
Adjustments to the initial score:
1. Lengthy Text - >
a. Case 1: If length of the post > 240 characters --- Deduct 5 points
b. Case 2: If length of the post is </= 240 characters --- No change
2. Excessive Tags -> If tags > 5 --- Deduct 5 points
3. Lack of line breaks ->
Assuming there should be at least 1 line break for every 240 characters
Deduct Max(0, [Post length/240]-m)
Where m is the number of line breaks
4. Bulky words ->
If the Average word length of the post > 7 --- Deduct 5 points
Else --- No Change
So Inital score is calculated as:
30 – Length Text Adj – Excessive tags Adj – Line break Adj - Average word length
Finally this score is normalised to range it in 0-100.
Support for x.com profile url for Benchmarking Brands
We have updated our support for adding public brands in Benchmarking for Twitter. Previously, we only supported profile URLs from twitter.com. With Twitter's rebranding to X and the corresponding change in URLs to x.com, we now support both twitter.com and x.com URLs.
User Benefit:
Users can now add public brand profiles using either twitter.com or x.com URLs.
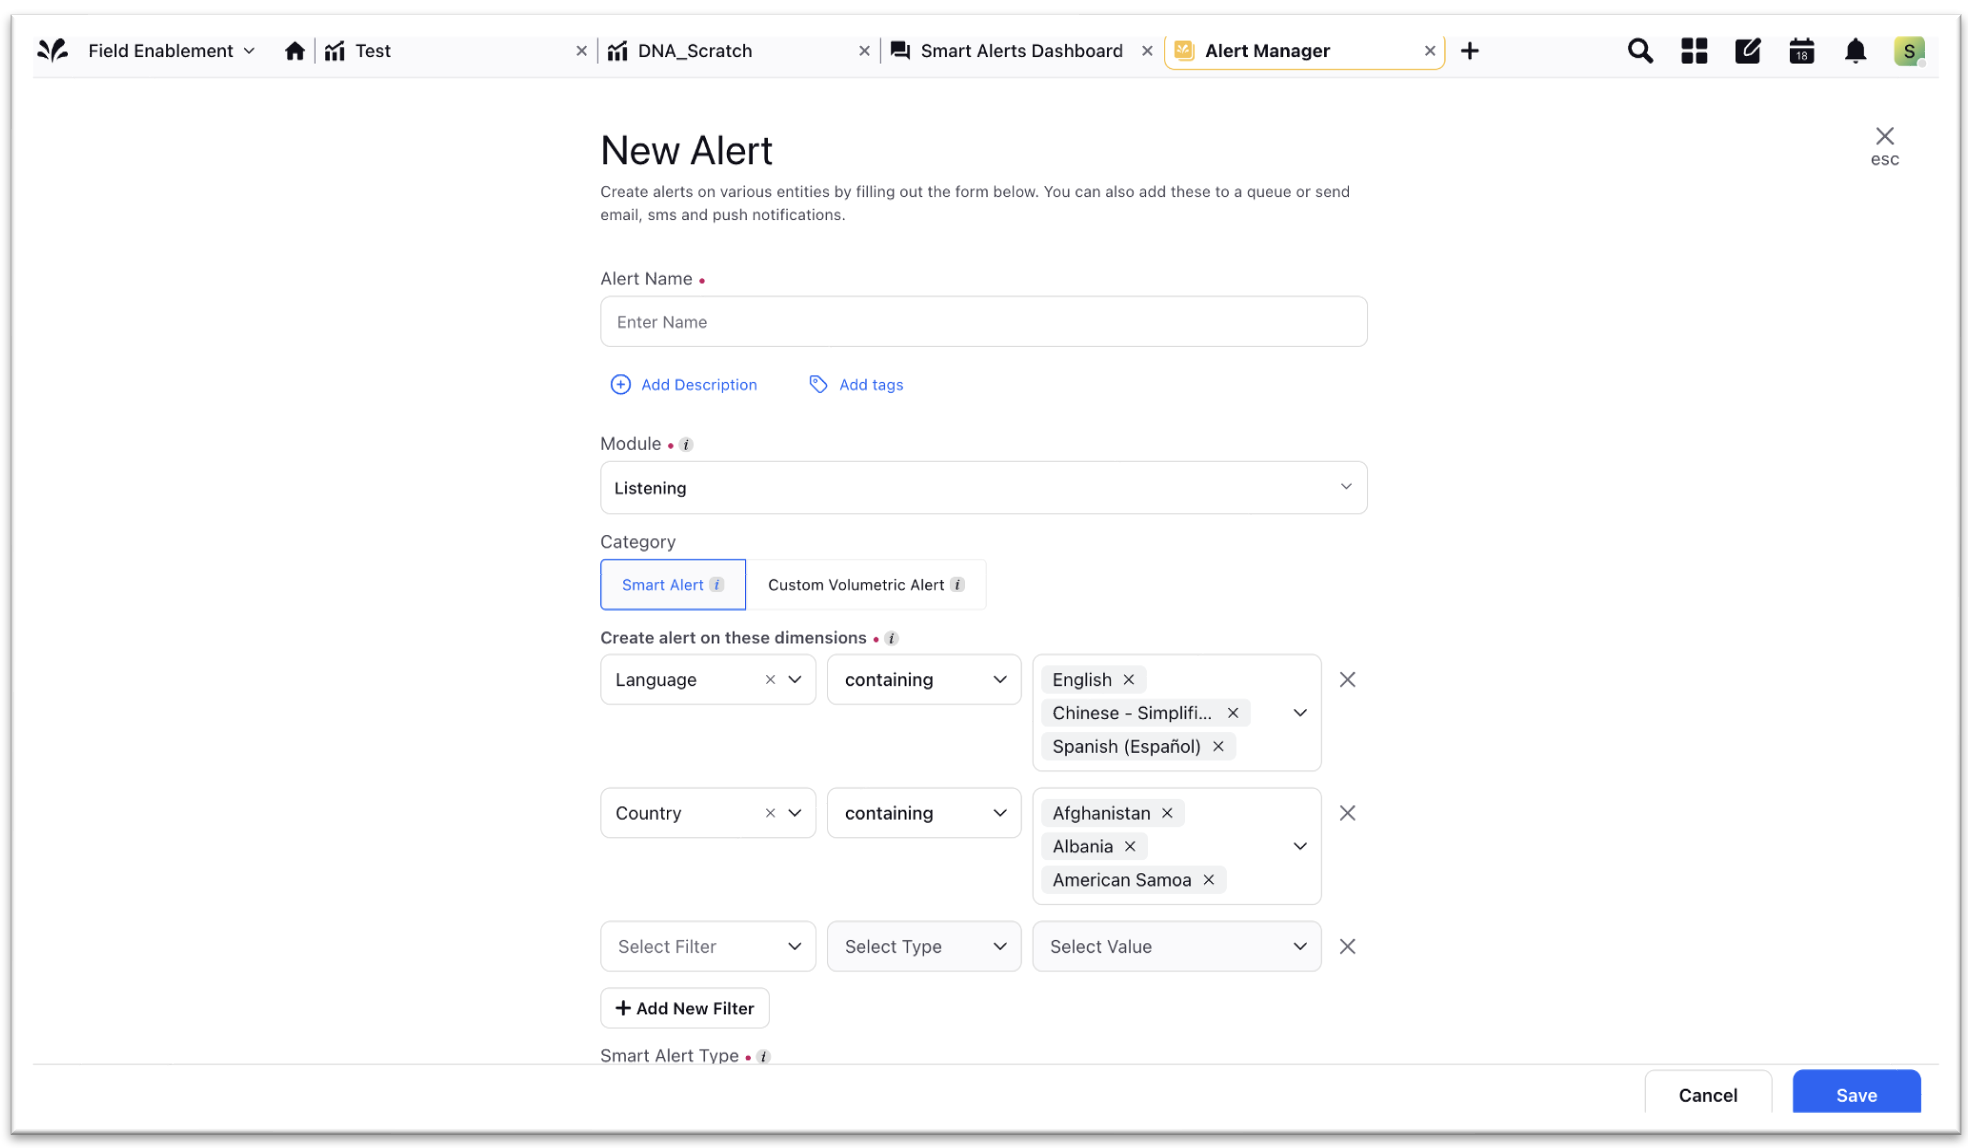
Alerting on Individual entities for custom fields
We have added the ability to allow users to set up alerts using combinations of individual entities for all custom fields. This enhancement will streamline the alert creation process for various custom dimensions, allowing them to be configured in a single setup and offering detailed insights on non-standard fields across the Sprinklr platform.
User Benefit:
Allows users to add multiple different custom fields in a single setup itself.
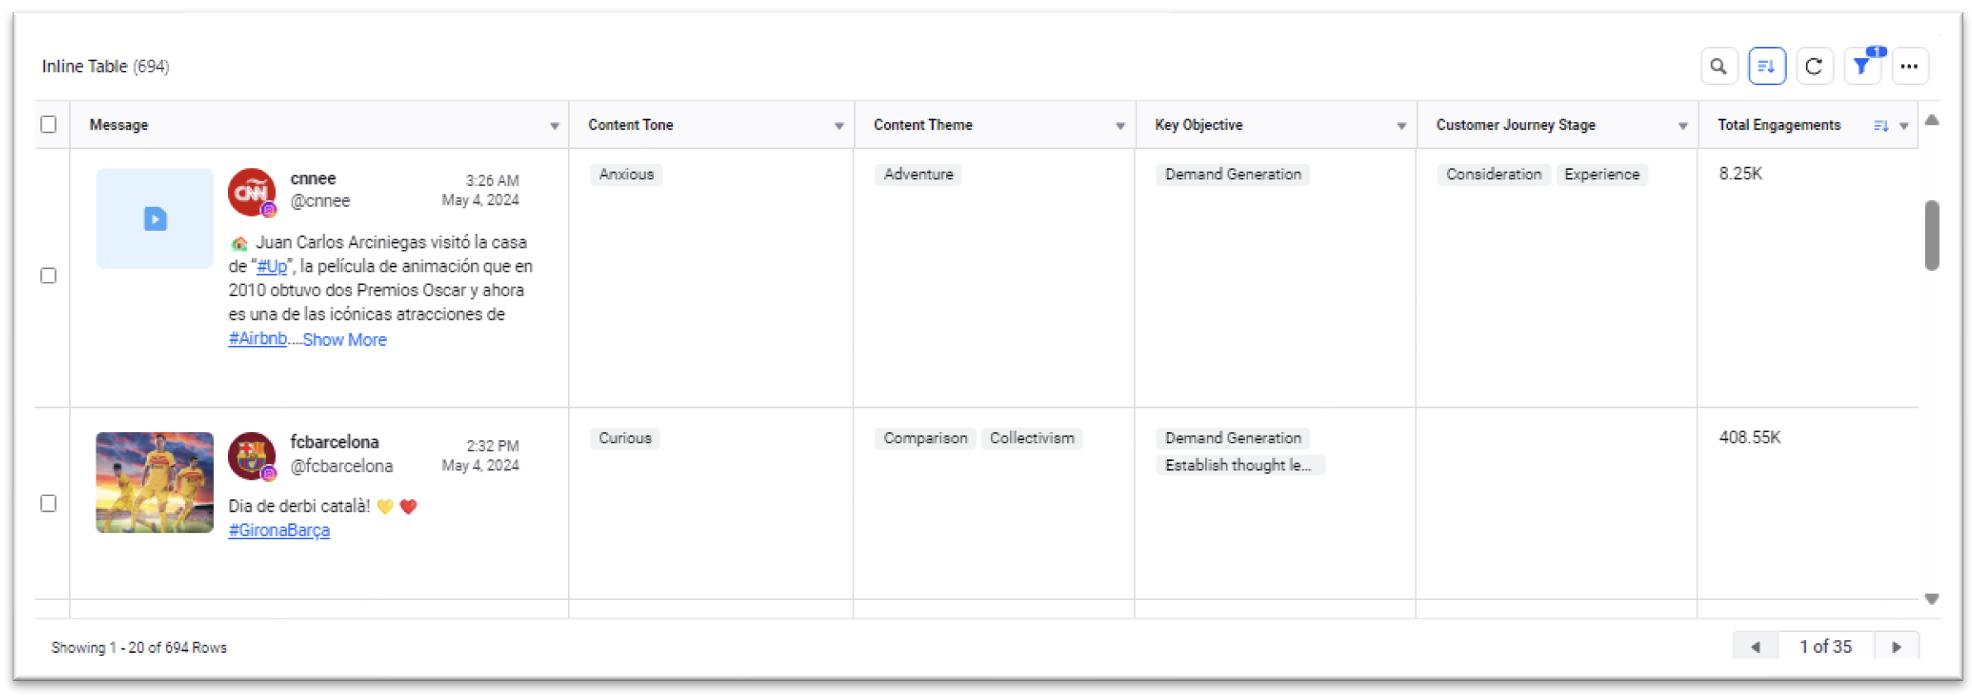
Support for Inline Editable Table Widget for Benchmarking
We have added support for AI-powered dimensions in our inline editable table visualization. These dimensions use Benchmarking data to categorize content tones, themes, key objectives, and customer journey stages for posts using our in-house LLM models.
A single post categorized with multiple content tones/themes/key objectives/customer journey stages will show these categories within a consolidated view in the inline table - the same way it is visible in the third pane. This ensures that multiple categories for all four AI models are shown together in one entry, instead of creating multiple entries.
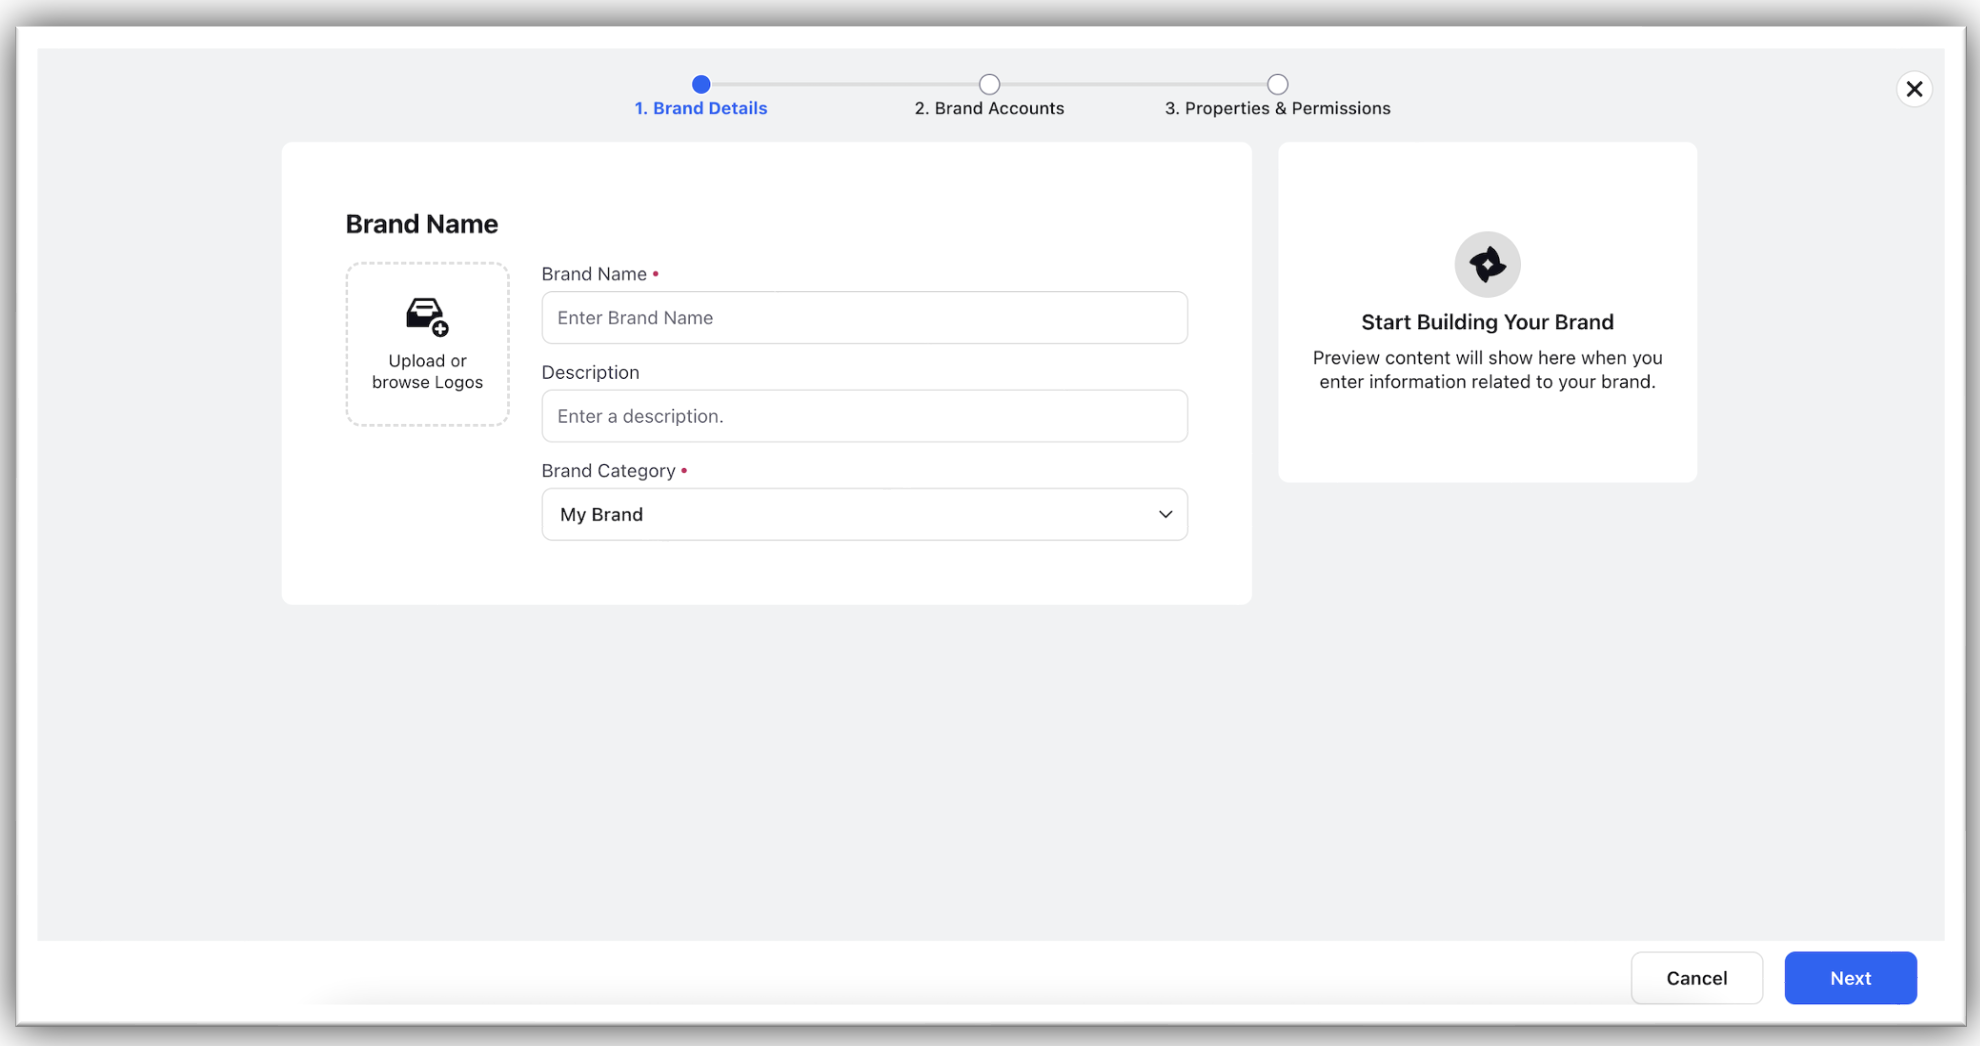
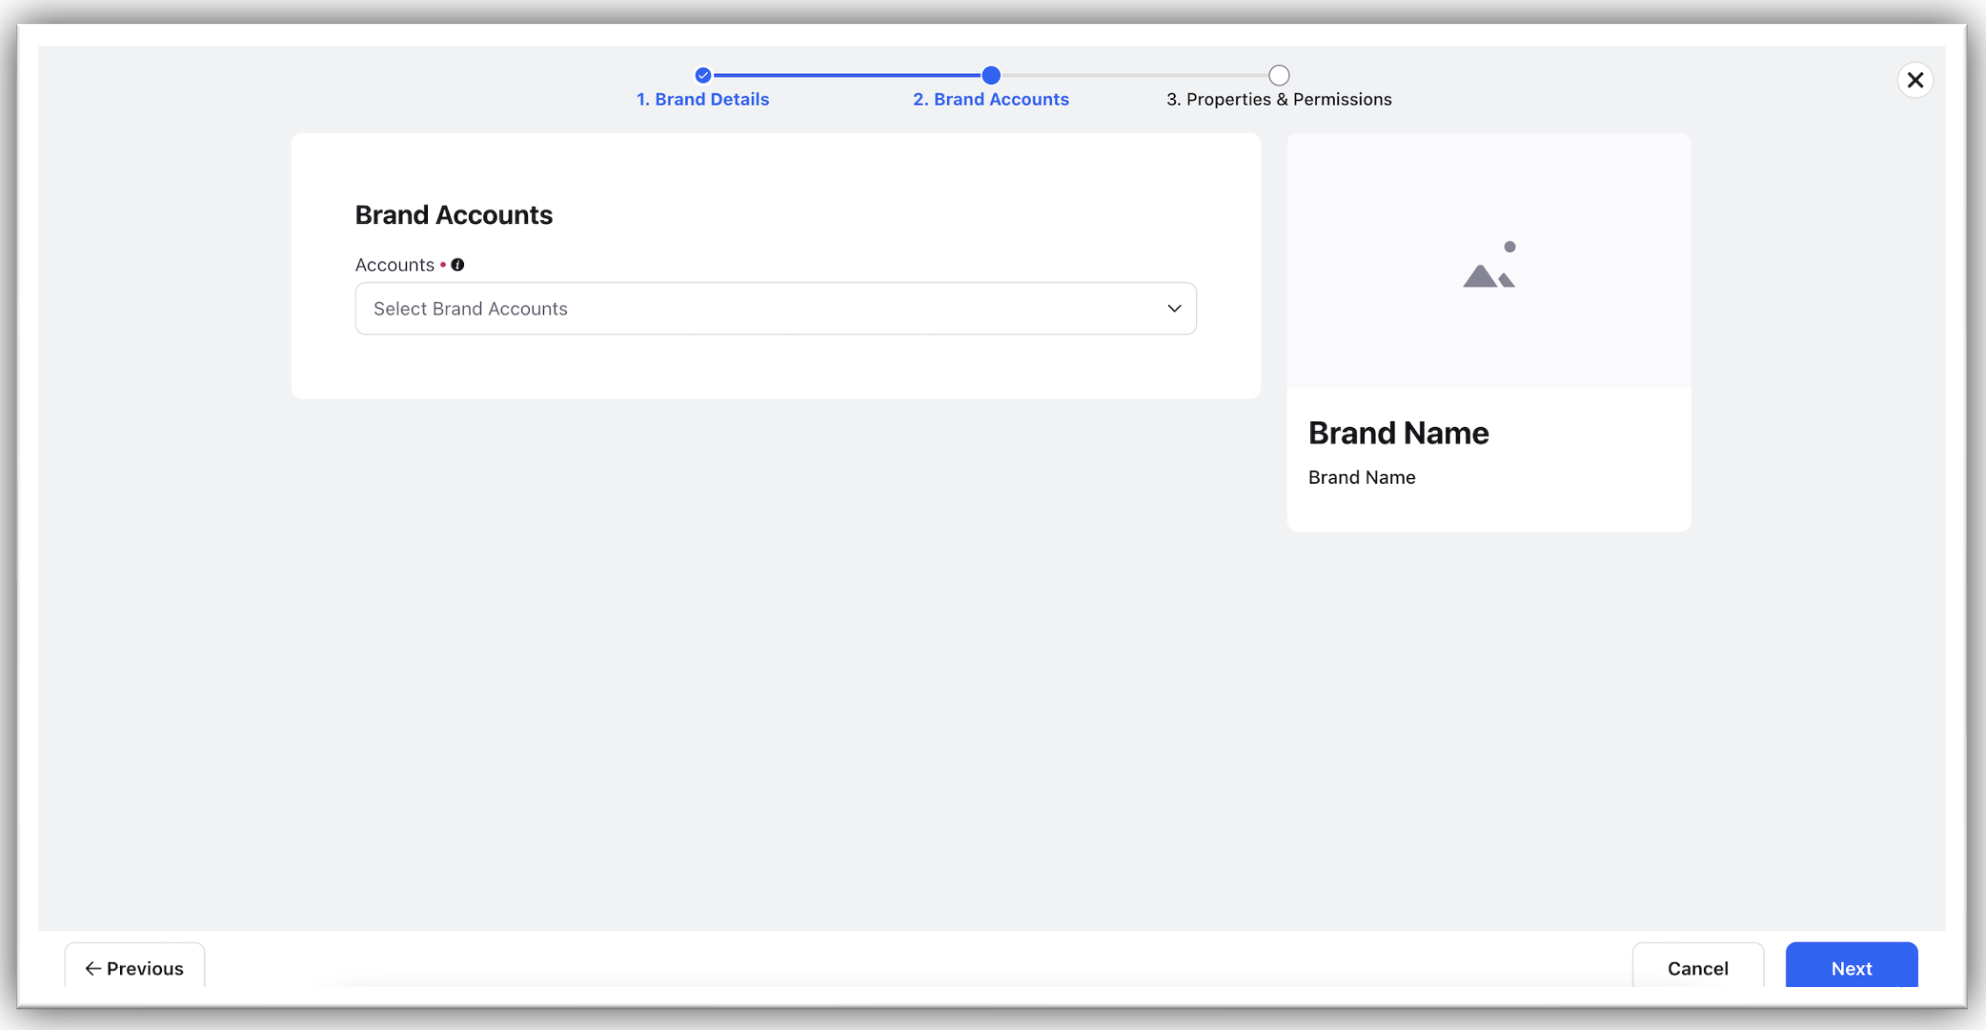
Brand Permissions for support for bulk import for Benchmarking Brands
Users can now configure brand visibility and add brand permissions for a large number of accounts directly within the bulk import template. This enhancement simplifies the process, enabling users to efficiently import and manage large volumes of accounts with the correct visibility and permissions settings.
Key Details
Bulk Import: Import multiple brands using a predefined template.
Permissions Sheet: The template includes a second sheet for permissions with the headers: Brand, Share Level (User/User Group/Workspace/Workspace Group), Shared With, and Permissions (All/View).
Comma-Separated Values: For multiple entries, use comma separation.
How It Works
Template: Use the provided template with two sheets: one for brands and one for permissions.
Brand Details: List brands in the first sheet.
Set Permissions: Specify permissions in the second sheet.
Import: Upload the template to import brands and set permissions simultaneously.
User Benefits:
Time-Saving: Set permissions for all brands during the import process, rather than manually after the import.
Ease of Use: Simplifies the management of brand permissions.
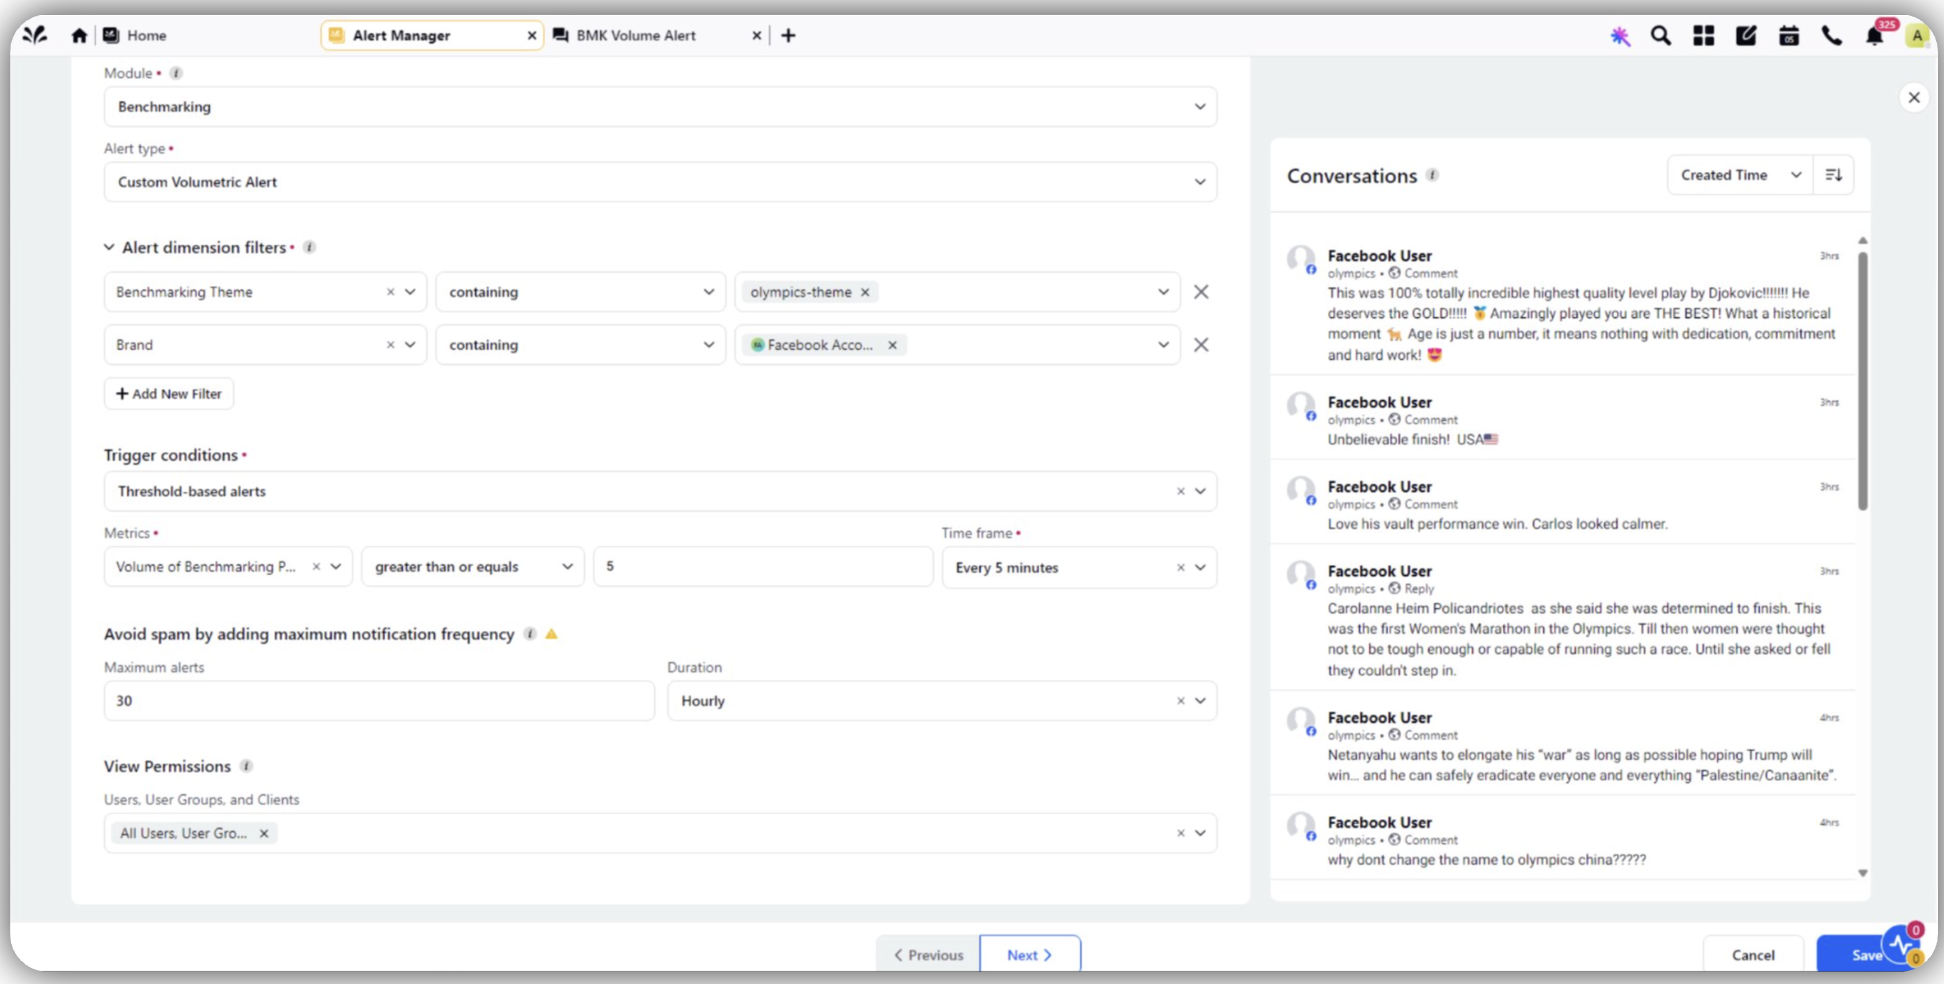
BMK Custom Volumetric alerts - Support of Themes in Volumetric Alerts
Theme Integration: Benchmarking themes can now be included in alerts using theme tags or direct theme selection.
Alerts are redefined and will trigger based on criteria that includes specified themes, providing more precise notifications.
User Benefits
Targeted Alerts: Receive alerts specific to chosen themes, enhancing relevance.
Better Precision: Alerts are more accurate by incorporating theme-based criteria.
Improved design of ClipBoards
Clipbooks can be accessed from Media insights, listening and reporting dashboards via the snack bar upon selecting the particular messages that are required to be exported as clips(i.e. separate PDF for separate messages and all compiled in a single zip file). The clips created within these new exports contain key metrics associated with each article along with the URL, domain and other message-level dimensions. It is currently supported with a stream widget and inline editable widget.
User Benefits:
Articles can be exported in zip file and all the articles selected would in the form of a separate PDFs.
Product Insights
Product Level Data Source Enhancement
This feature helps to get granular insights on product level meta data. This feature provides pivoting capabilities to each products native review count allowing users to analyze Native Review Count data basis different hierarchical levels: Product, Country, Domain and URL.
User Benefits:
1. Provides users with more flexibility in analyzing Native Review Count data.
2. Enables more detailed and granular analysis of Native Review Count at different levels of the product hierarchy.
3. Helps users identify trends and patterns in Native Reveiw Count data more effectively.
Product level data source
This feature provides ability to plot and drill down on Domains and URLs as dimesnions within product data sources as enabled.
The functionality primarly facilitates the visualization of star ratings and reviews at the URL and domain level, in addition to the existing product level.
Insights Assistant Enhancements
Insights Assistant has been enhanced to provides the ability to see the trends generated on weekly basis. Users should also be able to see low performing product insights on a weekly basis.
Deprecated DPs and APIs
FOLDERS_ENABLED DP
Dependency on DP is removed to enable folder and now folders can be enabled by default.
HYPERSPACE_WIDGETS_ENABLED
Helped in increasing the lines usablity for better representation of data. It controls major charts except Table and Postcard. The DP is deprecated and older version of functionality is removed.
HYPERSPACE_TABLE_WIDGET_ENABLED
This has improved the appearance and usability of Table visulization of the widget.The DP is depreciated and older version of the functionality is removed.
Listening Scheduled Reports Email
Listening Scheduled Report Emails used Google Charts API to generate charts which is deprecated. Now the API provider is changed and Emails are moved to MJML templates.