Tooltips & Floating Reporting Glossary
Updated
Floating Reporting Glossary
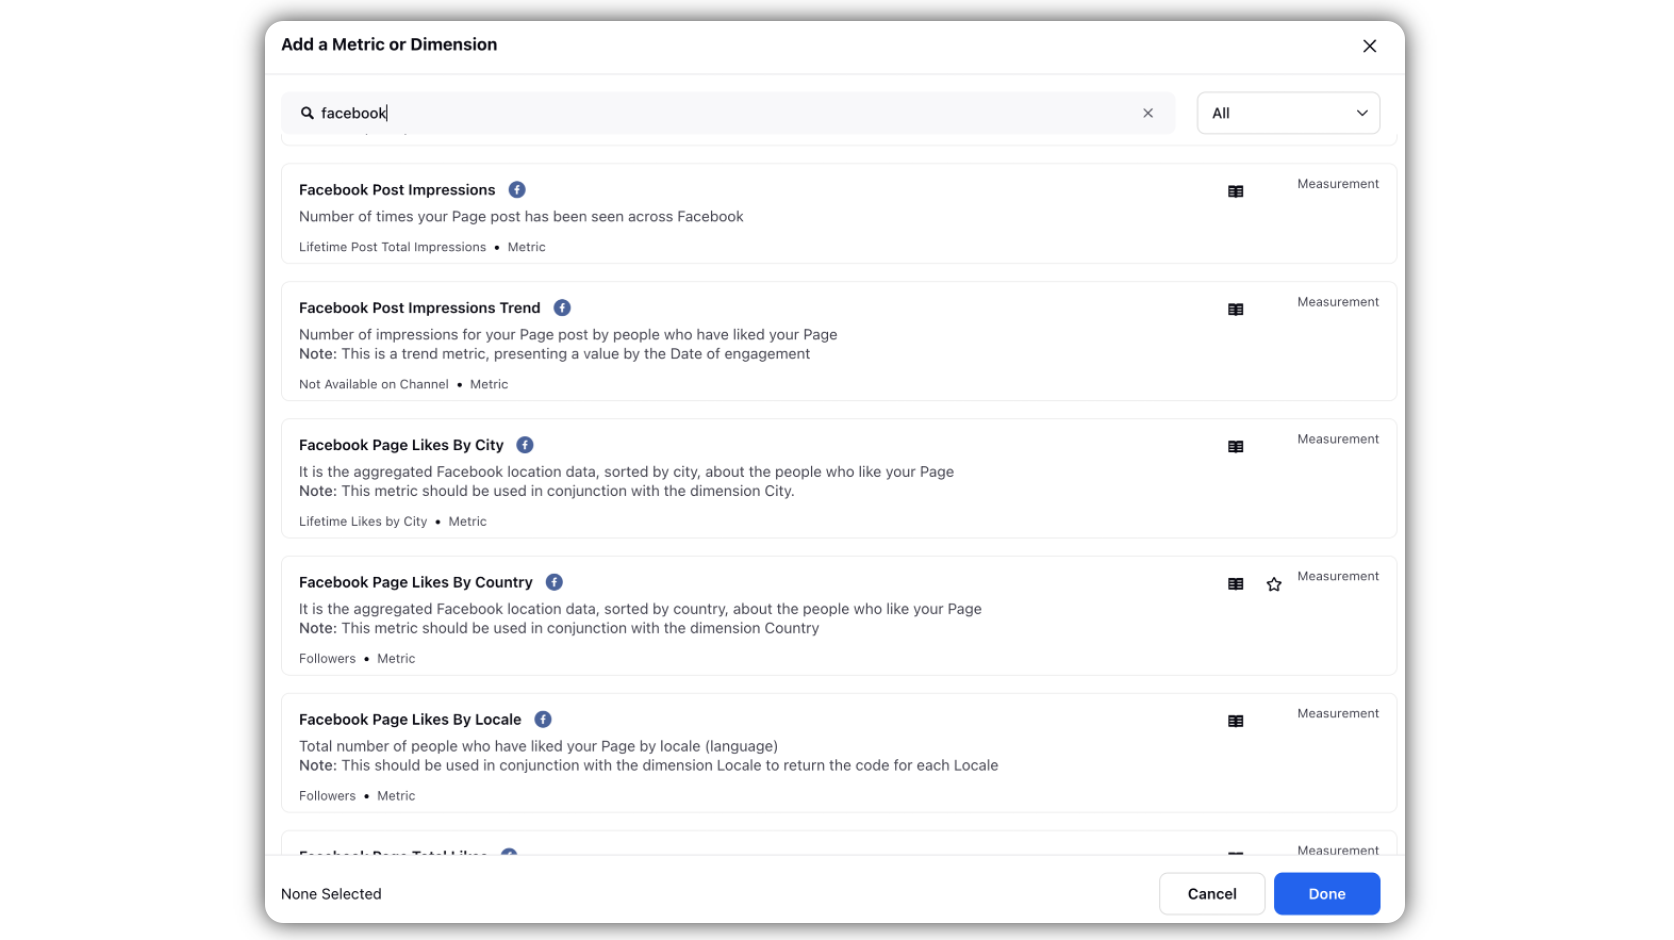
While creating a widget, you can view details related to the metrics/dimensions in the platform itself. These details include not only the description, but also which metric to compare with in native analytics, and if it's paid/organic/total. This will serve as a floating reporting glossary for you. Currently, this is only supported for all custom metrics and custom fields in the reporting glossary.

Tooltips in Reporting Widgets
You can view Metric/dimension details when you hover over their names in a reporting widget.
Supported Widget Types
Bar Chart
Column Chart
Counter
Dual Axes Chart
Line Chart
Percentage Area Chart
Table
Combination Chart
Currently, this is only supported for the Social Analytics data source, and the top used 300 metrics/dimensions in this source. Support for all other metrics will be rolled out soon.
.png)