Survey Analytics Overview
Updated
The Analytics Module provides a robust set of tools designed to analyze survey data across various use cases and organizational hierarchies. It includes:
Standard Analytics Feed: An auto-generated report offering quick survey insights, powered by AI for hypothesis validation and text analytics.
Custom Reporting: A flexible solution for creating customized dashboards, enabling targeted analysis and comparison of key metrics across different dimensions.
Hierarchical Reporting: Survey data organized according to organizational hierarchies, providing relevant insights for teams at all levels.
This module ensures you can efficiently derive actionable insights, prioritize improvements, and align feedback with business objectives.
Business Use Cases
Strategic Feedback Monitoring Across Hierarchies: To gain a unified view of feedback across multiple locations for trend analysis and initiative evaluation, hierarchical reporting can be leveraged. It organizes feedback by organization, region, and location, delivering high-level insights and uncovering recurring issues. These insights help prioritize investments and drive improvements in overall satisfaction.
Custom Insights for Segment Analysis: Custom reporting can create tailored dashboards to analyze feedback based on various factors like industry, usage, and NPS. These insights help align features with your needs, improving customer satisfaction and adoption.
Quick Campaign Feedback for Marketing: The Standard Analytics feed helps them gain AI-powered insights, such as recurring feedback themes and text analysis, that help refine future campaigns and improve engagement and ROI.
The analytics suite offers a comprehensive approach to turning survey data into actionable insights, with three powerful tools working in tandem. The Standard Analytics Feed provides effortless insights through automatically generated reports, reducing manual effort and streamlining analysis. It also includes AI-driven intelligence, such as text analytics and hypothesis validation, to enable smarter, faster decision-making. For more specific needs, Custom Reporting offers tailored flexibility, allowing you to create personalized dashboards that align with your analytical goals, and deliver focused insights by comparing trends across different segments. Meanwhile, Hierarchical Reporting ensures organizational alignment by structuring survey data according to your company hierarchy, delivering relevant insights at every level. It also offers simplified maintenance, with the ability to manage hierarchy data easily using Excel or CSV files. Together, these tools ensure your survey data is not only accessible and actionable, but also aligned with business goals, making them a vital part of any customer feedback strategy.
Prerequisites
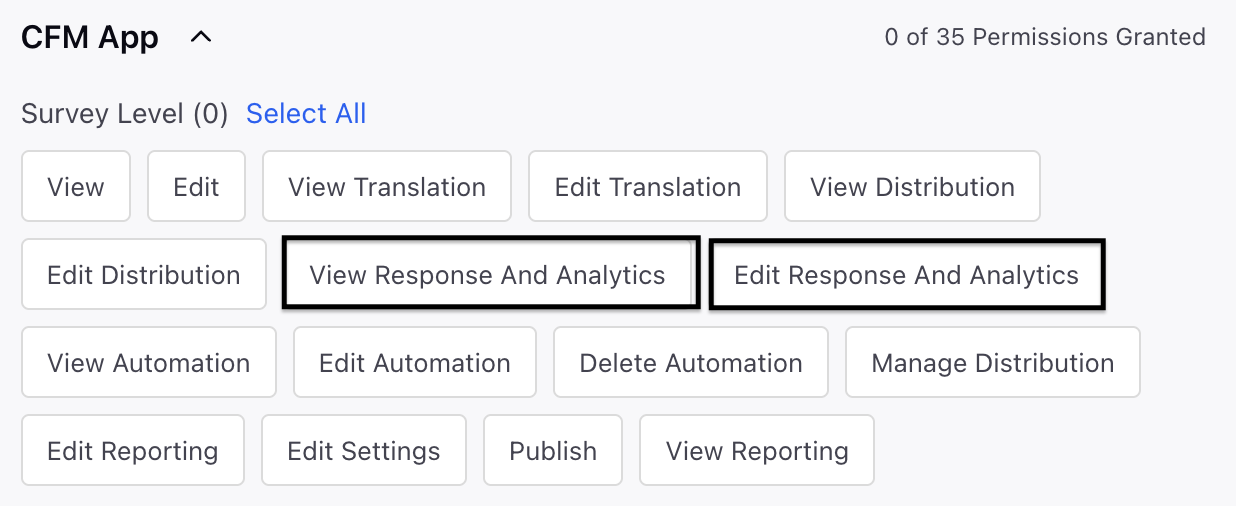
In order to have access to Survey Analytics you need to have View and Edit permissions for both Response and Analytics of the survey.
