Analyze Conversation Insights Report
Updated
Learn how to analyze your Conversation Cluster report in Conversation Insights.
After successfully creating a conversation cluster report in Conversation Insights, it will move to in-progress status. On average, it will take 45-60 minutes for the report to be ready once submitted, depending on the size of the conversation input. Once the report is successfully completed, you will receive a push notification, and you are ready to analyze your report.
Note:
Conversation Insights is available on the Sprinklr platform for all Sprinklr Insights customers and users. For more information, see – Availability of Conversation Insights.
We have a limit of up to 100 reports per customer environment, i.e. each customer can create up to 100 Conversation Insights reports.
To do that, go to Conversation Insights Manager, and click the View Report button next to the report you want to analyze. This will open the conversation clusters report consisting of the conversation cluster map and a separate pane on the right side of the screen for quick insights.
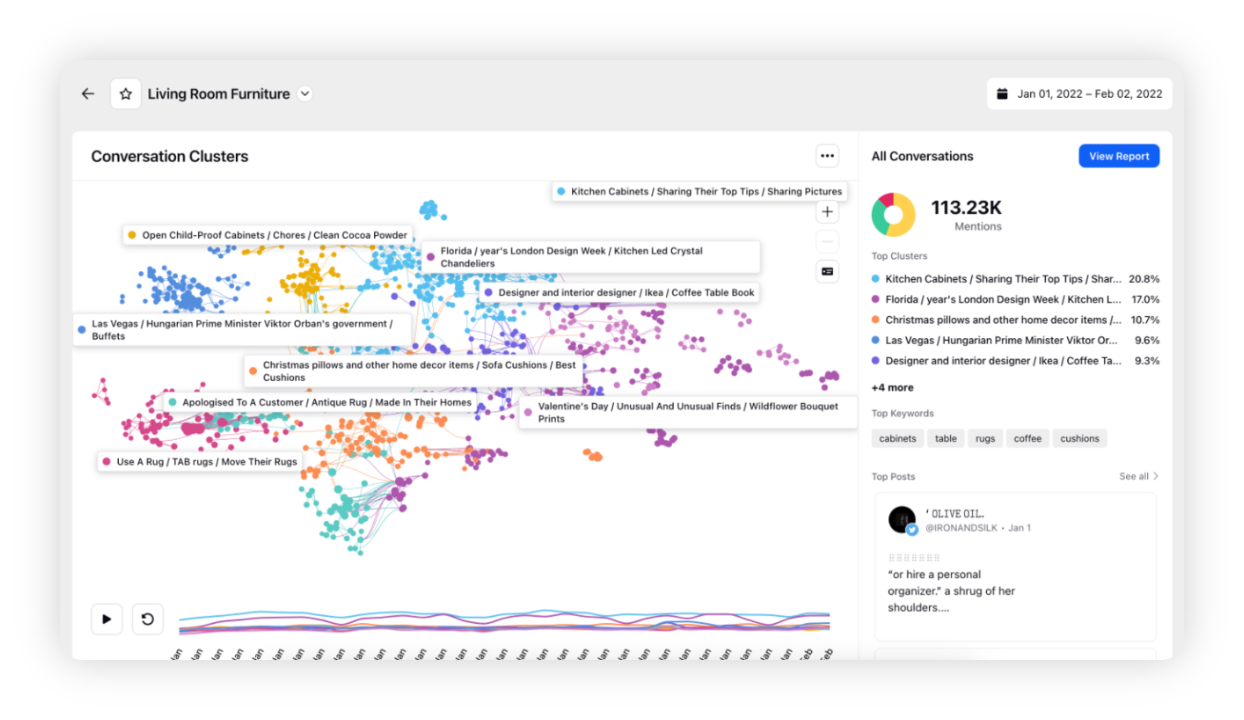
The graph widget contains clusters of messages – denoted by the label names and their relationships with other clusters shown by the edges connecting them. The right-pane consists of top-level insights about the overall conversation or the cluster selected – Top clusters/Top Sub-clusters, Top Keywords used in the conversation, and Top Posts.
Note:
You can hover & click on the cluster names listed on the right pane.
Top posts shown are in descending order of created time
AI behind Conversation Clusters
Data from Sprinklr’s global database is ingested, and pre-processing and filtering are done.
Unsupervised clustering techniques are used which group similar conversations together.
Network visualization of conversational clusters is generated –
Each node in the graph represents an individual mention and the edge between nodes represents the semantic similarity between mentions.
Clusters at the center of the visualization are better connected to the rest of the clusters.
Clusters at the periphery represent niche conversations.
Cluster Titles: Most relevant entities/keywords occurring within a particular cluster are considered for the title.
Sub-cluster Titles: AI-summarization techniques are used to generate more granular titles.
Sampling logic
There would be a difference between the volume ingested and the total volume that has been clustered as Twitter Retweets are not considered. Additionally, messages detected as spam and profanity are removed before generating clusters which can also lead to difference in the mention counts.
In addition to the above, following sampling is carried out to retain just the important nodes from each cluster (~1k). The algorithm used is –
The number of nodes selected from each cluster is proportional to the actual volume of the cluster in the original dataset.
Bridge nodes (nodes that connect 2 clusters) are selected first.
For selecting the remaining nodes, nodes are sorted in descending order of degree (number of interconnections), and then top nodes are used.
View report of clusters
You can also launch a deep-dive dashboard for any cluster from the right pane to get deeper insights into the conversation as well as the audience behind each cluster. You can launch the deep-dive dashboard for the overall conversation as well.
To launch the standard cluster deep-dive dashboard, click the View Report button in the top right corner.
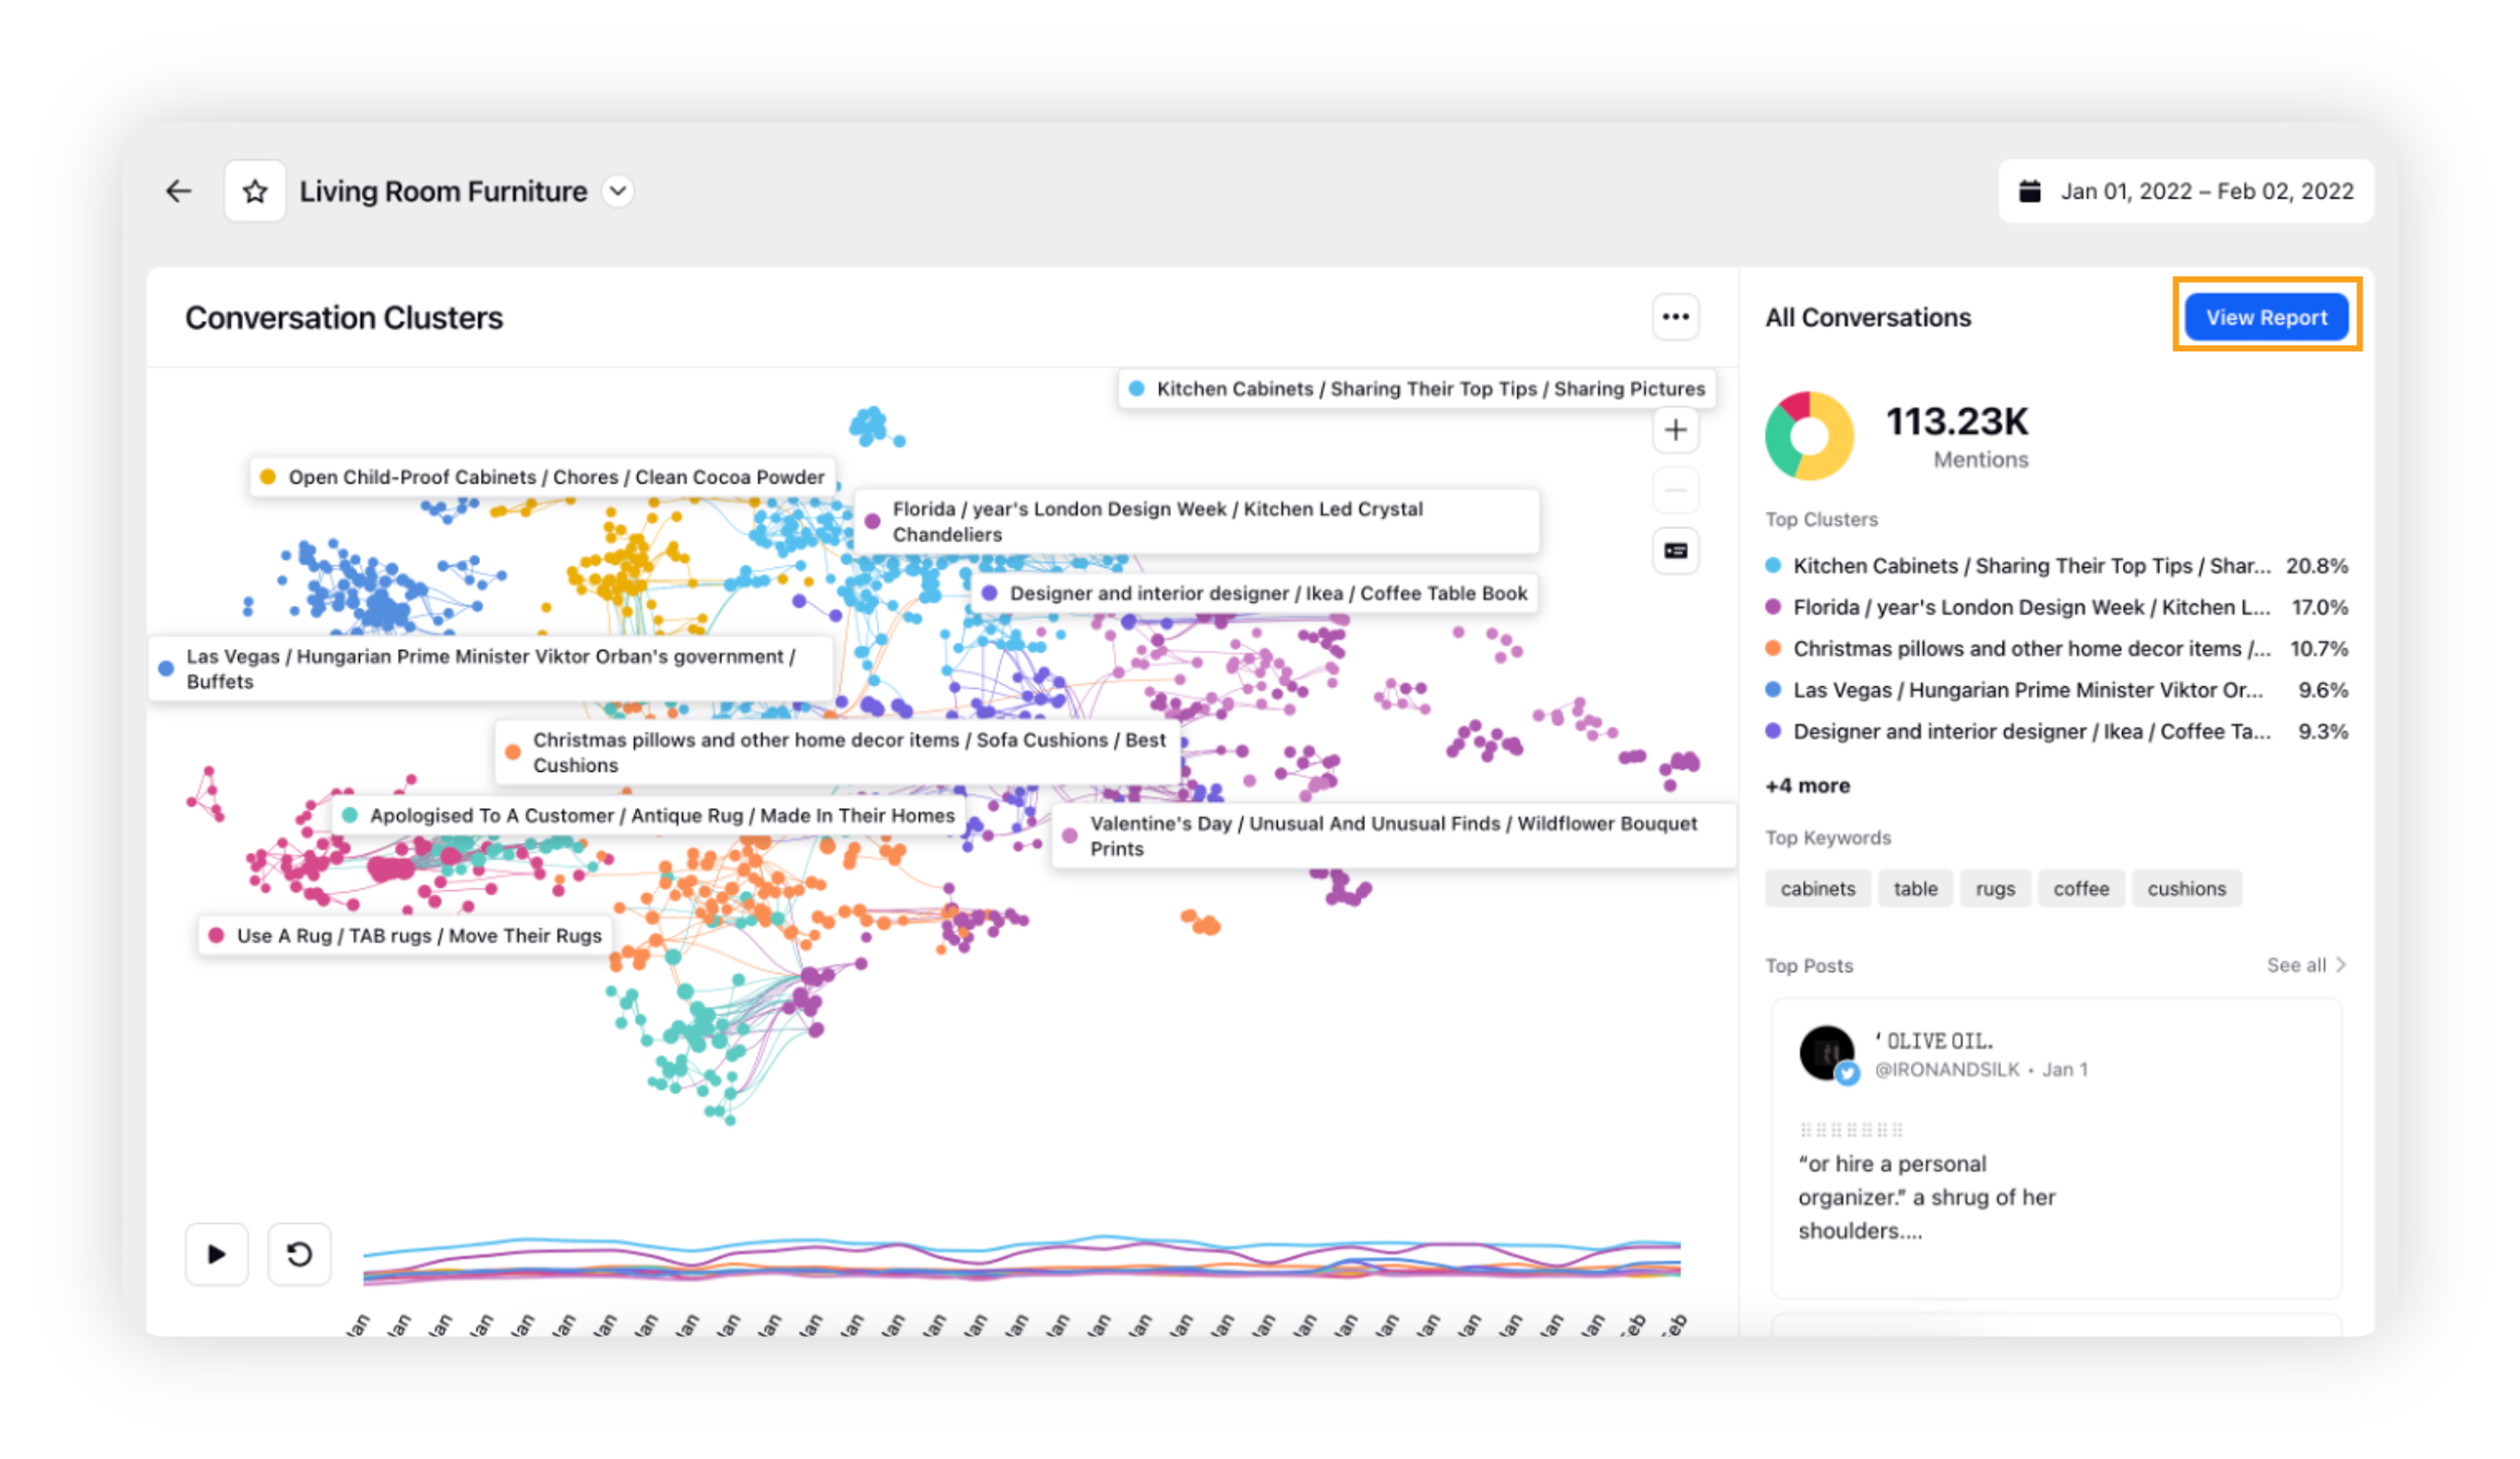
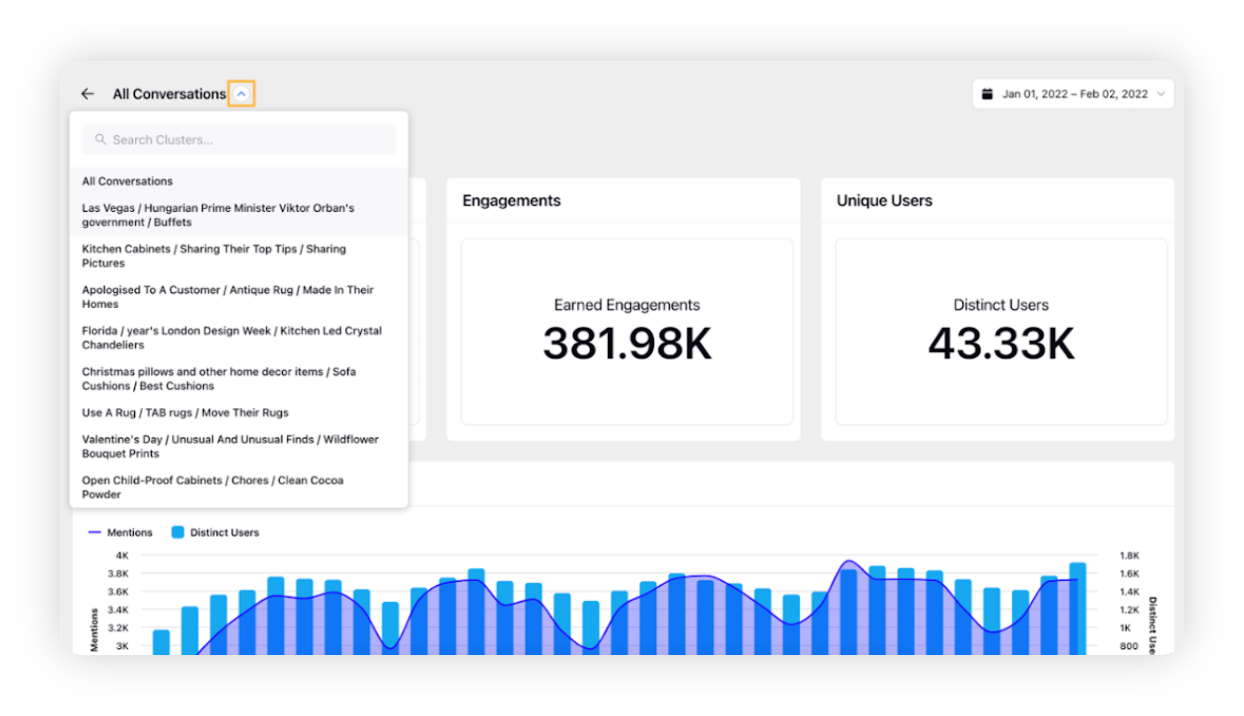
This will open the deep-dive dashboard where you can switch between clusters using the Dashboard Switcher (placed next to the title of the dashboard as shown in the screenshot).
Note: Cluster Deep-dive Dashboard is only available for first-level clusters & overall conversation.
The dashboard has 2 tabs: Overview and Cluster Comparisons along with drill-down capability.
Overview
The Overview tab within the dashboard contains top-level metrics for each cluster: Mentions, Engagements, and Unique Users. Other widgets of the tab include –
Trend Over Time: The trend of overall mentions & unique users throughout the time range of the report.
Sentiment Distribution: Distribution of positive, negative, and neutral mentions within each cluster or overall conversation.
Sentiment Trend: The trend of positive, negative, and neutral mentions over time within each cluster or overall conversation.
Top Emotions: Distribution of AI-identified emotions within each cluster or overall conversation.
Top Countries: Distribution of countries within each cluster or overall conversation.
Top Brands: Top brands mentioned in the messages for each cluster or overall conversation. This is detected using an in-house AI model.
Top Hashtags: Top hashtags mentioned in the messages for each cluster or overall conversation.
Top Keywords: Top keywords mentioned in the messages for each cluster or overall conversation.
Top Posts: Conversation stream of messages sorted by engagement for each cluster or overall conversation.
.gif)
Cluster Comparisons
The Cluster Comparisons tab will give insights and help you compare sub-clusters within the cluster that has been drilled down. The widgets included in this tab are –
Volume Distribution by Clusters: Share of voice by mentions across sub-clusters.
Mentions Trend by Clusters: The trend of mentions across time for all sub-clusters.
Sentiment Distribution: Distribution of positive, negative, and neutral mentions over time for each sub-cluster.
Top Emotions by Cluster: Distribution of emotions for each sub-cluster. This is detected using an in-house AI model.
Country Distribution: Distribution of countries within each sub-cluster.
Top Brands by Cluster: Top brands mentioned in the messages for each sub-cluster.
Gender Distribution by Cluster: Gender distribution of profiles associated with the messages for each sub-cluster.
Age distribution by Cluster: Age distribution of profiles associated with the messages for each sub-cluster.
.gif)
Ability to drill down
You can drill down on any data point in the dashboard by clicking on it. Doing this will open the third pane that contains the following widgets – Distribution by gender, Distribution by age, Distribution by country, Distribution by interests (AI-generated), Top influencers, and Top posts.
View report of subclusters
When you double-click a cluster on the widget, it will show you the subclusters. The Conversation Cluster graph shows a maximum of 15 statistically significant clusters upfront. The complete list of subclusters can be viewed separately within the All Subclusters tab of the deep-dive dashboard.
To view the complete list of subclusters of a cluster, simply double-click the cluster and then click the View Report button in the top right corner. This will open the deep-dive dashboard. Click the All Subclusters tab where you can view the complete list of subclusters. This is demonstrated by the GIF below –
.gif)
Note:
You can drill down on a data point to open the third pane to view demographic insights and conversation streams, similar to other widgets in the deep-dive dashboard.
Currently, the Top Influencers widget only supports profiles from Twitter.