Standard Care Dashboard
Updated
How Standard Care Reporting Dashboard helps supervisors or customer care managers track agent/team performance seamlessly on a single dashboard.
As a part of standardizing Care reporting, we have come up with the Standard Care Reporting Dashboard which consists of pre-configured widgets to get easy and relevant insights on key Care KPIs like SLA, Volume, Agent/Team performance, and Agent Availability along with the best visualizations.
Note:
|
Use cases of Standard Care Reporting Dashboard
Gain insights from agent- to team-level performance
Easily customize complex widgets with the help of detailed documentation
Add widgets/sections to any custom dashboard
View Agent/team productivity score table
Track % Occupancy & % Availability of an agent
View multiple variants of case handle time
The standard care reporting dashboard includes the following 4 tabs:
Volume - Case volume distribution by Channel, Issue Type Priority, Account, Team, Status, Time of Day, Sentiment, etc.
SLA - Case SLA reports on System SLA, Assignment SLA, Response SLA, Handle Time, Queue, and Macro SLA.
Agent Performance - Provides insights on agent productivity - their reply count, cases handled, macro usage count & productivity score, etc.
Agent Availability - Provides insights on the distribution of agent time in various statuses - their % availability & % occupancy.

Tab actions
Click the dropdown icon alongside the Tab Name to view the following options:
Edit: You can edit the tab name.
Delete: You can delete the tab with widgets or choose to move the widgets under a different tab.
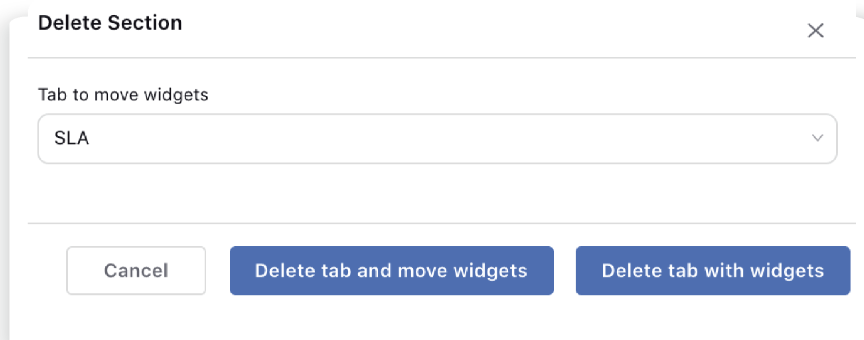
Add to Custom Dashboard: Add the tab with widgets to an existing or a new custom dashboard.
Change the Order: You can also change the order of the tabs by dragging and dropping.
Widget actions
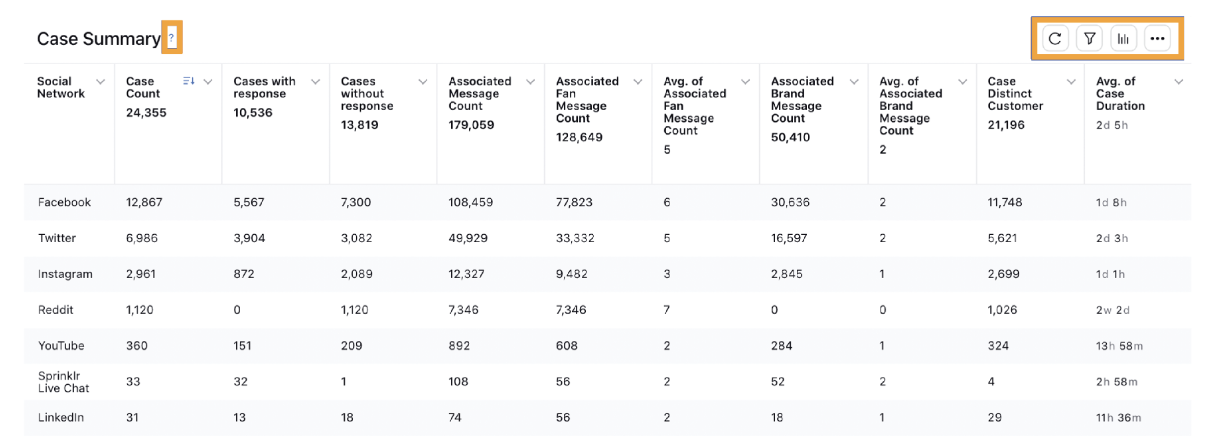
Information Icon : Click to read the widget description.
Refresh : Click to reload the widget.
Filters Applied : Click to view the applied filters.
Change Visualization : Click to change the visualization for your widget by selecting the preferred visualization type.
Options Icon : Click to view the following options: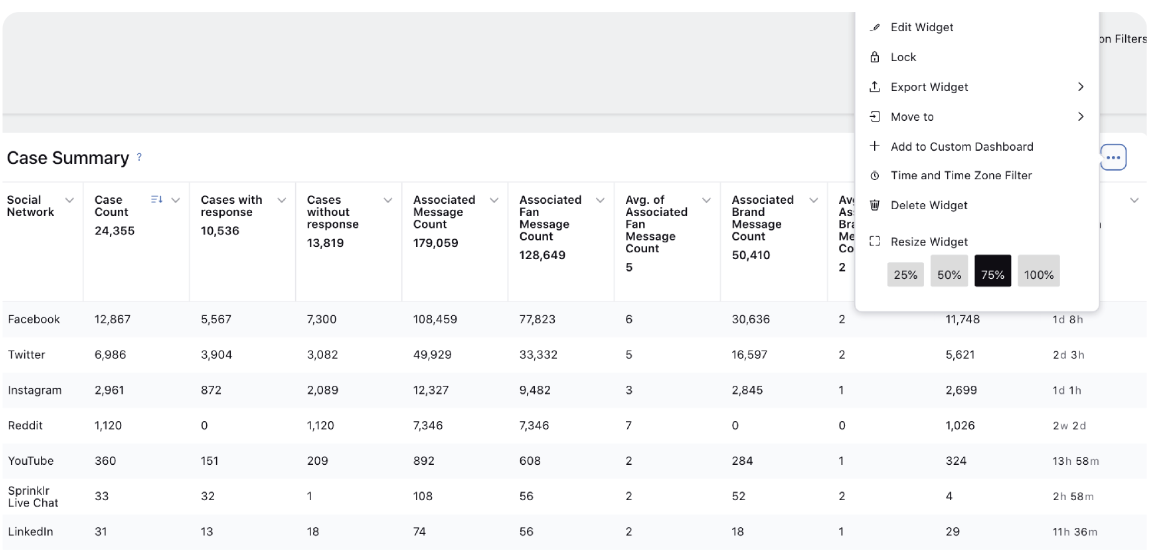
Edit Widget: Select to edit the configuration of a widget such as changing the metrics or adding new filters. Next, click Update Widget in the bottom right corner to save your widget.
Lock: Select to lock the widget in order to prevent changes from being made to the widget.
Export Widget: Select to export the widget as PDF, PNG, Excel, and CSV. Once your export is ready to download, you will be notified within the Notifications section on the navigation bar.
Move To: Move the widget into another tab of the report.
Add to Custom Dashboard: Select to clone your widget within the same dashboard or different dashboards.
Time and Time Zone Filter: Select to add an individual date range for the widget that will override the dashboard date range. You can also change the time zone for that date range.
Delete Widget: Select to permanently delete the widget.
Resize Widget: Select to resize the widget as required.
Drill Data: Drill down is a feature that lets the user analyze more specific data points in a widget. It gives the user an in-depth view of a selected metric in one click, keeping the original widget accessible at all times. To use the Drill Data capability, click on a specific data point on a widget. This will open the Drill Data popup window. Choose one of the metrics to drill into. (Suppose, Message Type is chosen.)
The new drill-down widget will appear in a new overlay window along with the original widget. The additional widgets that are produced from the drill-downs can be added to a dashboard by clicking + Add to Dashboard in the top right corner of the overlay window.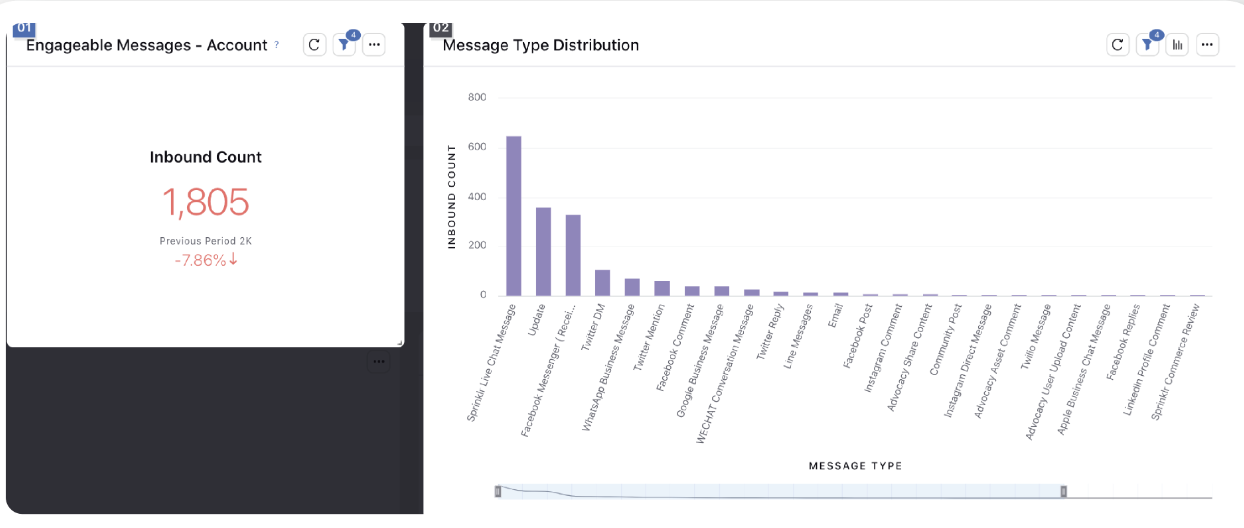
Standard Care Reporting Dashboard
In addition to the standard dashboard features, the Standard Care Reporting dashboard offers a number of default widgets.
Volume
Case Volume Report - Case volume distribution by Engagement, Channel, Account, Team, Status, Time of Day, Sentiment, etc.
The standard widgets available in the Volume tab are:
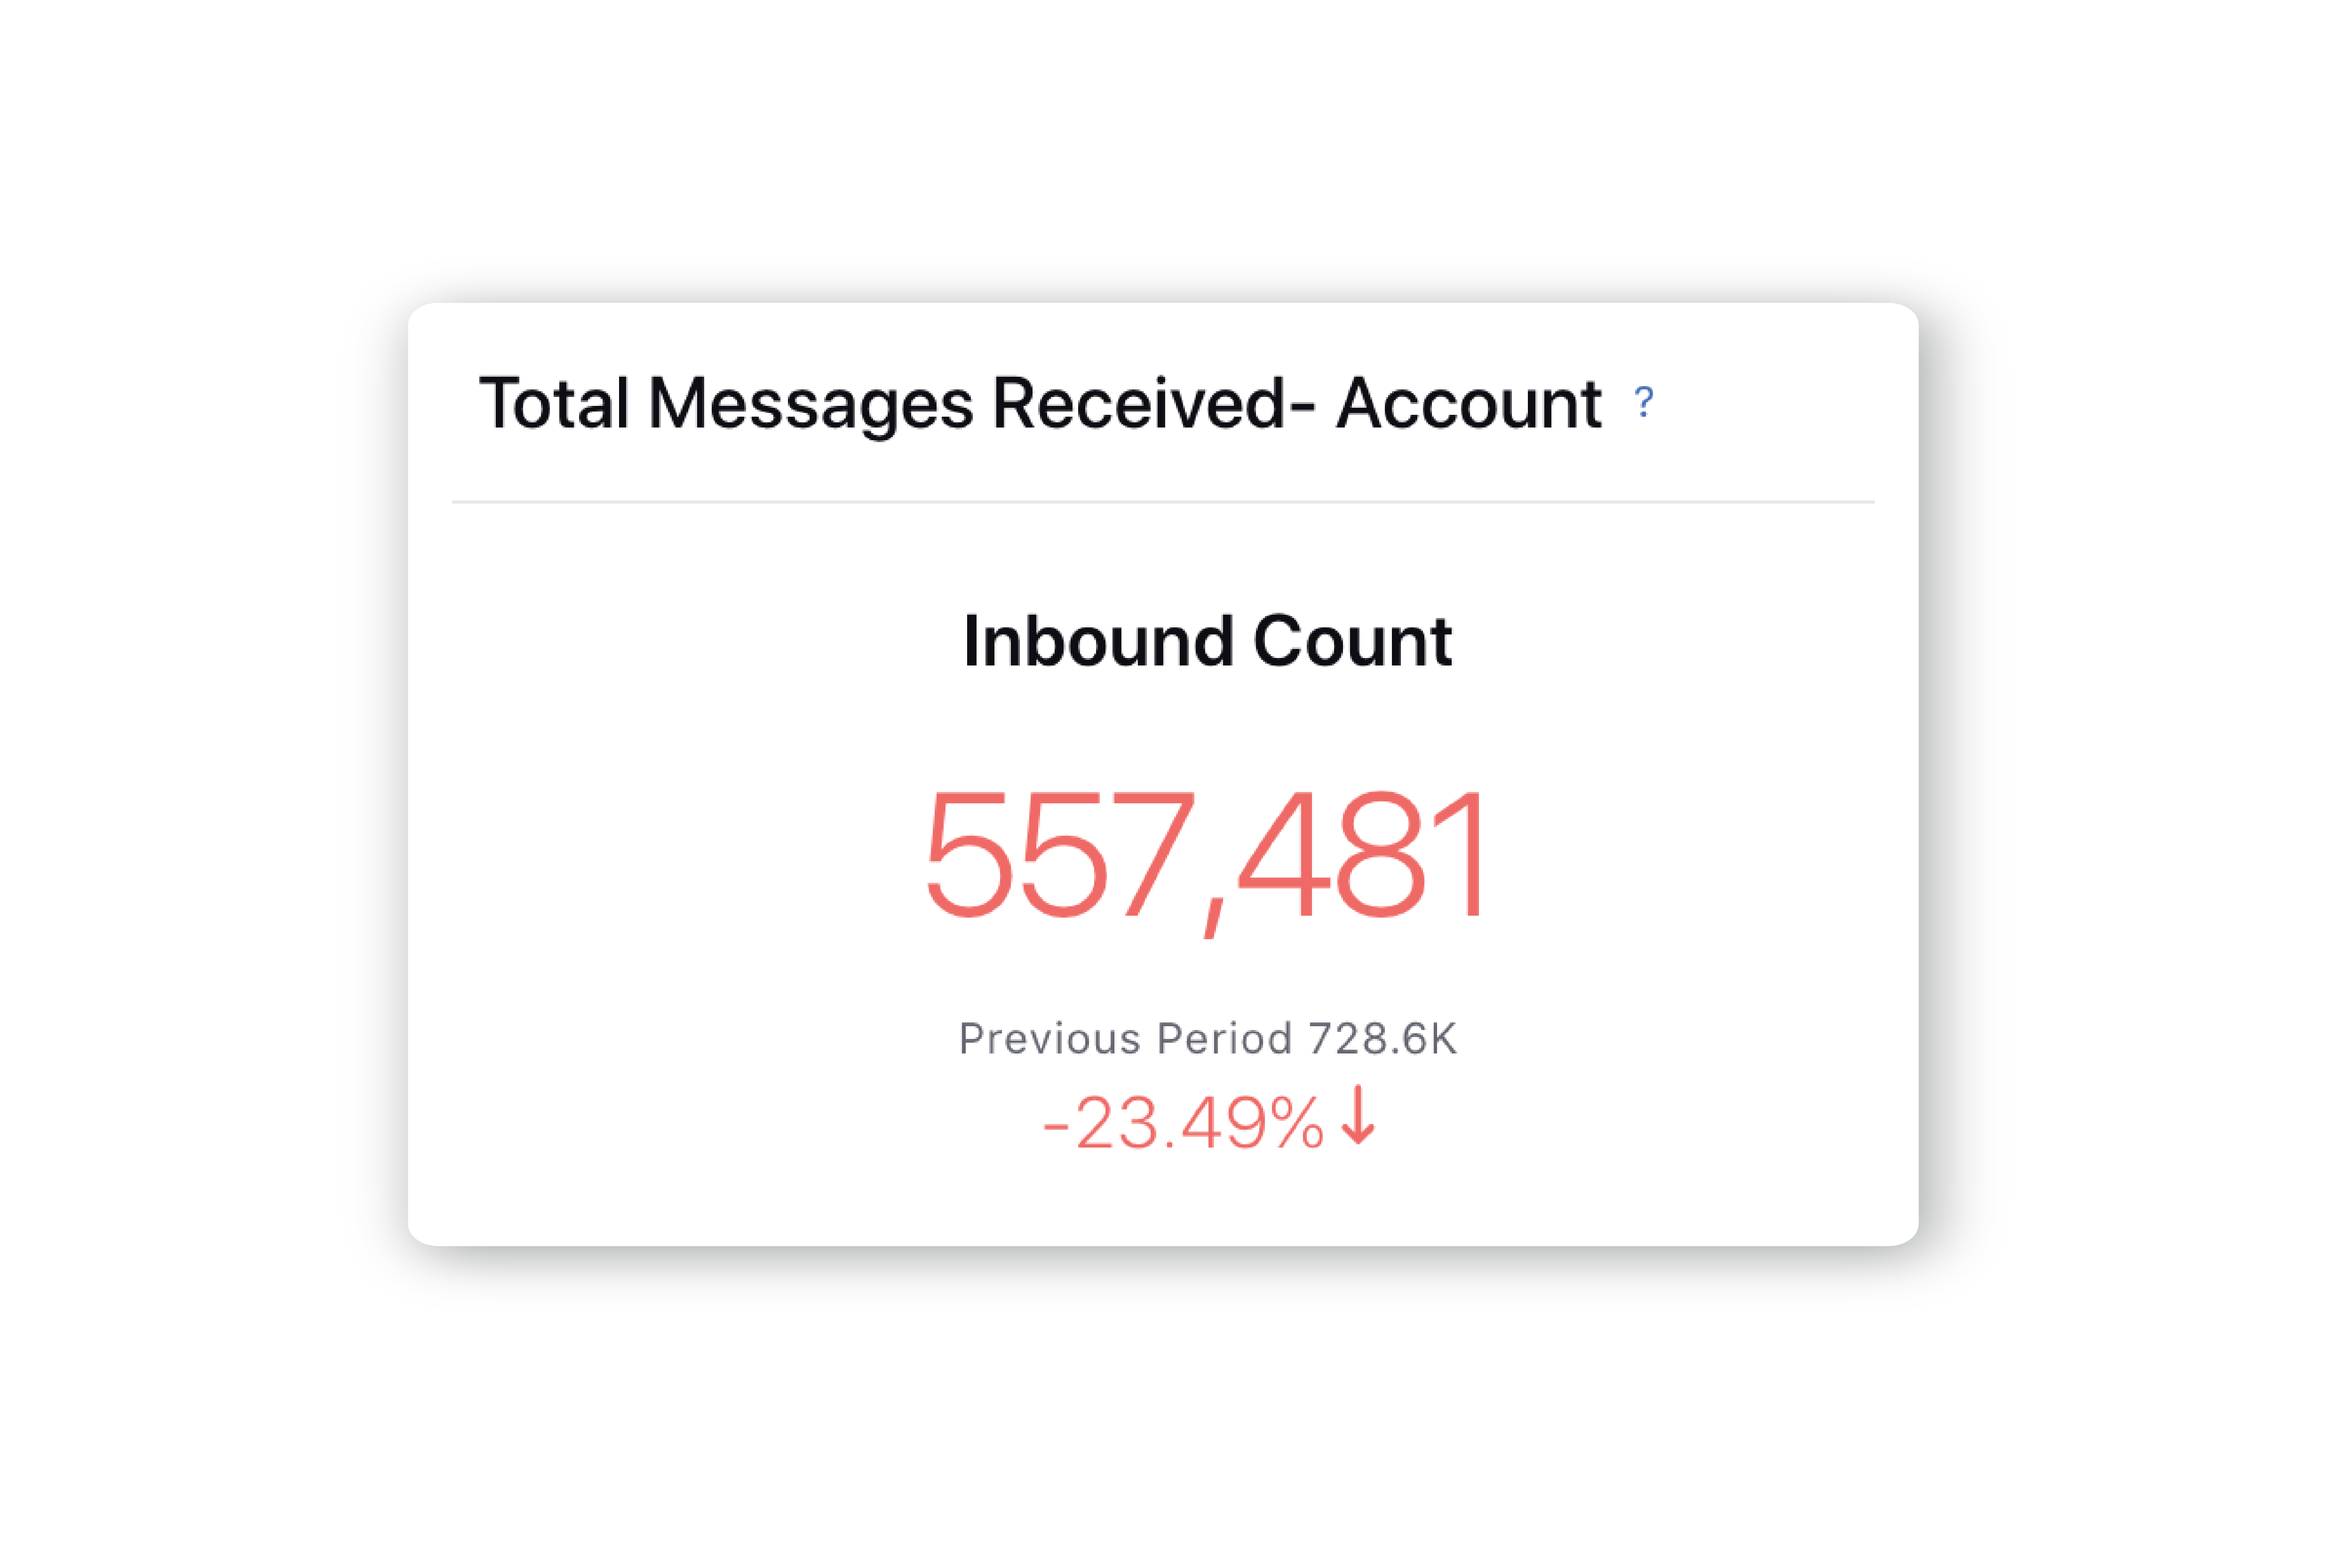
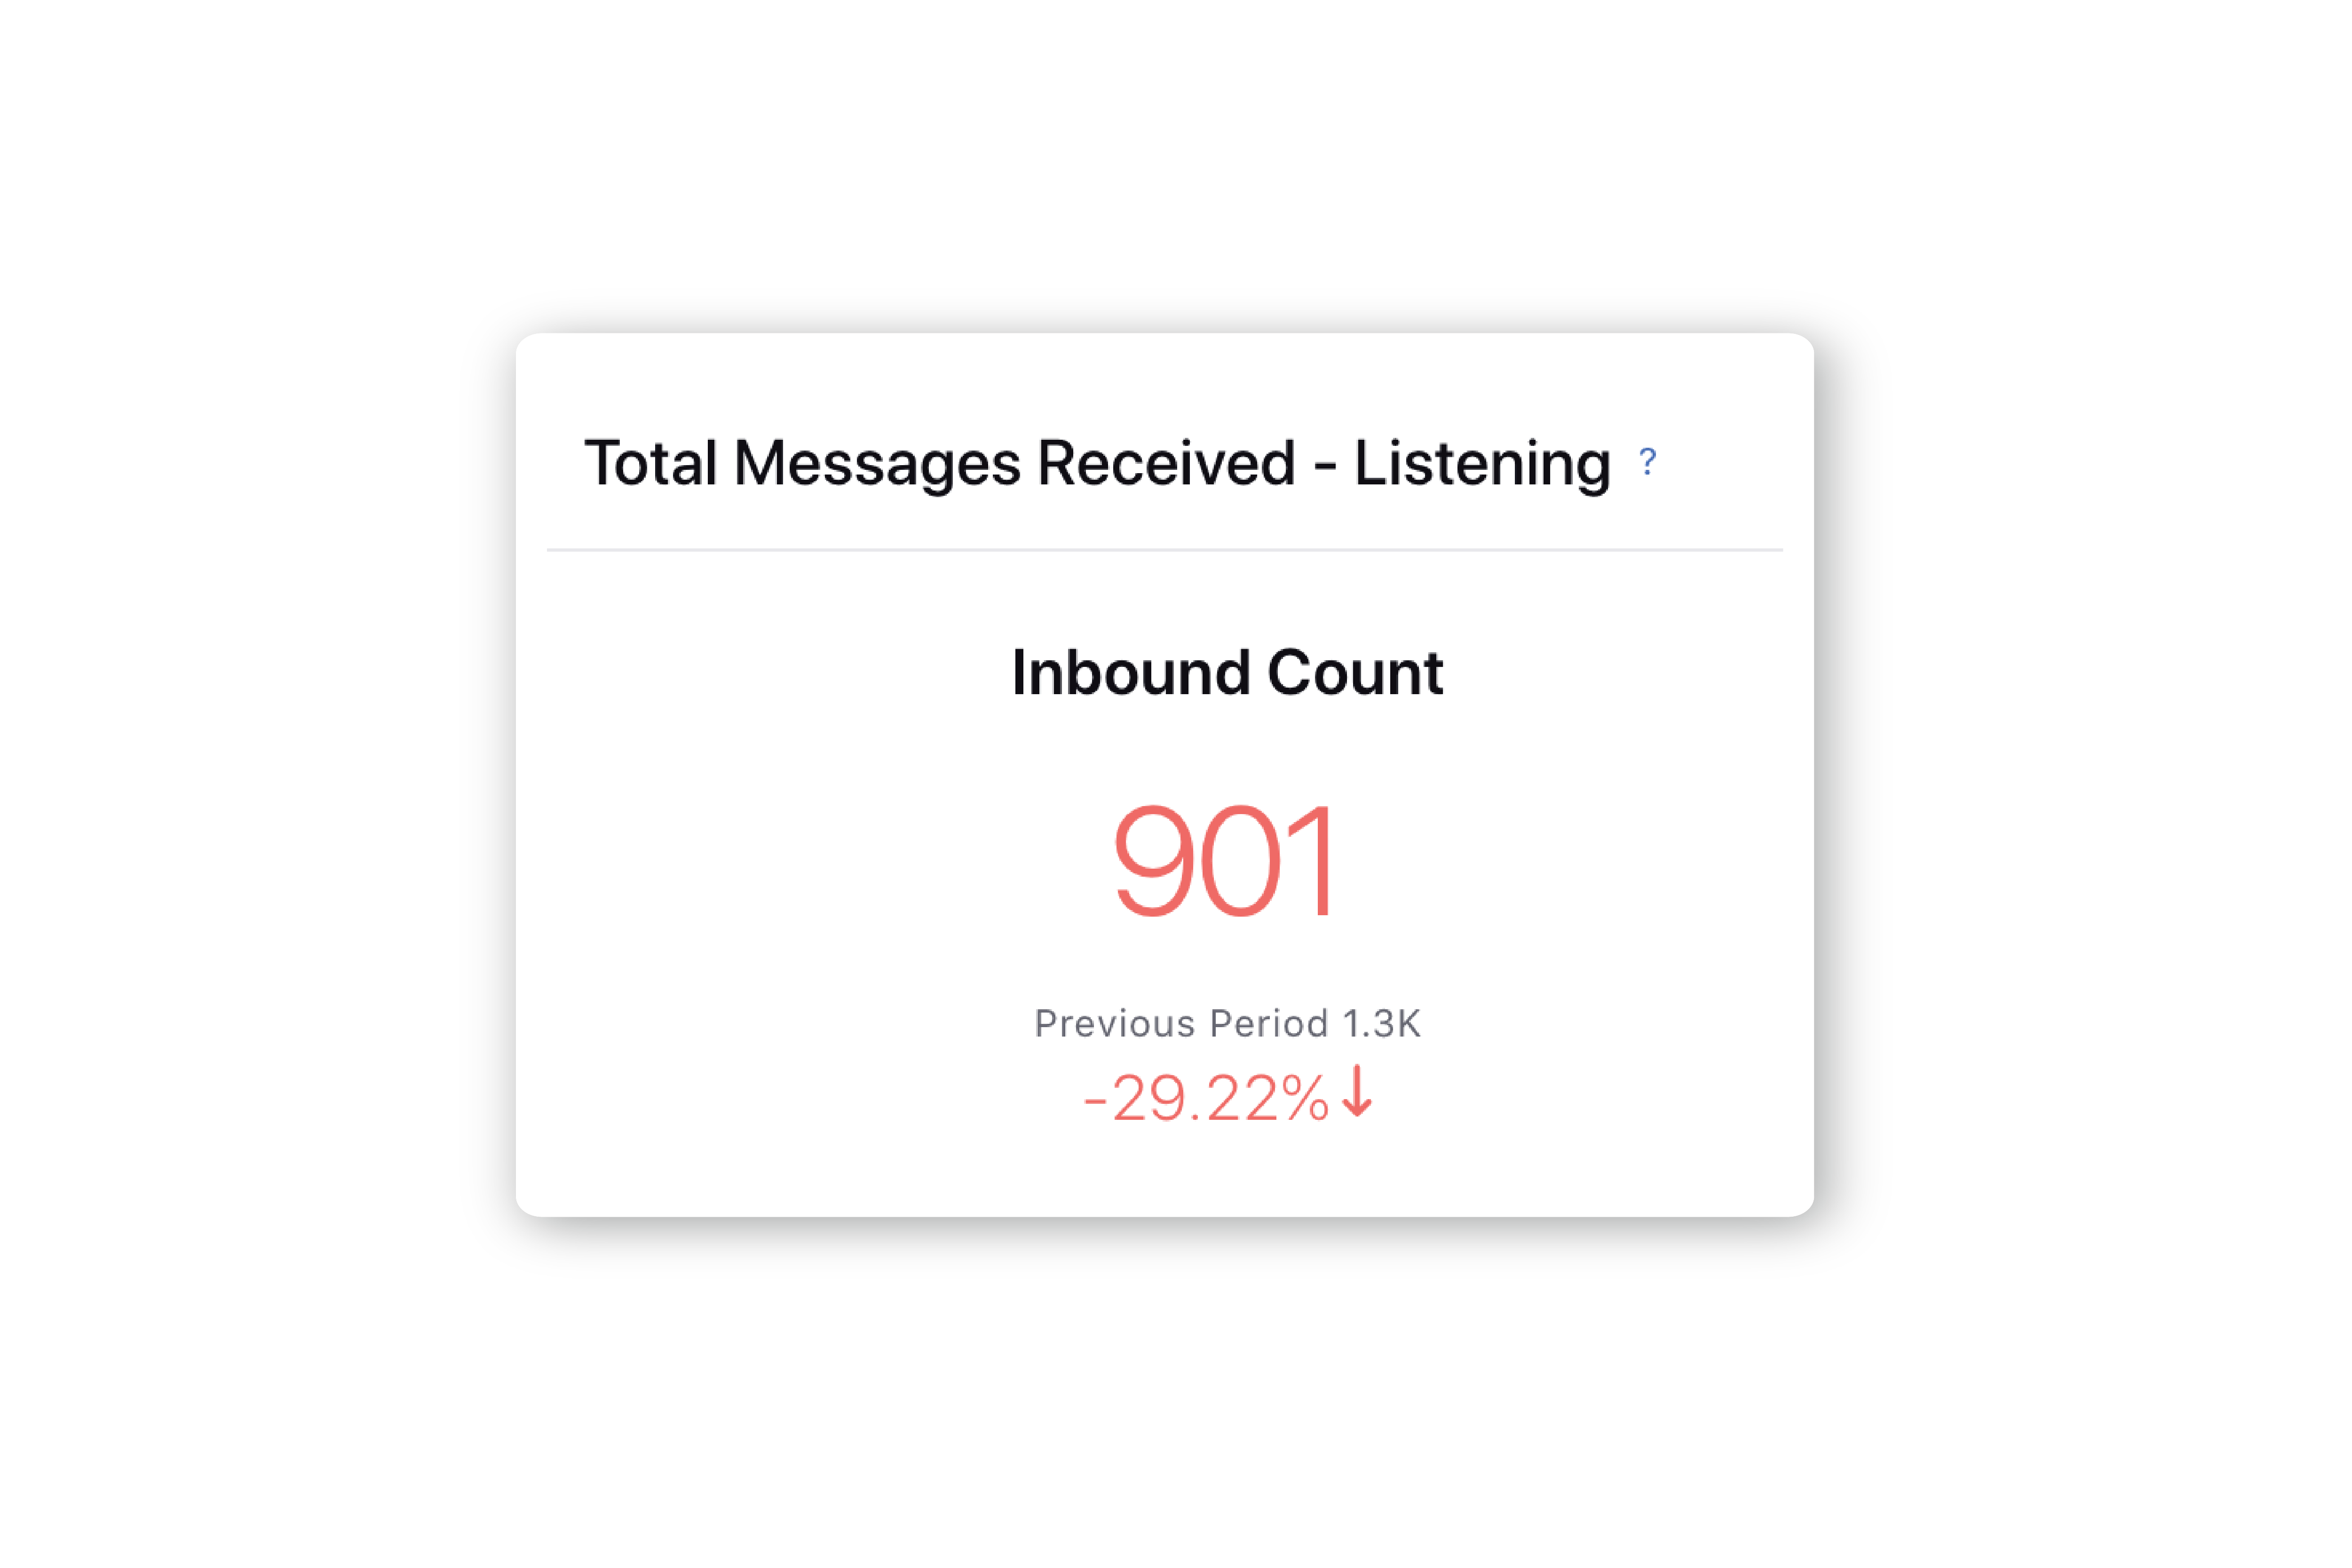
Total message received (Message Source Type: Account & Listening) - Total number of messages received from all the channels.
|
|
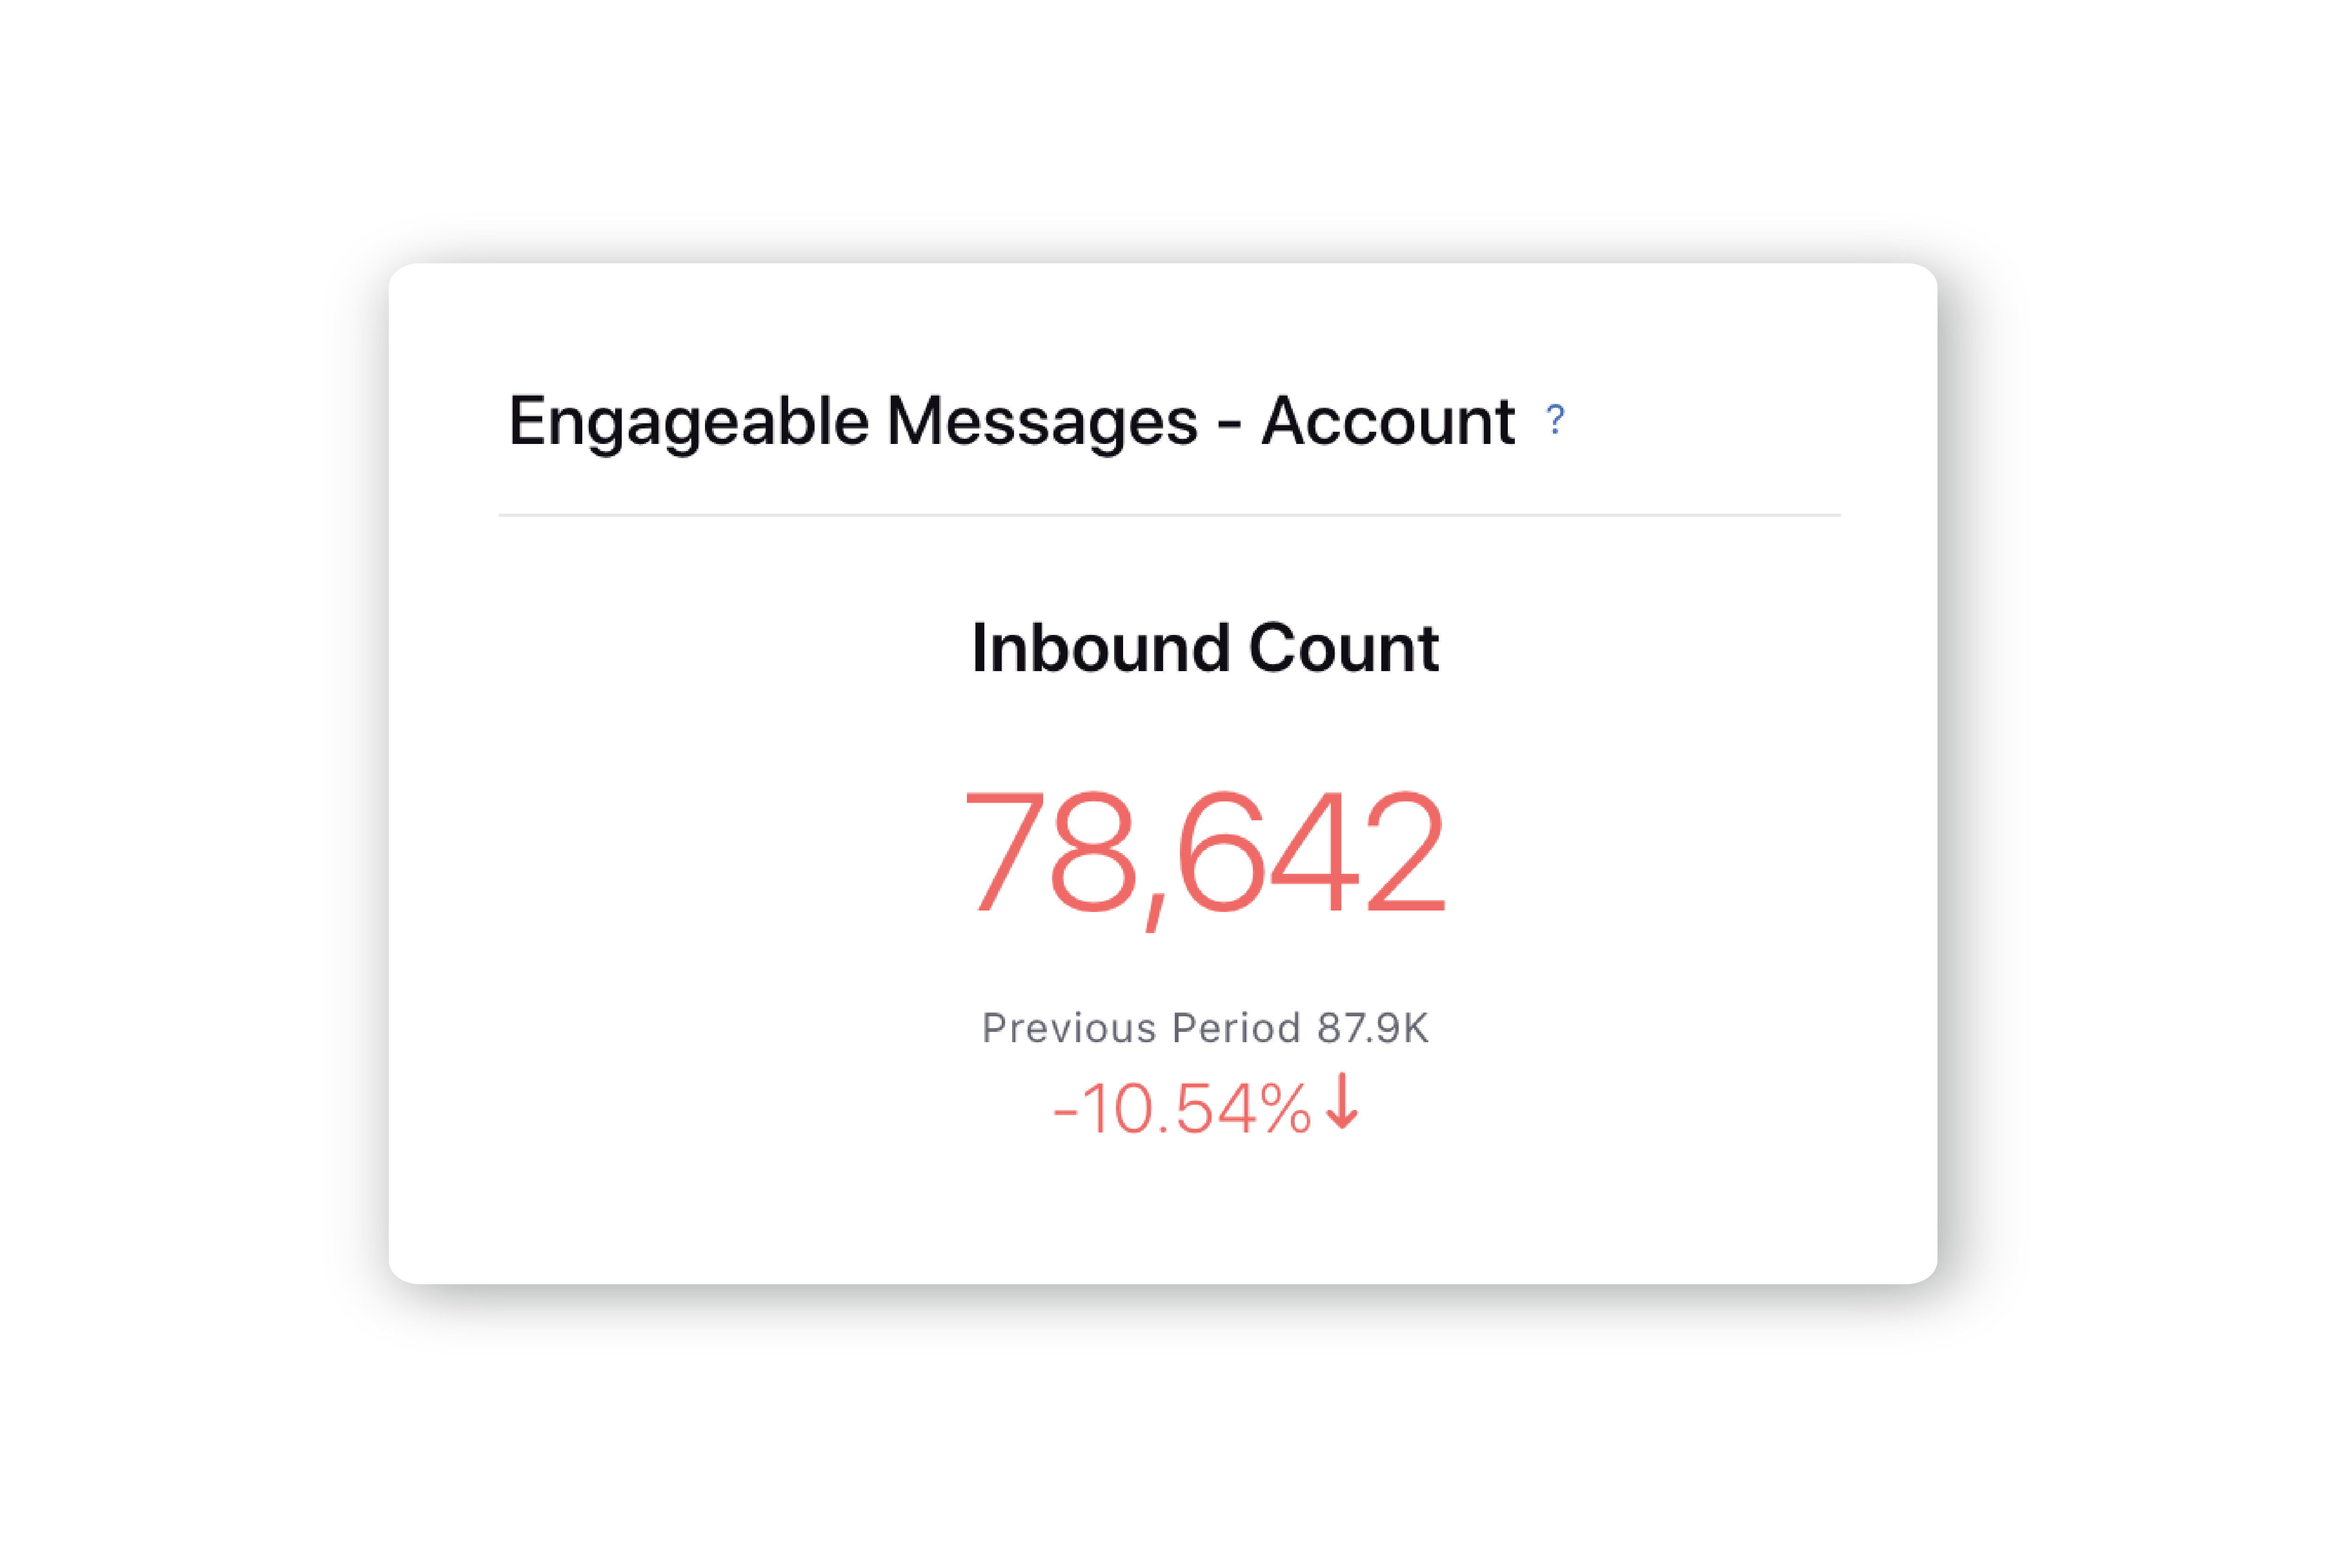
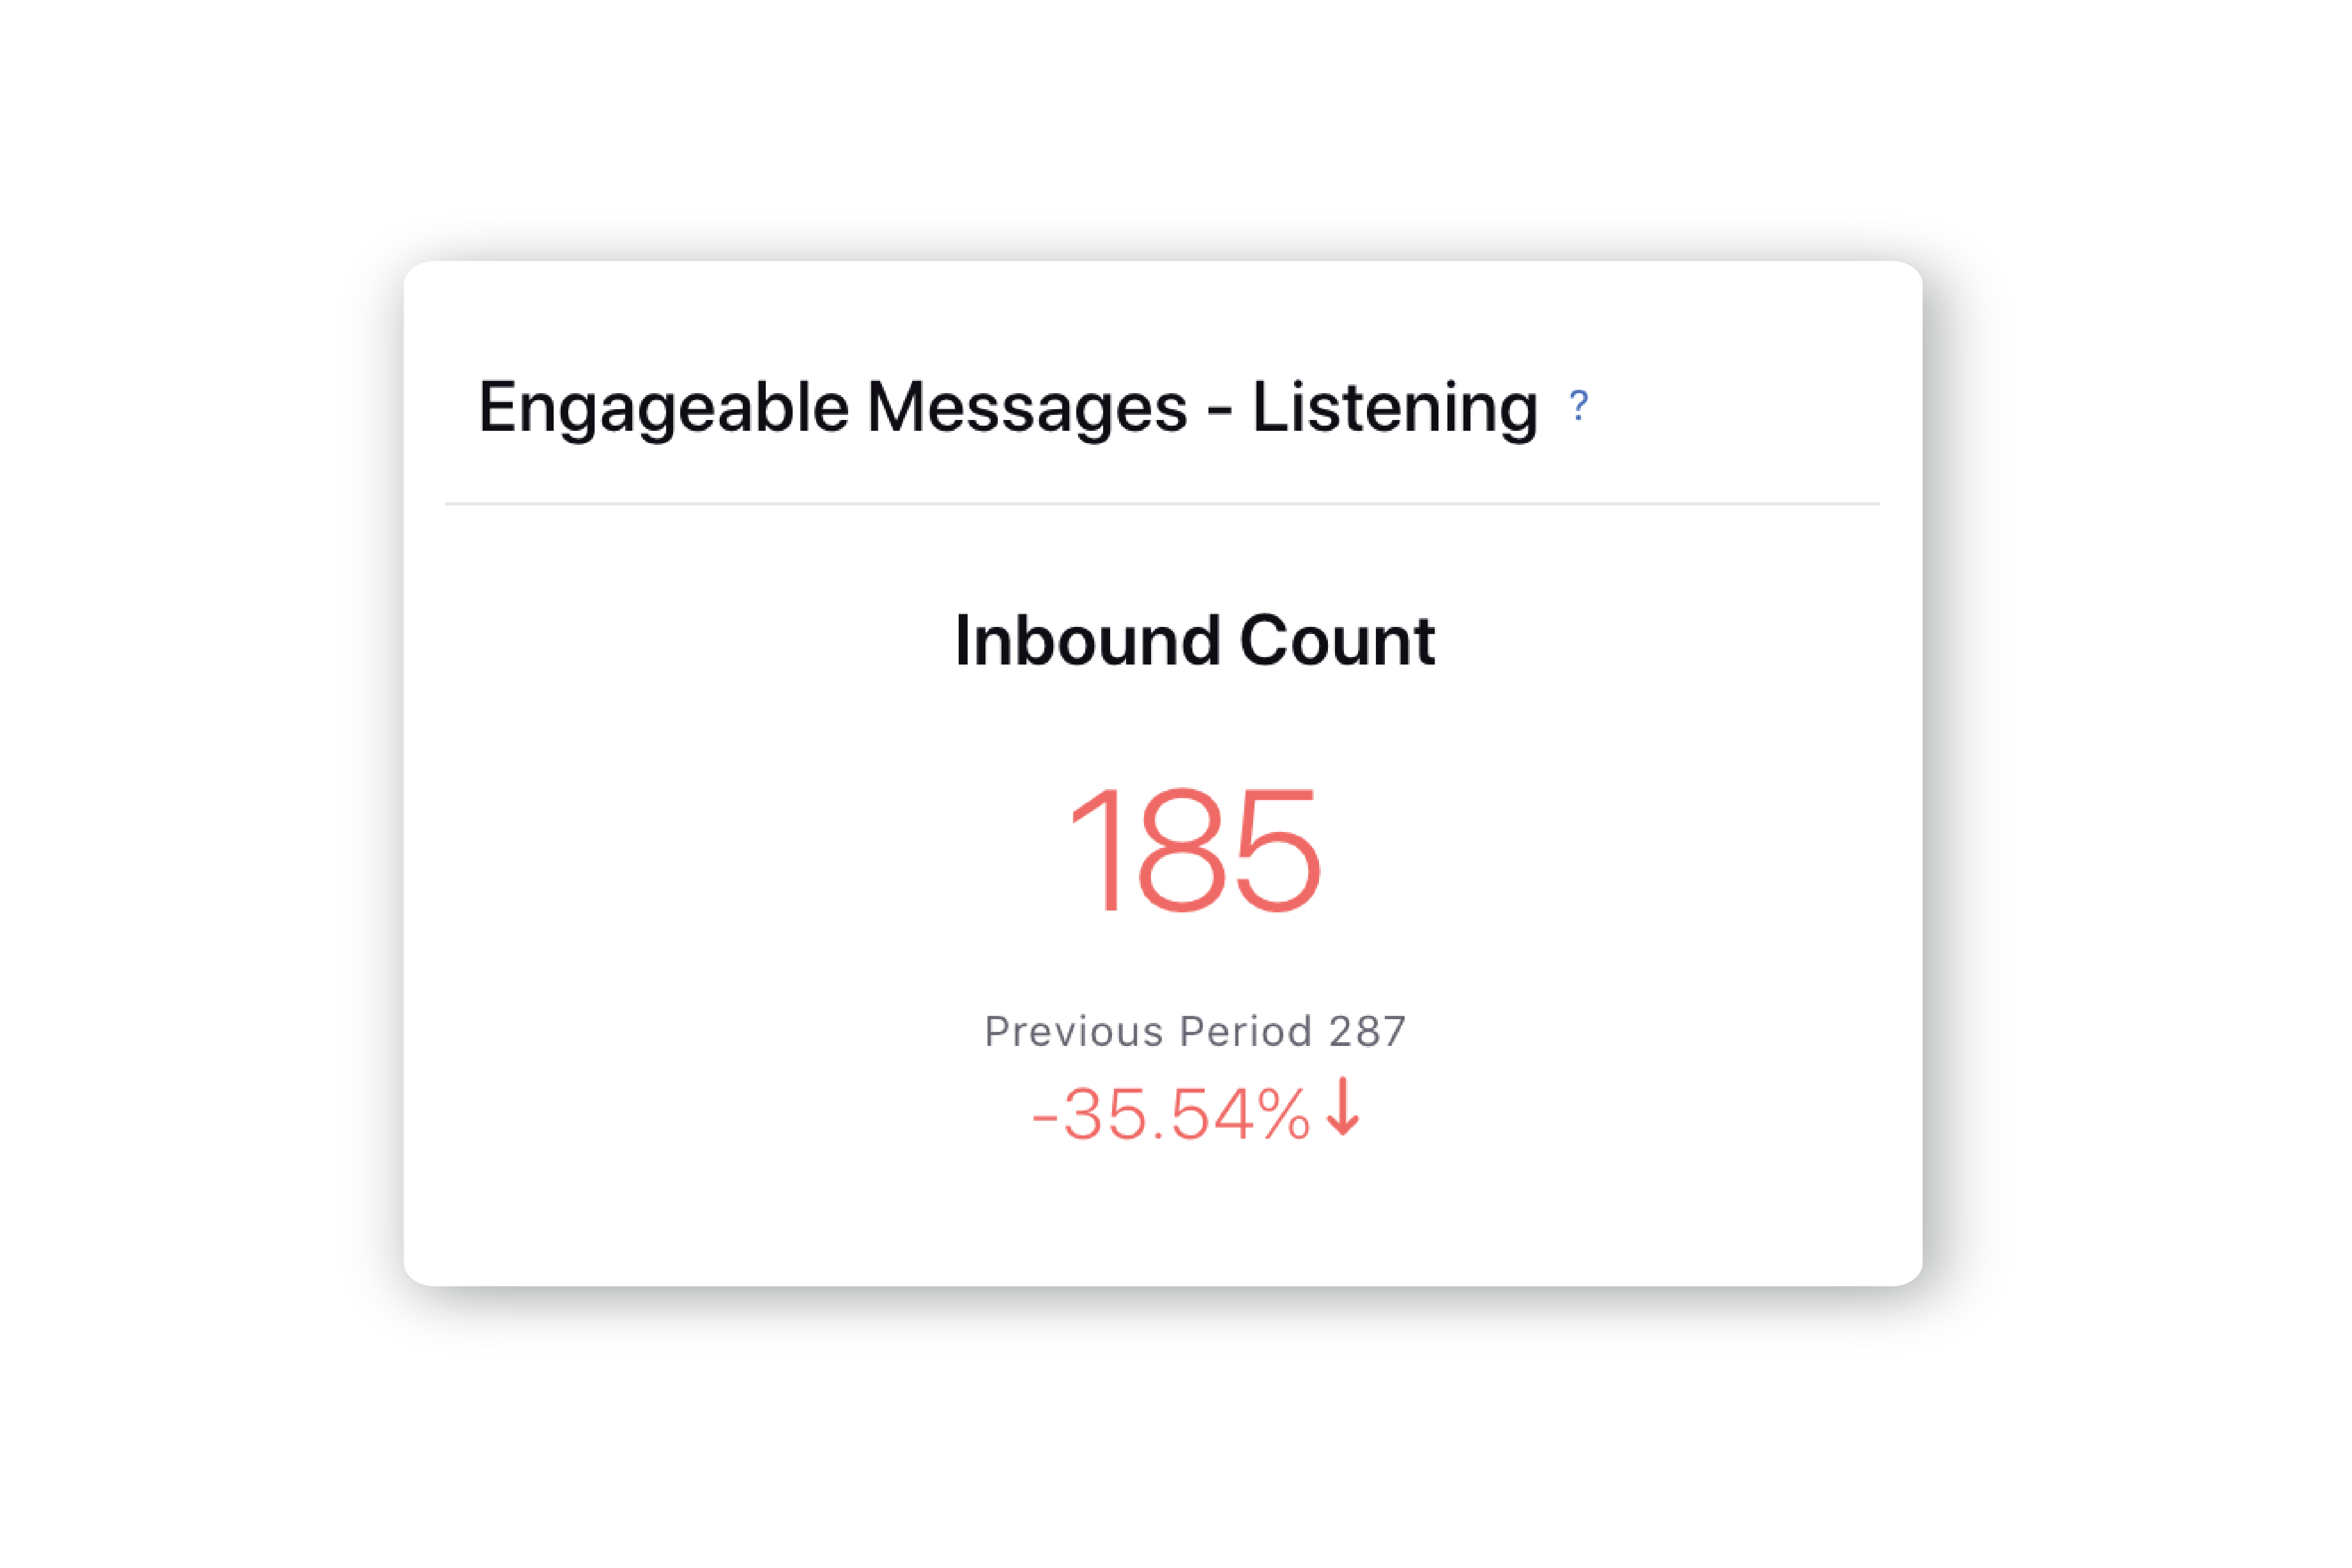
Engageable Message (Message Source Type: Account & Listening) - Total message count that requires an action to be taken. Fan (Inbound) messages tagged as Engageable by Intuition Moderation.
|
|
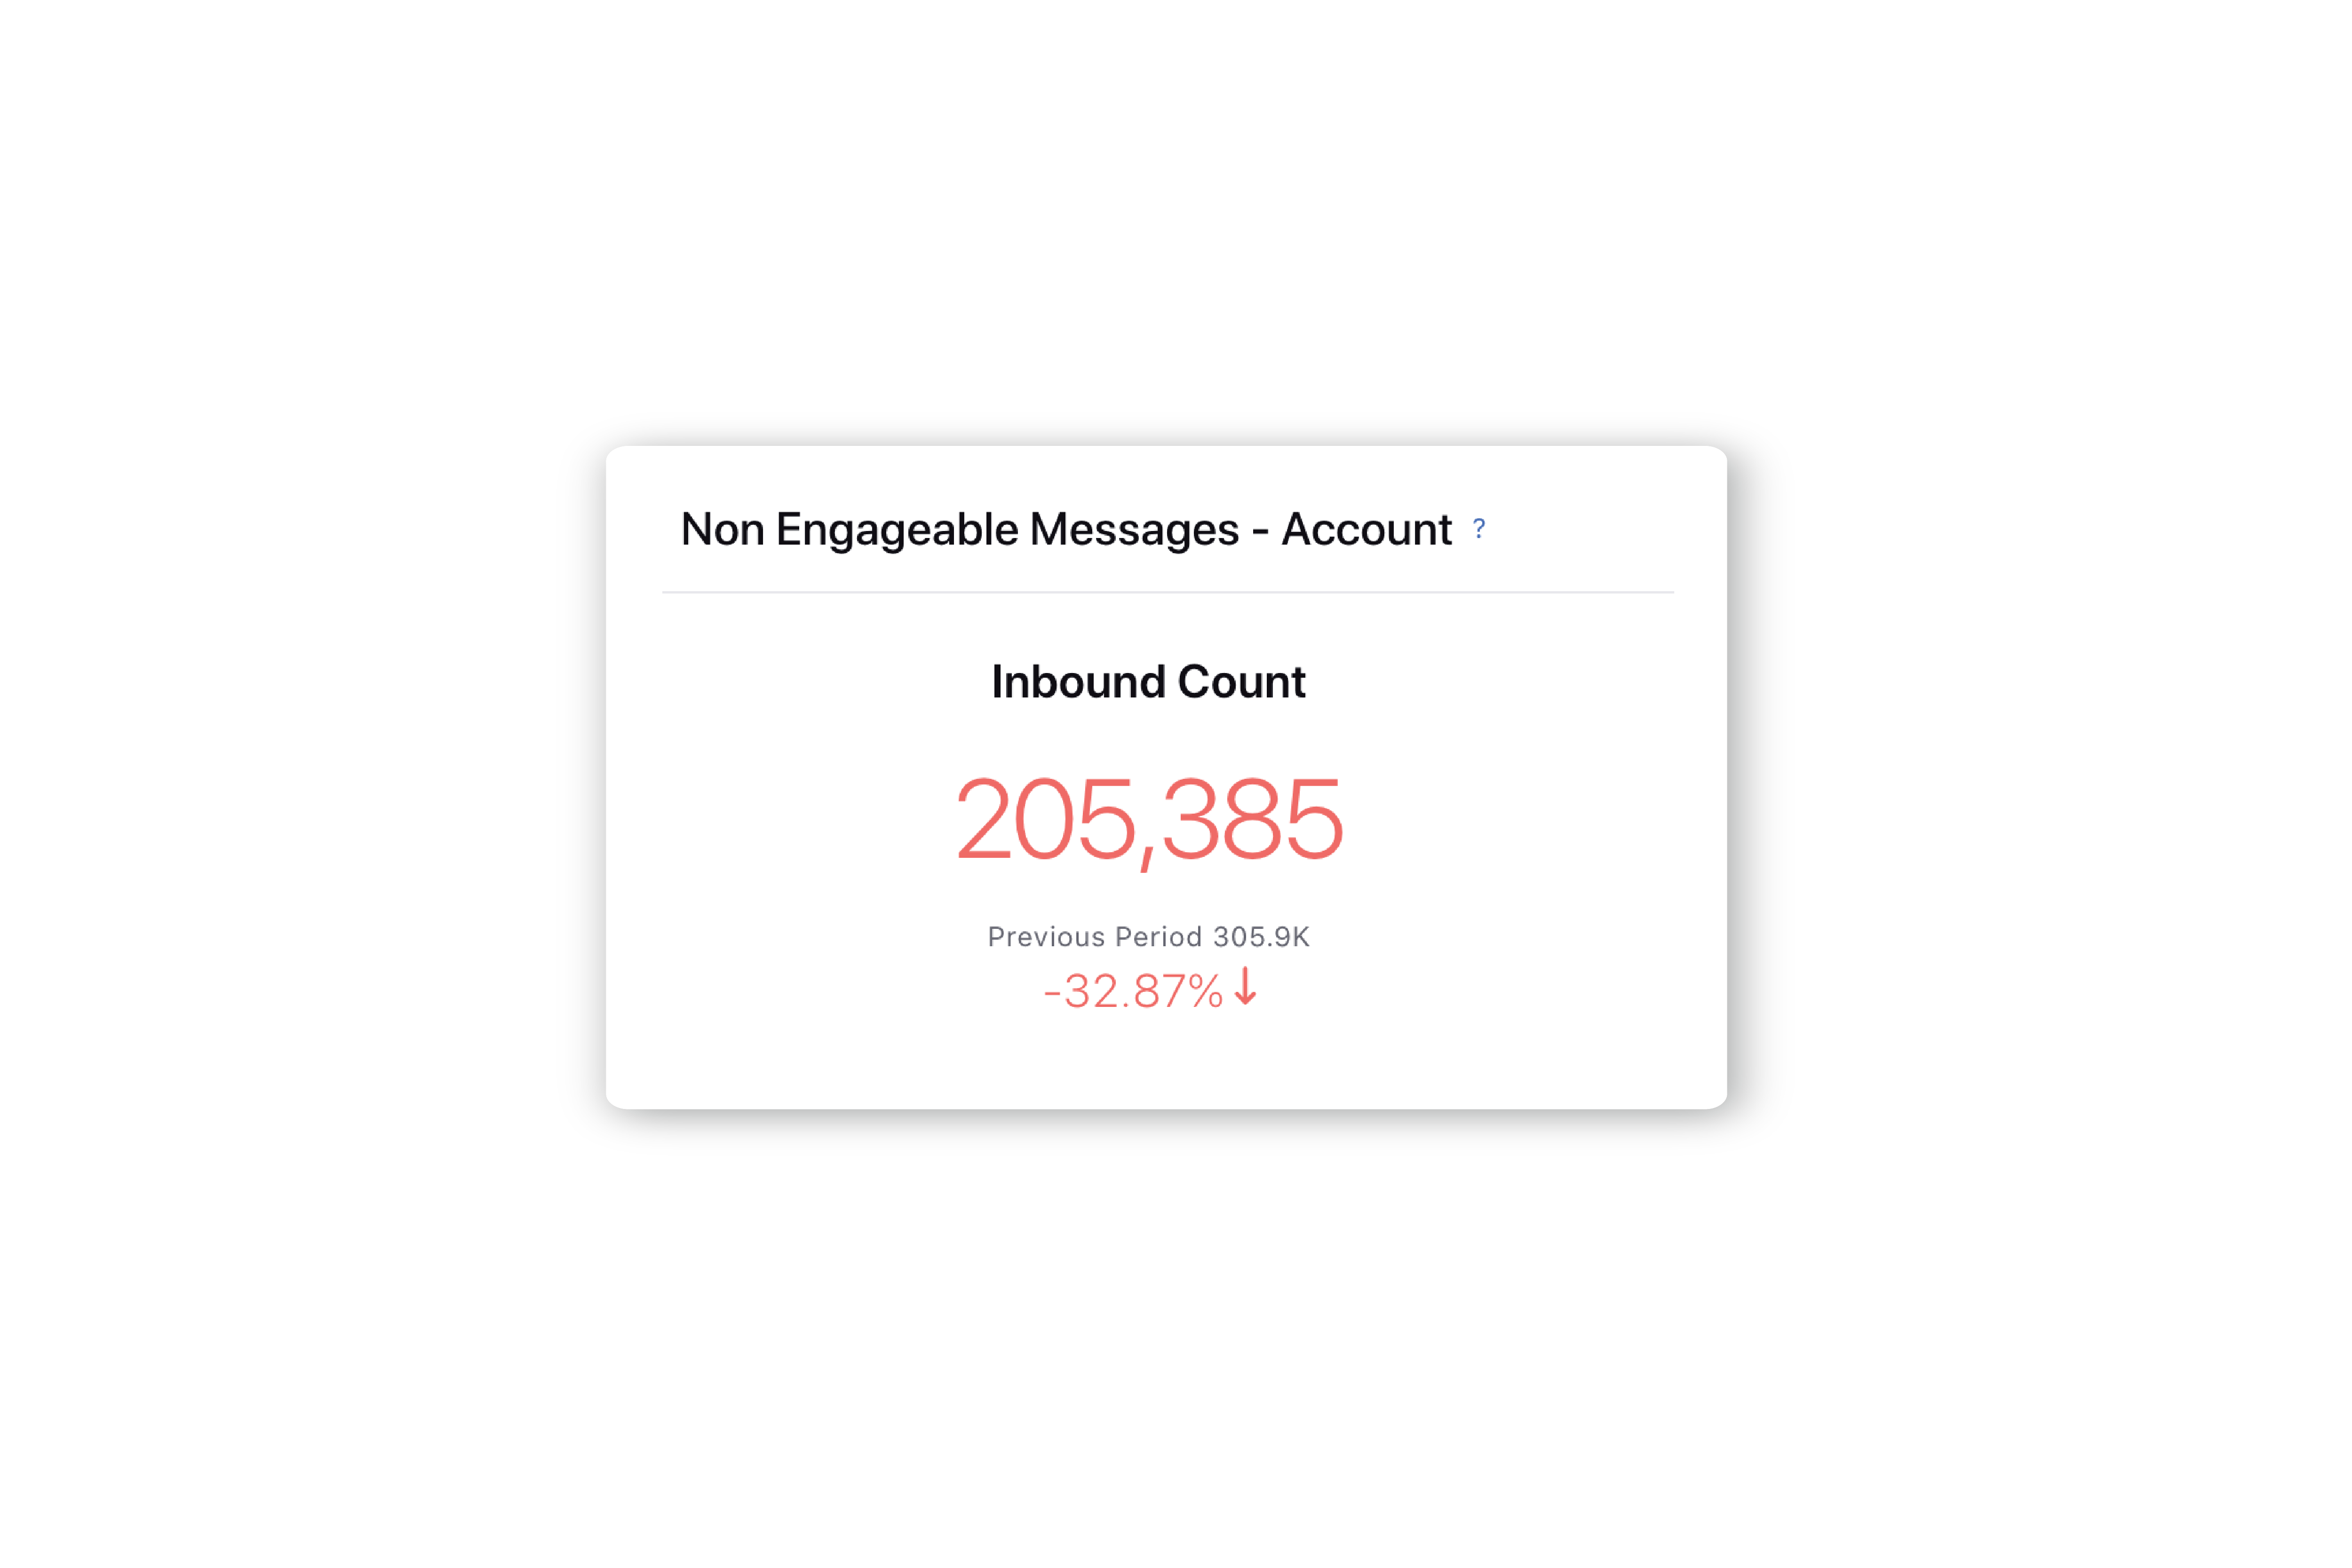
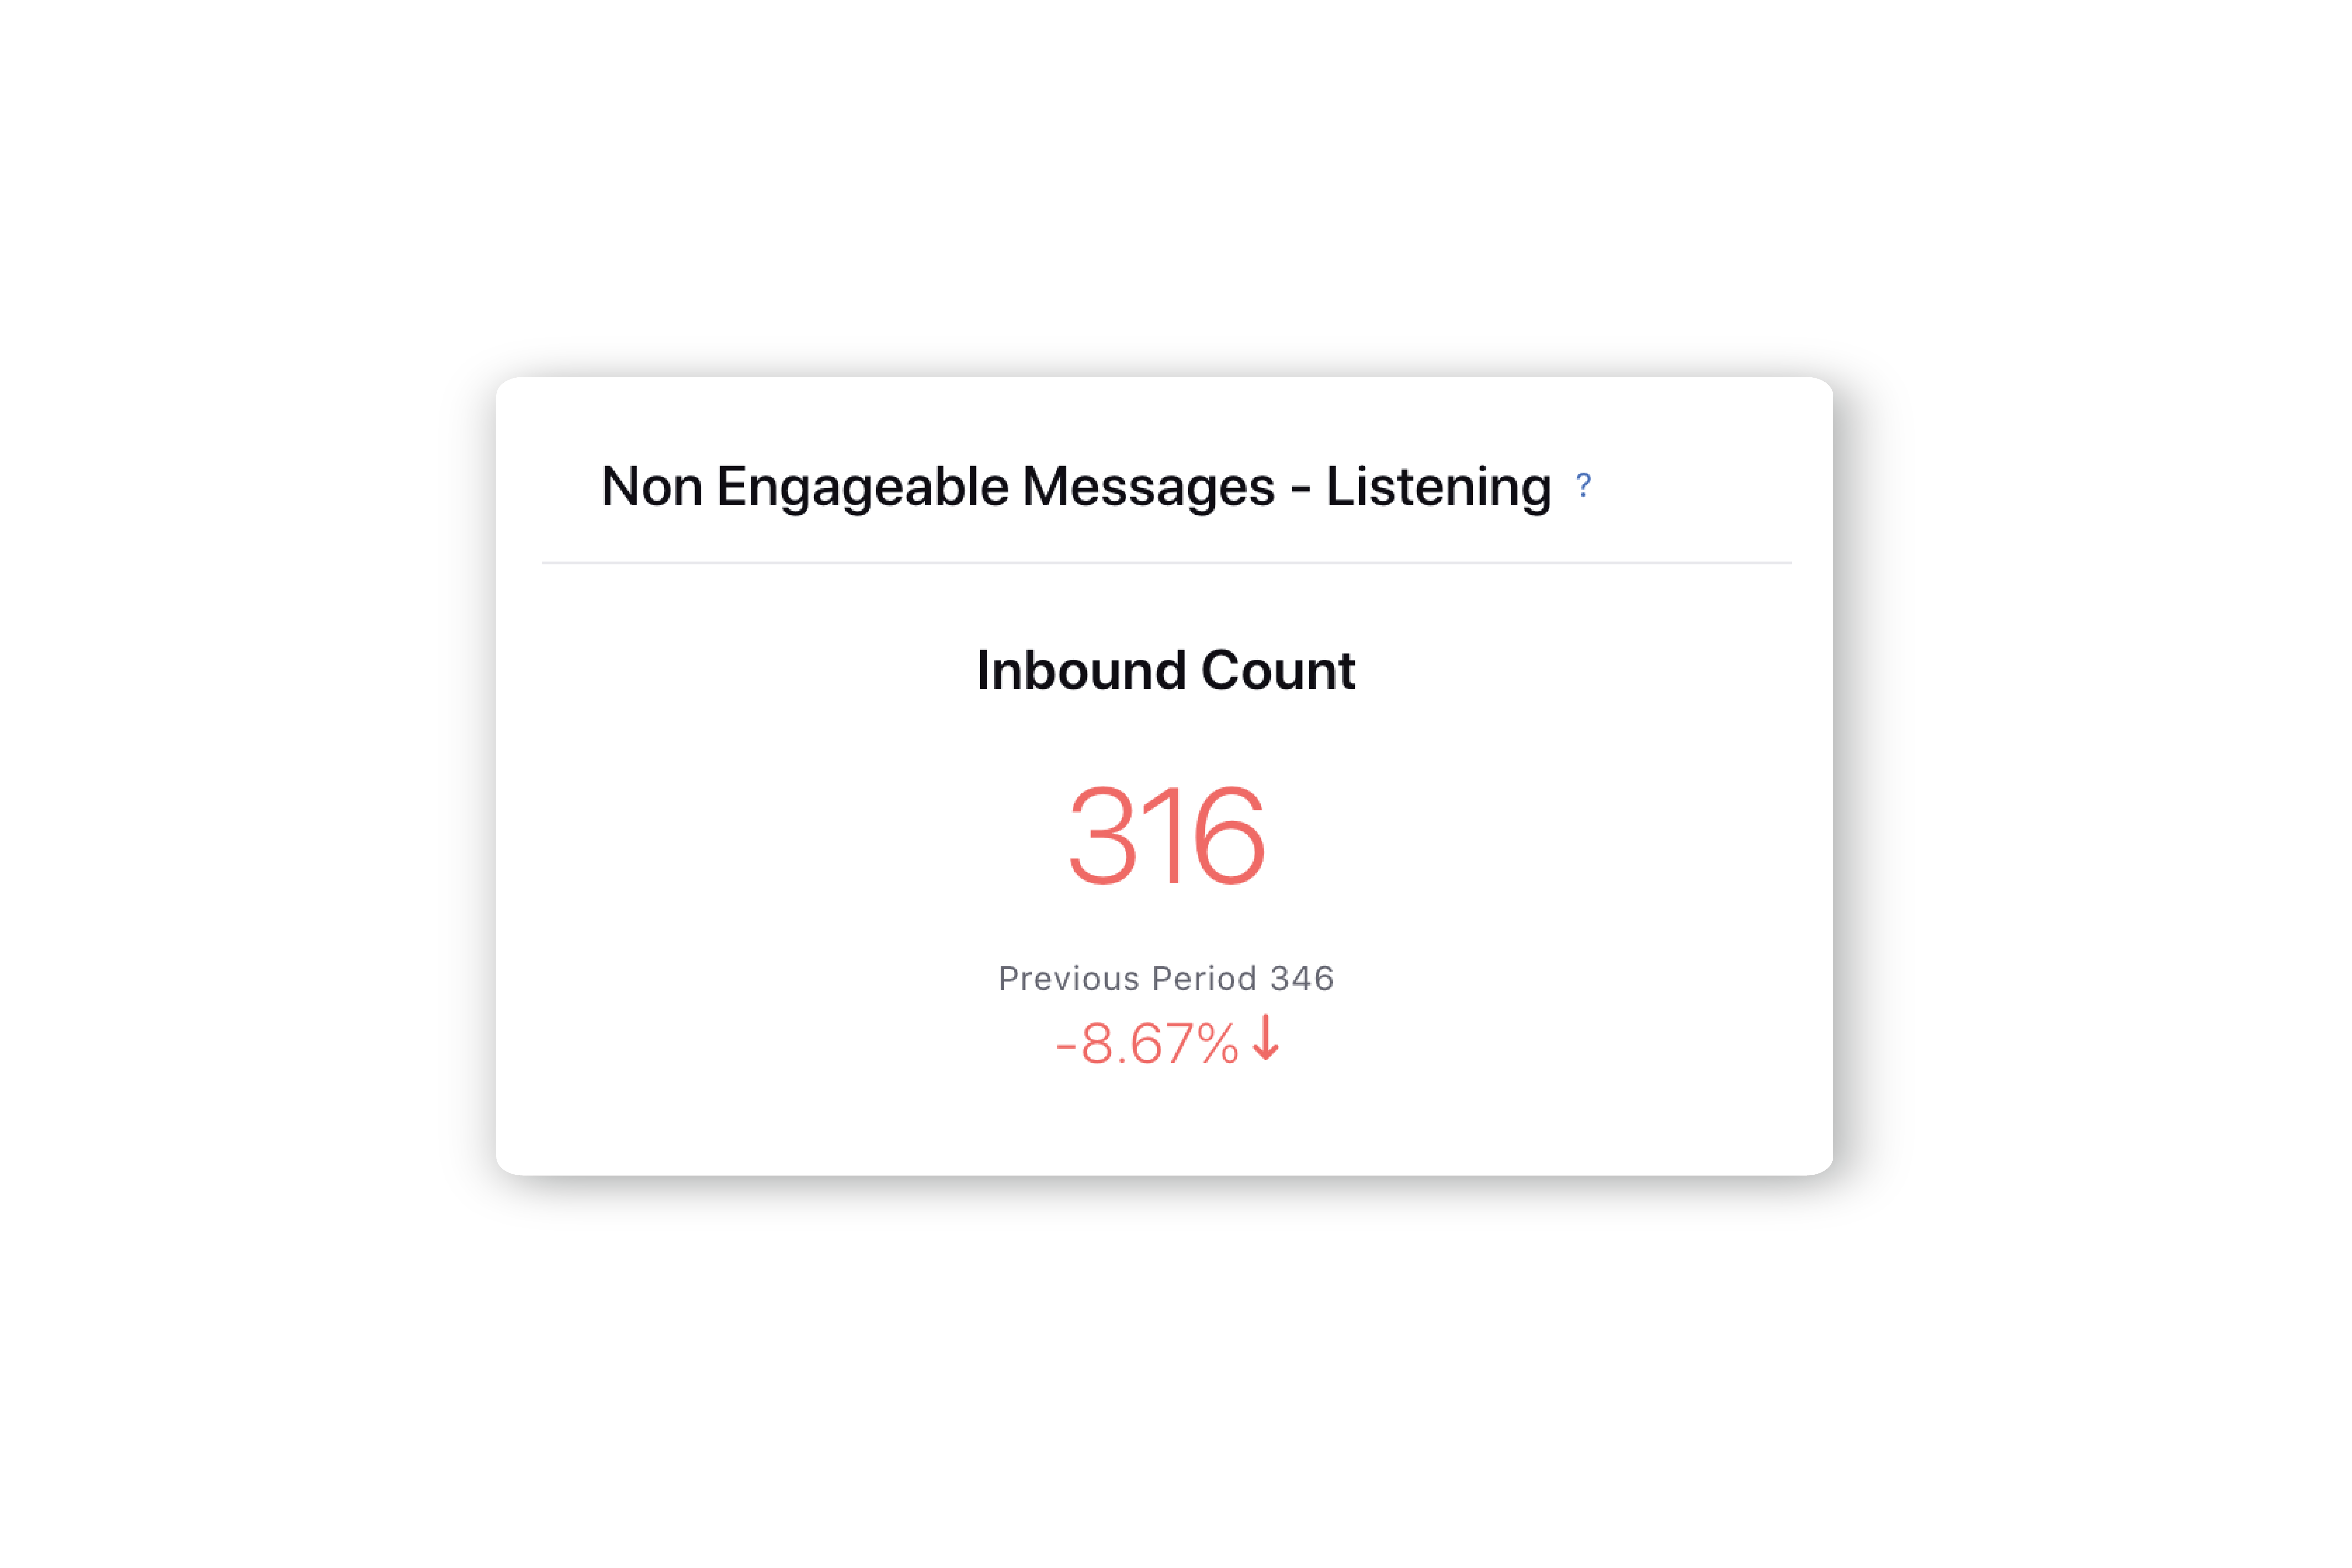
Non-Engageable Message (Message Source Type: Account & Listening) - Total message count for which no action is needed. Fan (Inbound) messages tagged as Non-Engageable by Intuition Moderation.
|
|
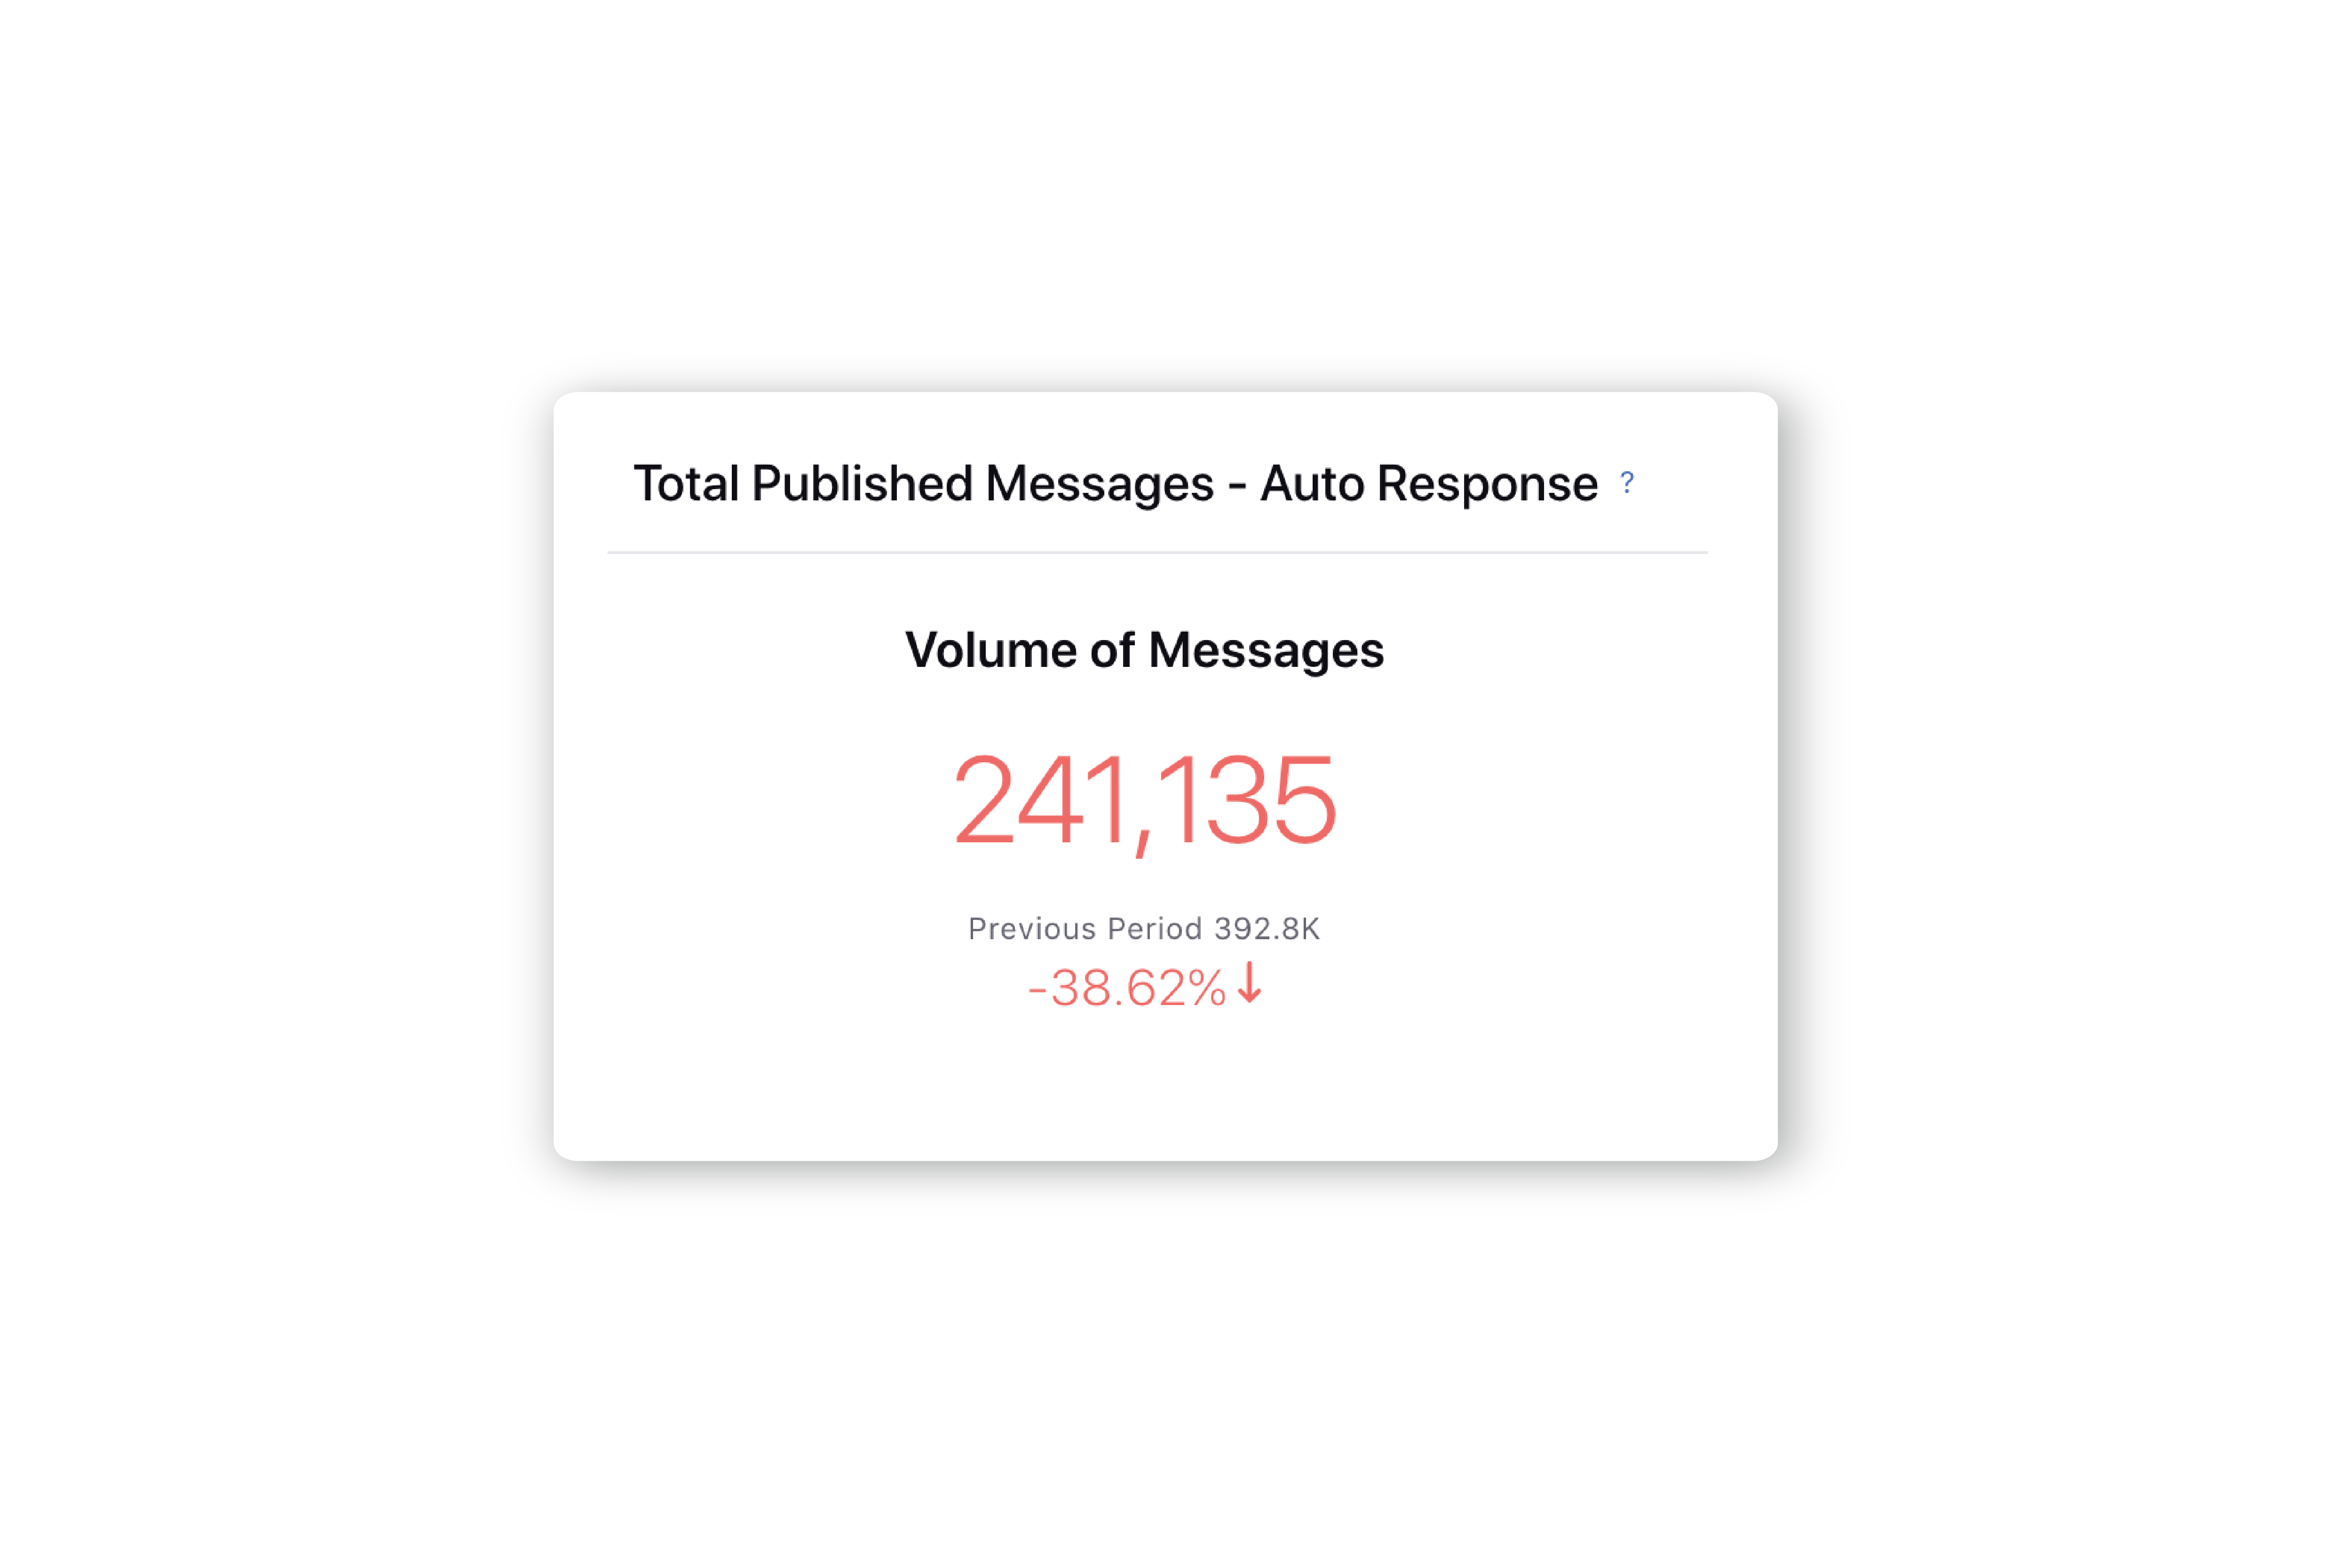
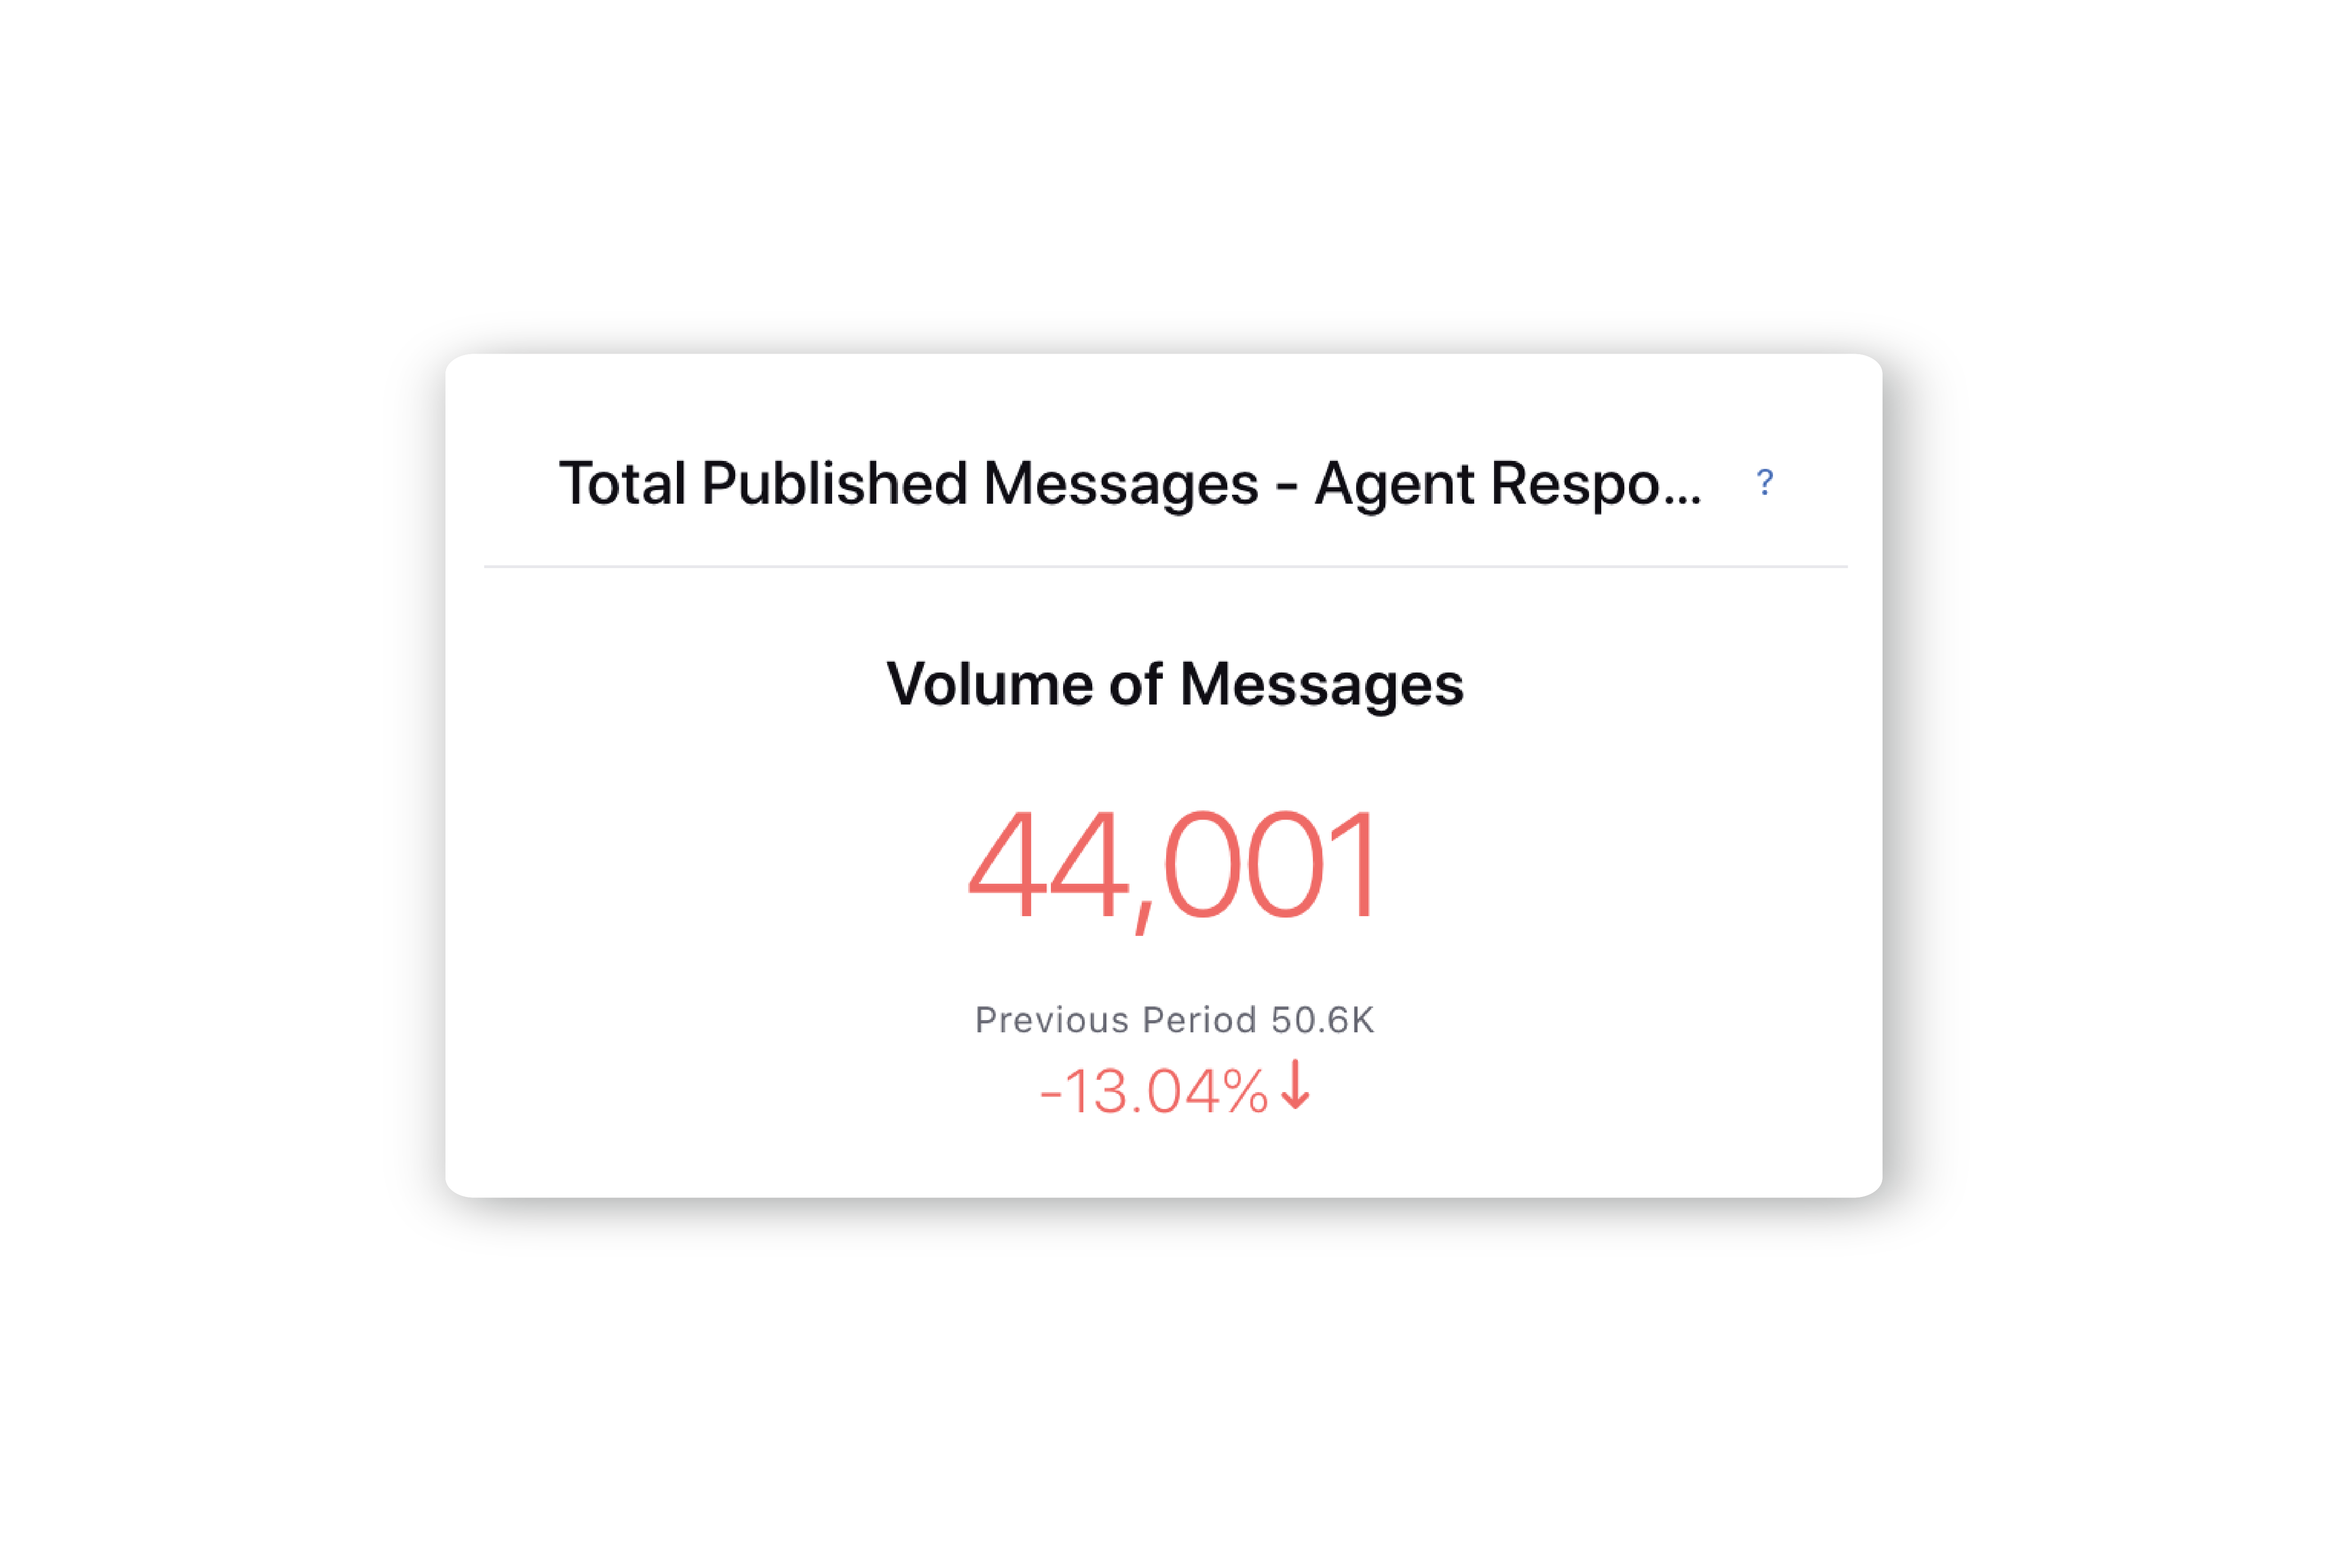
Total Published Messages (Auto Responses & Agent Responses) - Total number of messages (Auto and Agent Responses) published by the brand.
|
|
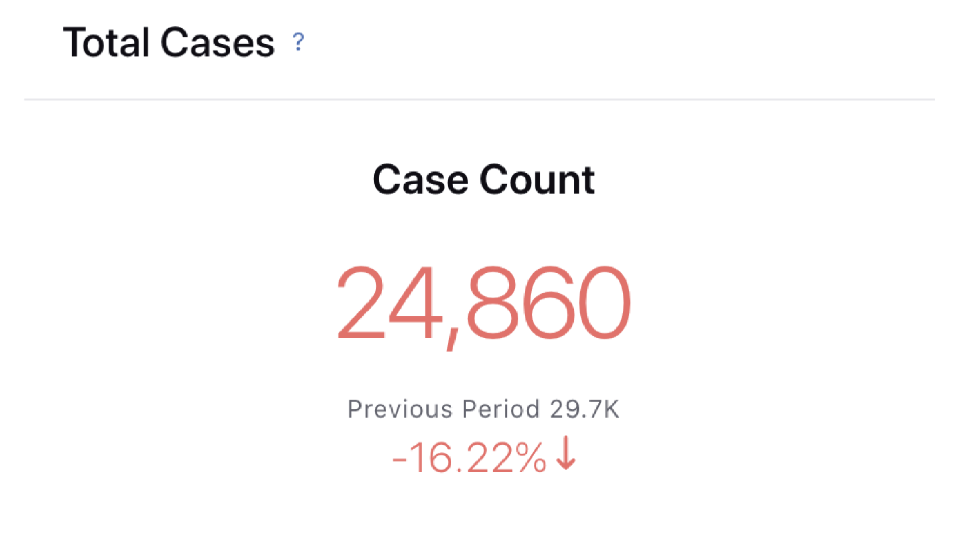
Total Cases - Total number of cases in a given time.
Cases Closed - Total number of closed cases.
Filters Applied: Status (Case) Containing Closed, Auto-Closed, No Response Required, Closed (Select appropriate Closed status as used in the environment)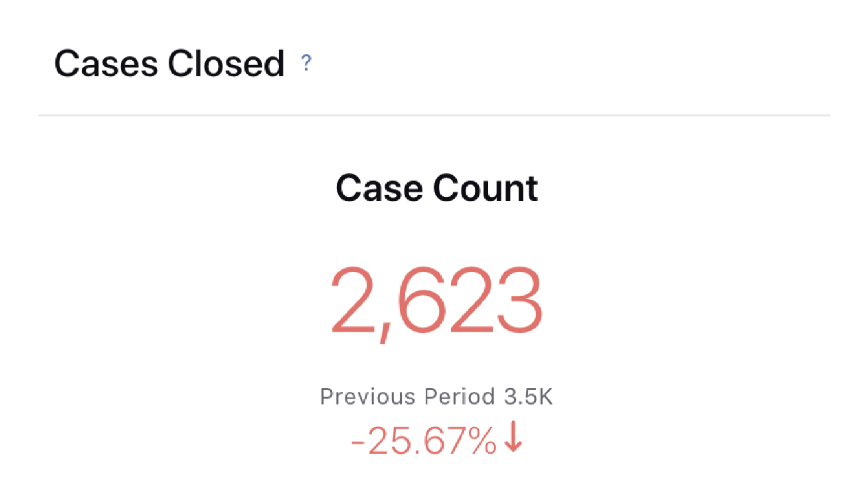
Open Cases - Total number of working cases.
Filters Applied: Status (Case) Containing Responded-Awaiting Reply, Awaiting Reply, and Assigned (Select appropriate Open status as used in the environment)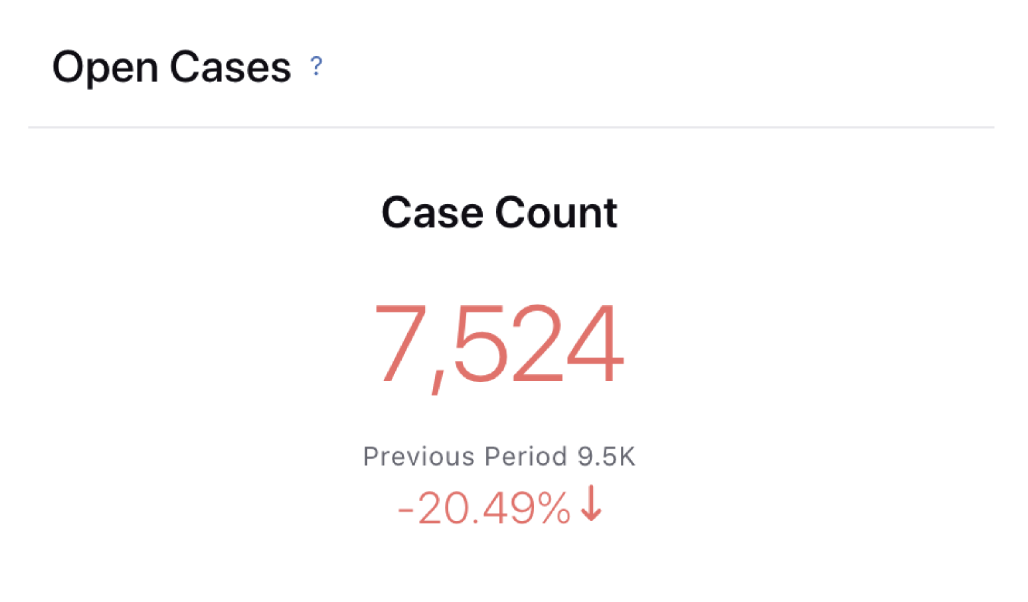
Unique Customer Engaged - Count of unique customers engaged on cases.
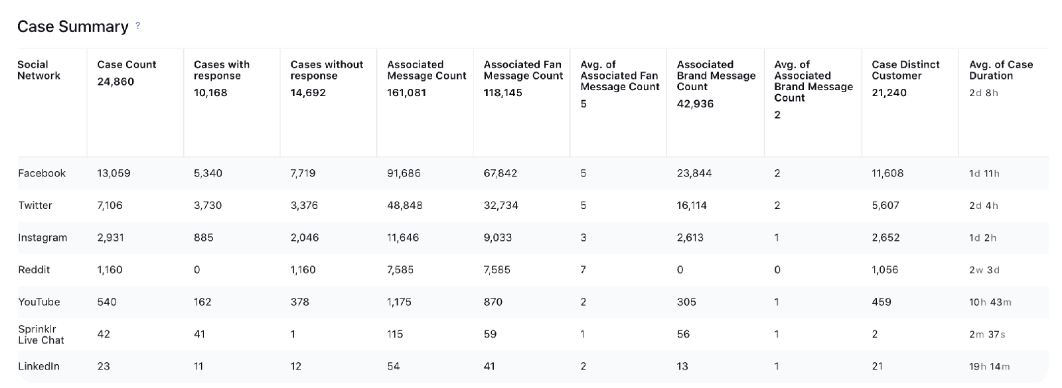
Case Summary - It gives you an overview of Case Volume, Case Duration & Message Count with respect to Social Networks.
Social Network: Name of the Social Network.
Case Count: Total number of cases created within the selected time duration.
Cases with responses: Total number of cases with response(s).
Cases without responses: Total number of cases without response(s).
Associated Message Count: Number of messages associated with a case.
Associated Fan Message Count: Number of fan messages associated with a case.
Avg. of Associated Fan Message Count: Average of the count of fan messages associated with a case.
Associated Brand Message Count: Number of brand messages associated with a case.
Avg. of Associated Brand Message Count: Average of the count of brand messages associated with a case.
Case Distinct Customer: Number of distinct profiles in the associated case(s).
Avg. of Case Duration: Average of the time period between the first associated message to the case and the last associated message to the same case.
Note - Auto-responses are taken into consideration for these metrics
Cases by Account - Volume of Cases in various channels & respective accounts.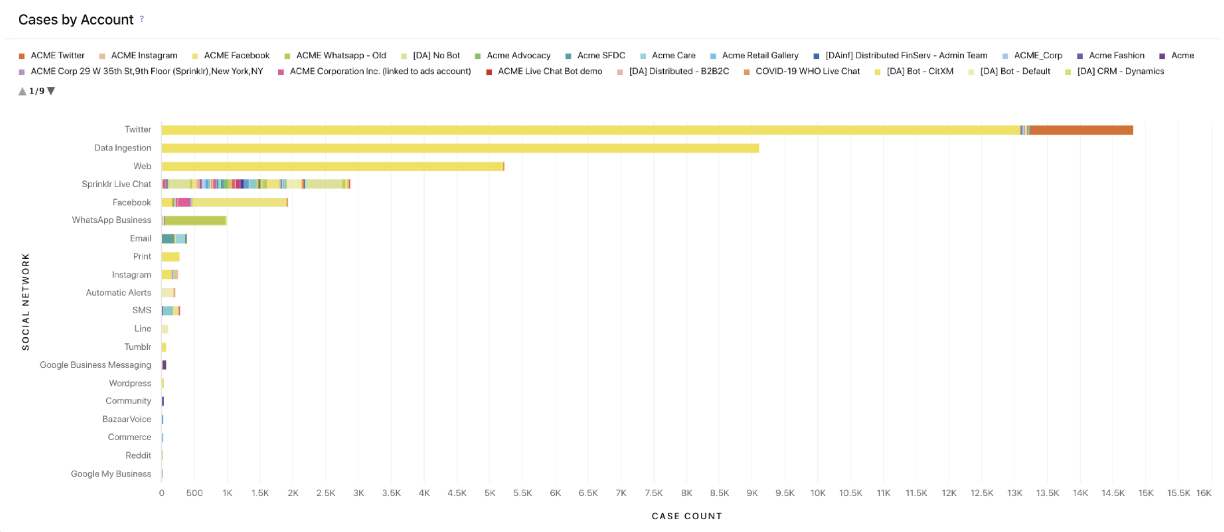
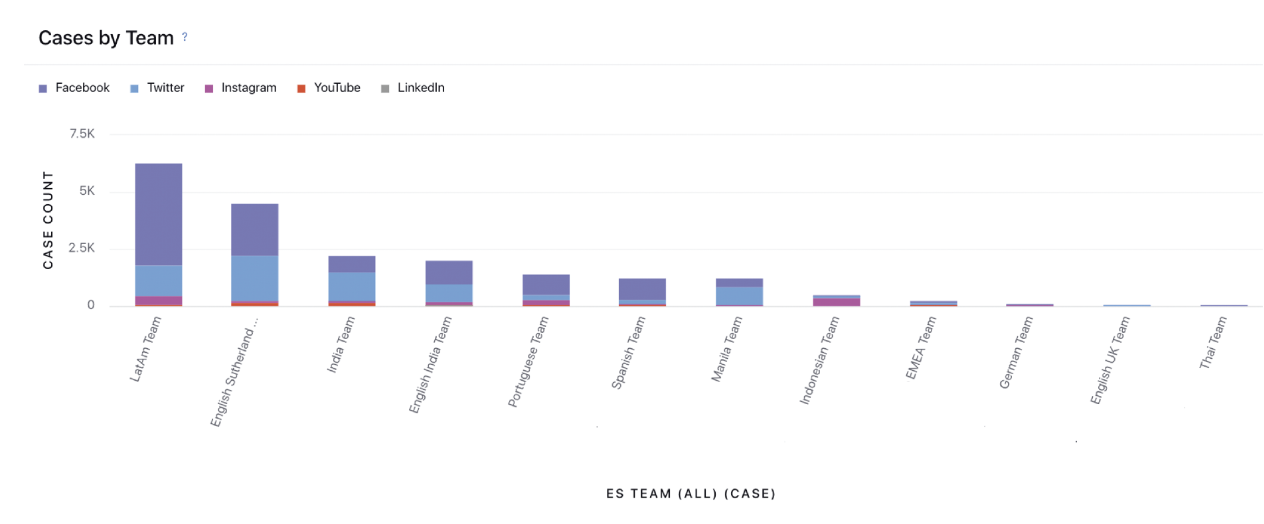
Cases by Team - Volume of Cases by Team. (Select Custom Field for the team)
Note - Select the team for which the performance needs to be tracked.
Cases by Status - Case count based on the current status of case for each team. (Select Custom Field for the status & the team)

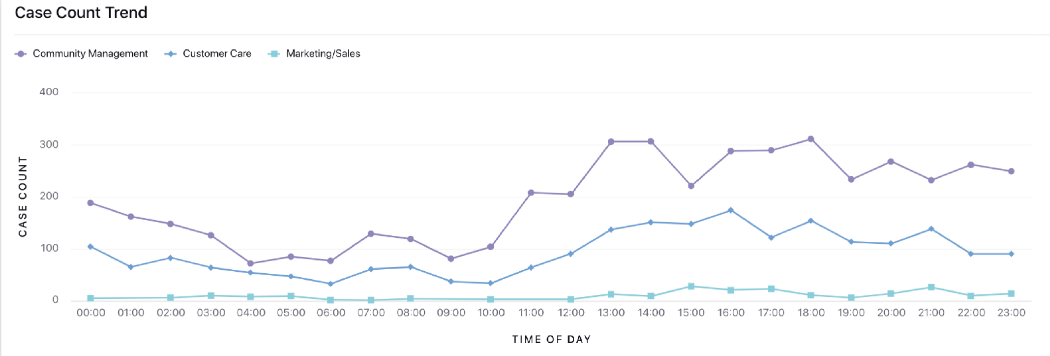
Case Count VS Time of Day - Case Count Trend. (Select Custom Field for the team)
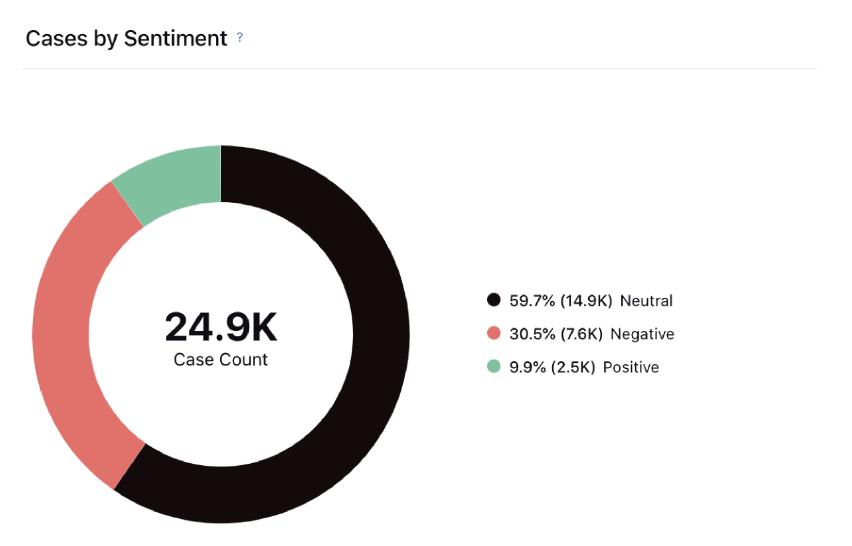
Cases by Sentiment - Case count based on the sentiment of cases.
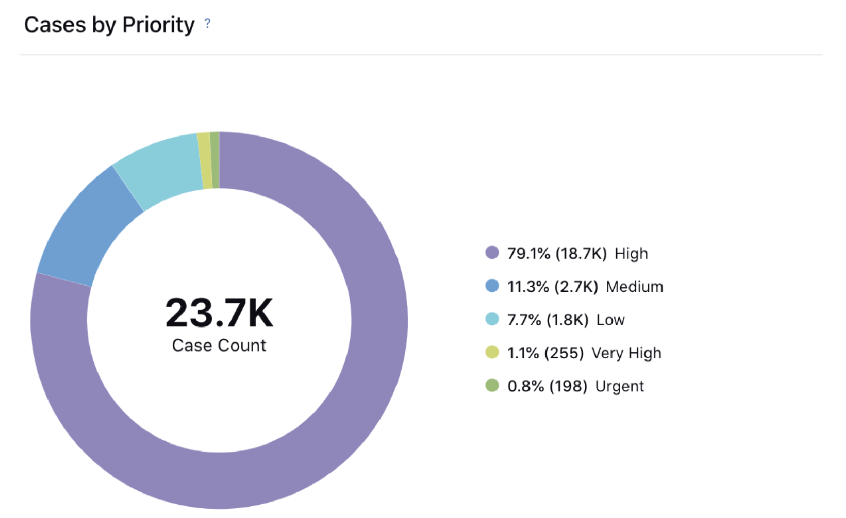
Cases by Priority - Case count based on the priority of cases.
SLA
The standard widgets available in the SLA tab are:
Case SLA Summary
Total Assigned Cases - Total number of unique cases assigned to a user within the given time frame. (If one case is assigned 3 times in a selected time frame then it will be counted as one unique case.)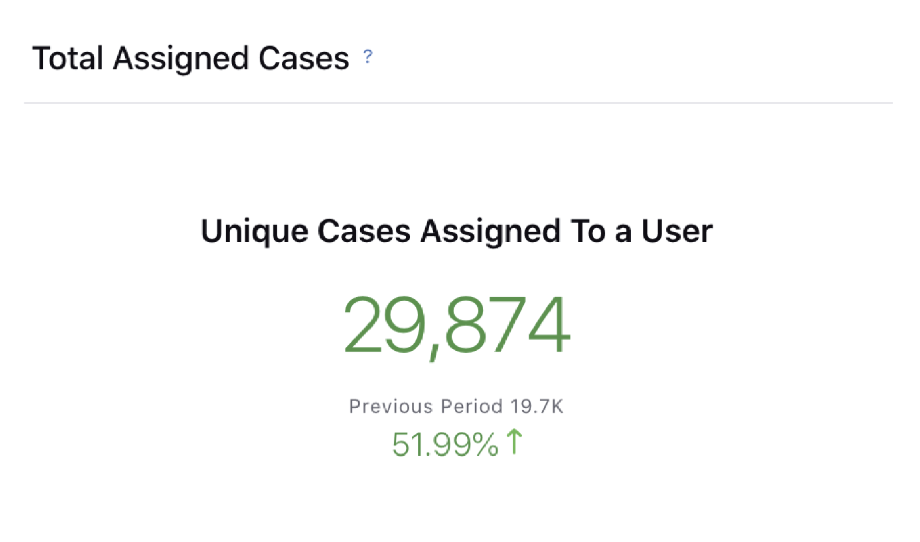
Avg. Case Handling Time - Amount of time spent by the assigned agent on the case.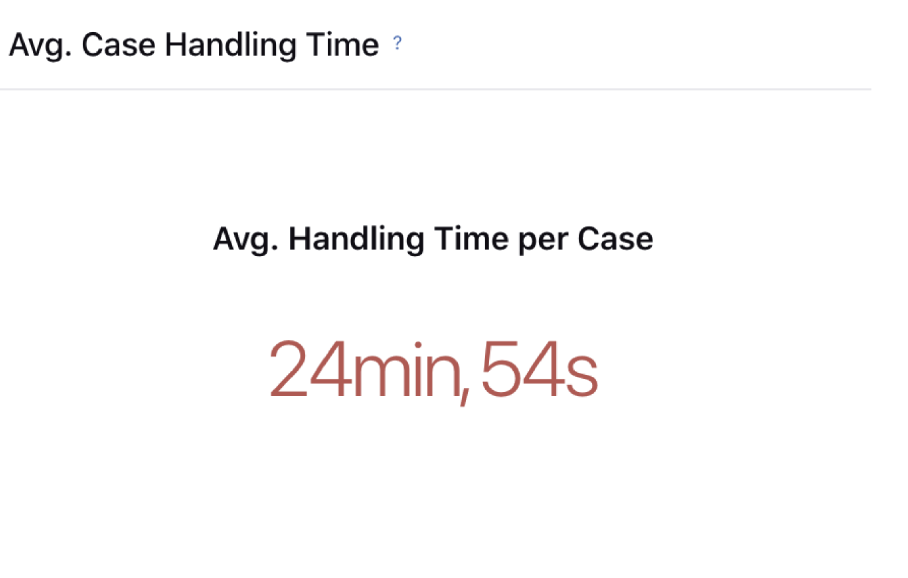
Avg. Case Duration - Average time taken to close a case from case creation.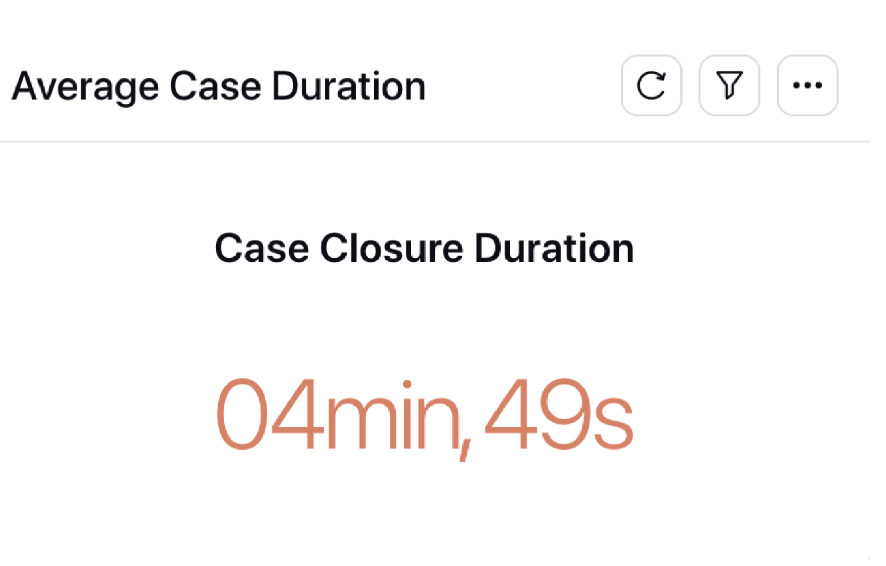
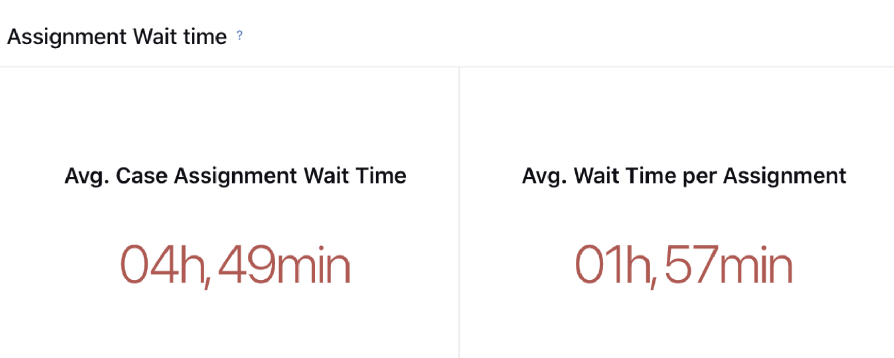
Average Case Assigned Wait Time
Average Case Action Time Duration - Time difference between the user assignment and the action time on a case (if a case goes through assignment 3 times, and the time difference between assignment and action is for 5 mins, 10 mins & 15 mins then Case Action Time Duration would be 30 mins for this case)
Case Action Time - Time difference between when a user was assigned a case and the user action time on the case per assignment (if a case goes through assignment 3 times, and the time between assignment and action is for 5 mins, 10 mins & 15 mins then Avg. Assignment wait time would be 10 mins for this case.)
Average Wait Time per Assignment
Case Assignment Wait Time - On average, how long cases wait in Awaiting Assignment queue to get assigned to a user (if a case goes through the assignment 3 times; waiting for 5 mins, 10 mins & 15 mins, then the Case Assignment Wait Time would be 30 mins for this case).
Wait Time per Assignment - On average, how long cases wait in Awaiting Assignment queue per assignment (if a case goes through the assignment 3 times; waiting for 5 mins, 10 mins & 15 mins, then the Case Assignment Wait Time would be 10 mins for this case).
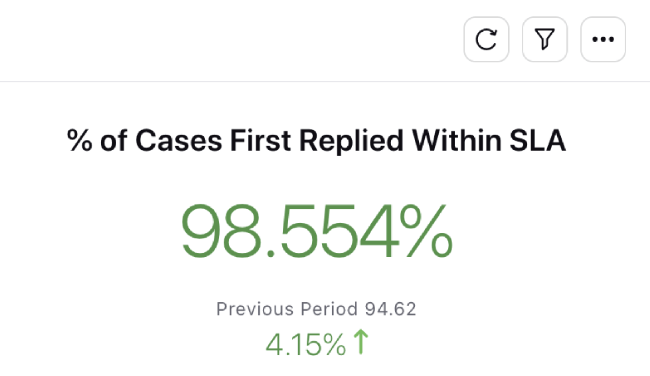
% Case replied within SLA (First Response) - % of cases first responded within SLA considering only user response.
% Case replied within SLA (Case Response) - % cases replied within SLA (Case Response).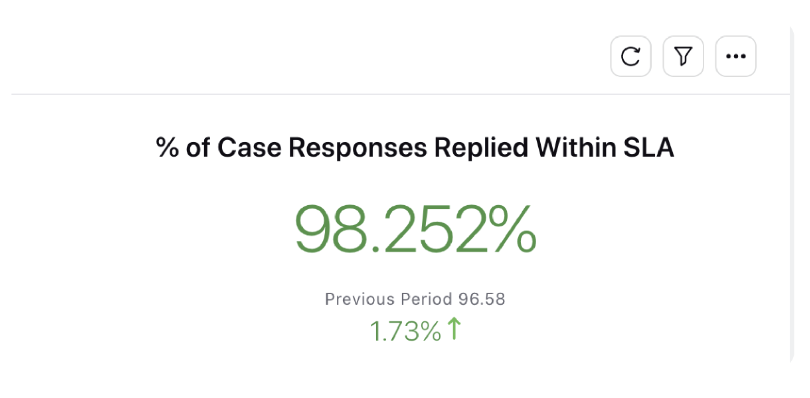
Issue Type VS Handling Time - Average Time Spent by Agent working on different issues.
Case Assignment SLA
This section gives you insight on waiting time before assignment across your various team, account & region, how does it change at different time during the day.
Case Assignment SLA - The time taken by a case in a queue before an agent is assigned to it.
(Time difference b/w when a customer requests for an agent to the agent assignment)
Case Waiting SLA- Time of the Day - Average time spent by the case waiting in the queue hourly trend.
(You can select Day or Day of Week to see the daily case waiting trend)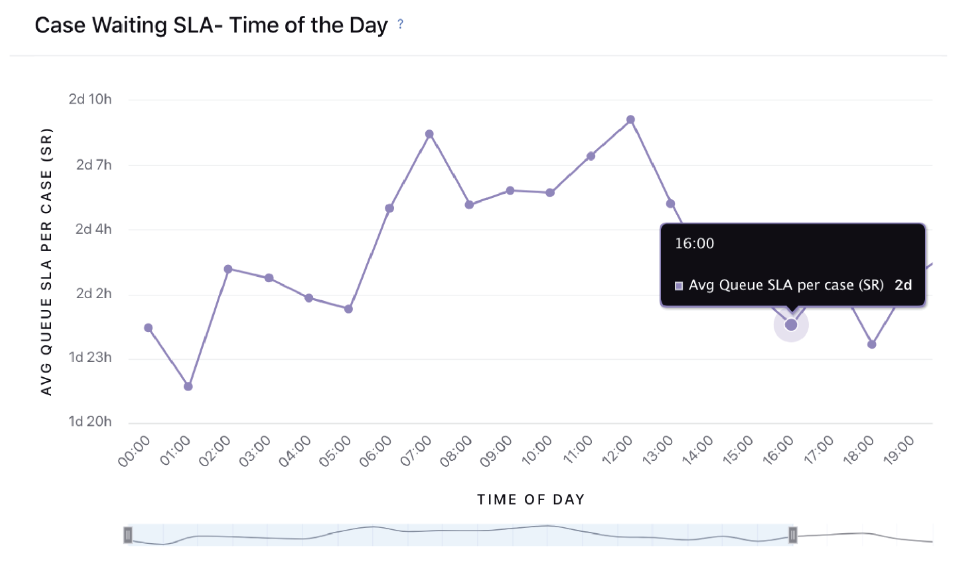
Case Waiting SLA by Team/Account/Region - On average, how long cases wait in Awaiting Assignment queue to get assigned to a user w.r.t. Account.
(In place of account, you can select a custom field for Team or Region as per the requirement.)
Case Waiting SLA - Date wise trend - Average time spent by the case waiting in the queue hourly trend.

Case Response SLA
Case Response & First Response SLA
Case Response SLA - It measures the time difference between the brand response and the last un-replied fan message.
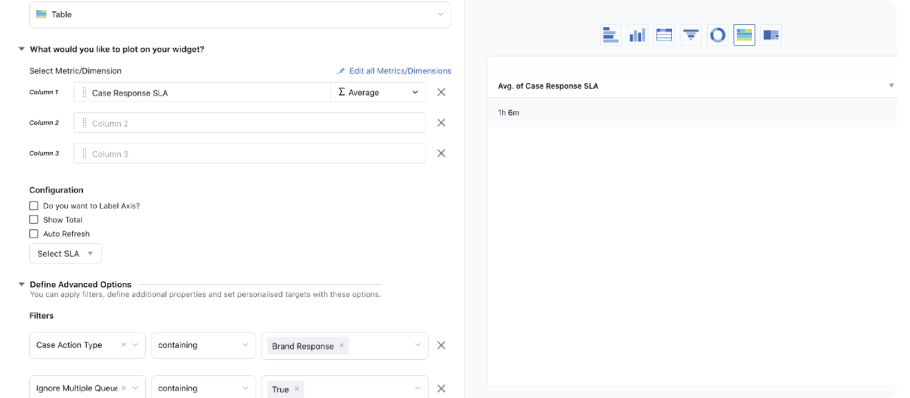
For example,
Fan: Hi there, I need help (at 16:00)
Brand: What can we do? (at 16:10)
In this case, the Case Response SLA would be 10 minutes.
Let’s take another example,
Fan: Hi there, I need help (at 16:00) - (A)
Brand: What can we do? (at 16:10) - (B)
Fan: I am not able to open your website. (at 16:20) - (C)
Brand: Let me check that quickly for you. (at 16:40) - (D)
In this case, there will be two records that you will get.
10 minutes: (16:10 of message B - 16:00 of message A)
20 minutes: (16:40 of message D - 16:20 of message C)
If you select “Average” of this metric, then the value would be = (10+20)/2 = 15 minutes
Let’s take one more example,
Fan: Hi there, I need help (at 16:00) - (A)
Brand: What can we do? (at 16:10) - (B)
Fan: I am not able to open your website. (at 16:20) - (C)
Brand: Let me check that quickly for you. (at 16:40) - (D)
Fan: Sure (at 16:50) - (E)
Fan: Thanks for this (at 17:00) - (F)
Brand: The website is up now. (at 17:10) - (G)
Fan: Thanks again (at 17:20) - (H)**
Note that message E doesn’t have a brand reply. Brand reply G was sent after E and F. Also, the last fan message H doesn’t have a brand response.
In this case, there will be three records created
10 minutes: (16:10 of message B - 16:00 of message A)
20 minutes: (16:40 of message D - 16:20 of message C)
20 minutes: (17:10 of message G - 16:50 of message E)*
* Here, for brand response G, the last un-replied fan message was E, not F. Hence, it is 17:10 - 16:50, instead of 17:10 - 17:00.
** For last message H, there is no brand response so this message is excluded from Case Response SLA calculation.
Case First Response SLA - It measures the time difference between the first fan message and the first brand message.
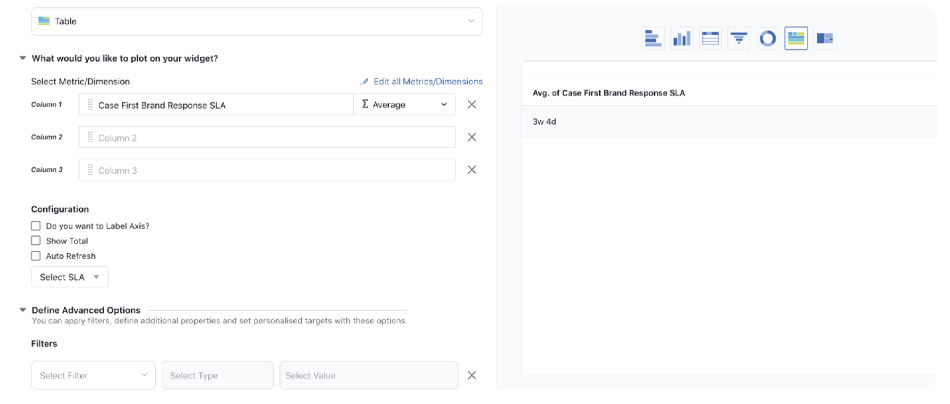
For example,
Fan: Hi there, I need help (at 16:00)
Brand: What can we do? (at 16:10)
In this case, the Case First Response SLA would be 10 minutes.
Tips
Use the "Brand Response by User" dimension to check SLA per user.
Use the "Brand Response by User" not containing System User/Moderation User to exclude auto-responses.
Avg Case Response SLA - It measures the time difference between the brand response (not including auto-responses) and the last un-replied fan message.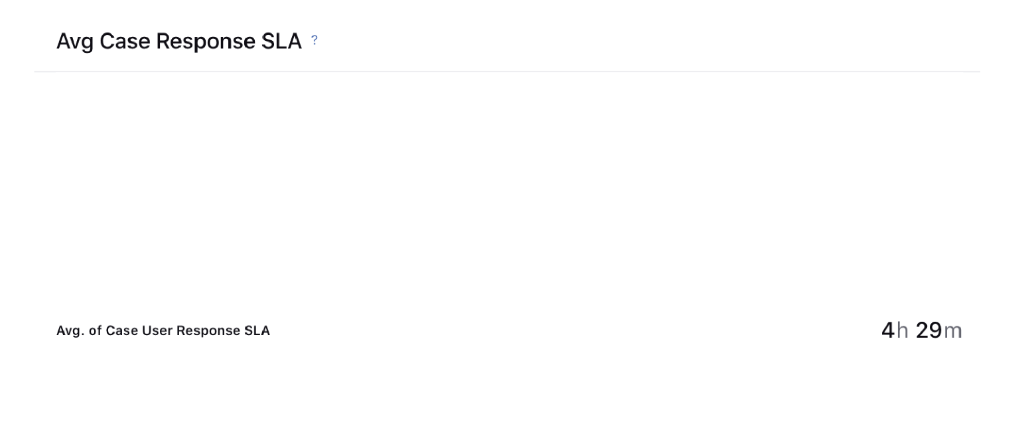
Avg Case First Response SLA - It measures the average time taken to make the first reply on the case based on action time.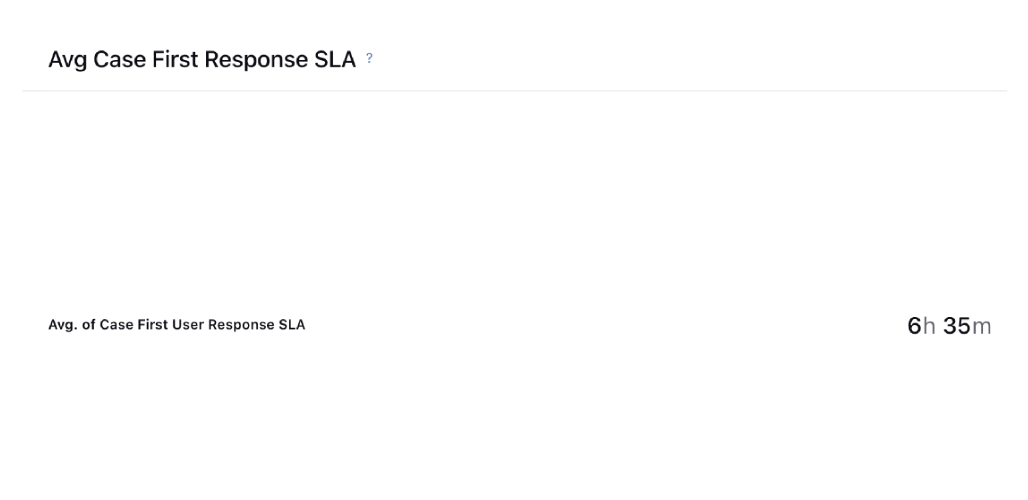
Avg Case First Response SLA- Time of Day - Average time taken for first response by user in the case.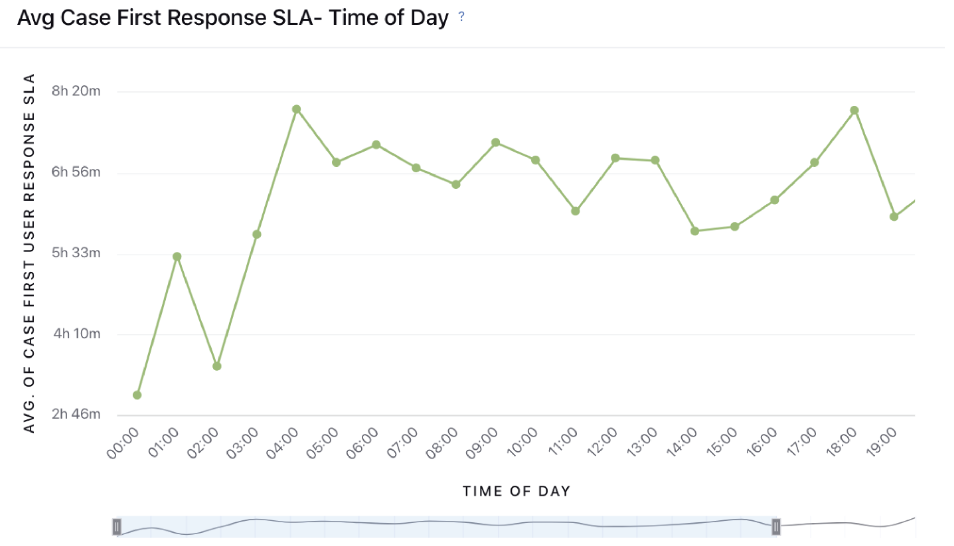
Avg Case Response SLA- Time of day - Average time taken for response by user in the case.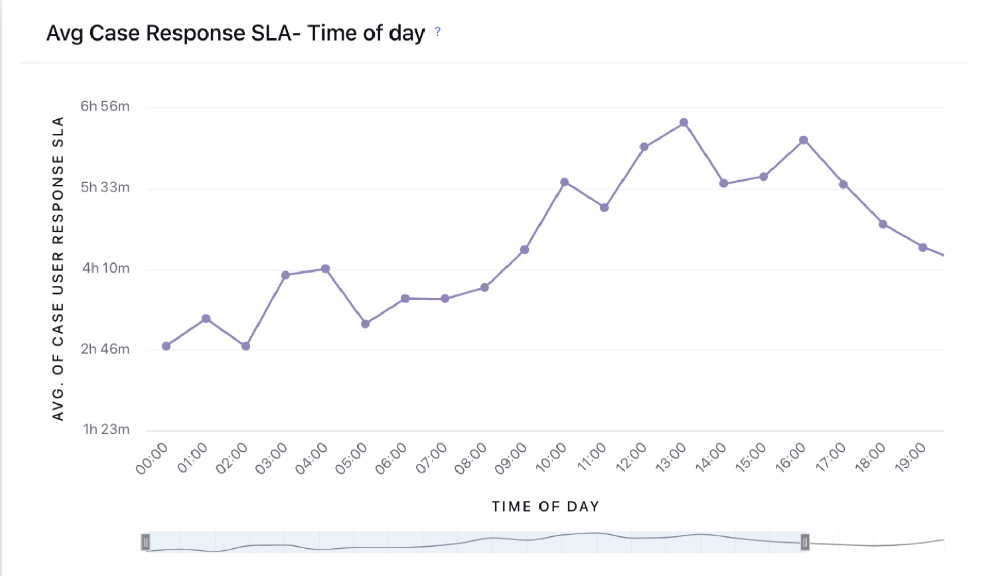
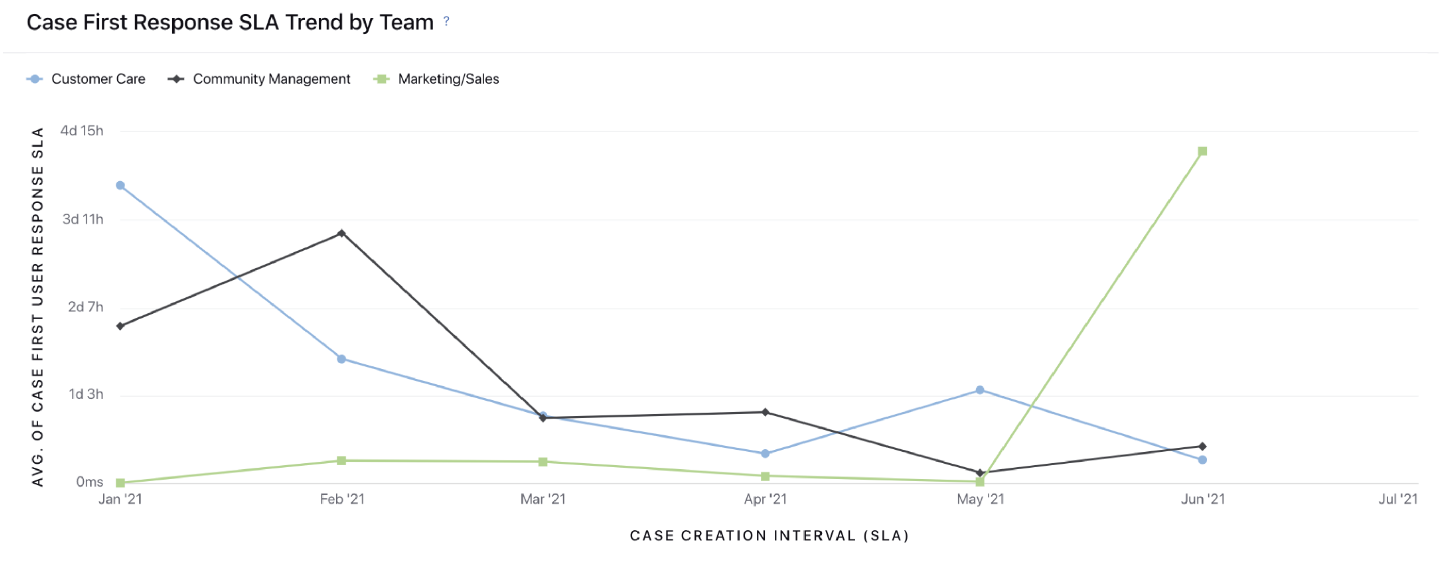
Case First Response SLA Trend by Team/Account/Channel - Average time taken for first response by user w.r.t. Team/Account/Channel.
Case Handle Time (Variant 1)
This section gives you insight on the time Agent spends on a case and how does it vary over time, case source channel, account & team.
Case Processing SLA - Time for which agent was working on case (which is when the Agent had the Case open in Agent Console).
Average Processing Time by Assignee - Average time agents spent viewing a case that was assigned to them.
Average Processing Time by All User - Average time spent viewing a case irrespective of whether it was assigned to them or not.
Average Processing Time by Assignee - Average time agents spend viewing a case and the total number of cases for which the processing clock starts.
Average Processing Time By Time of Day - Average time spent between the assignment and action time on daily basis.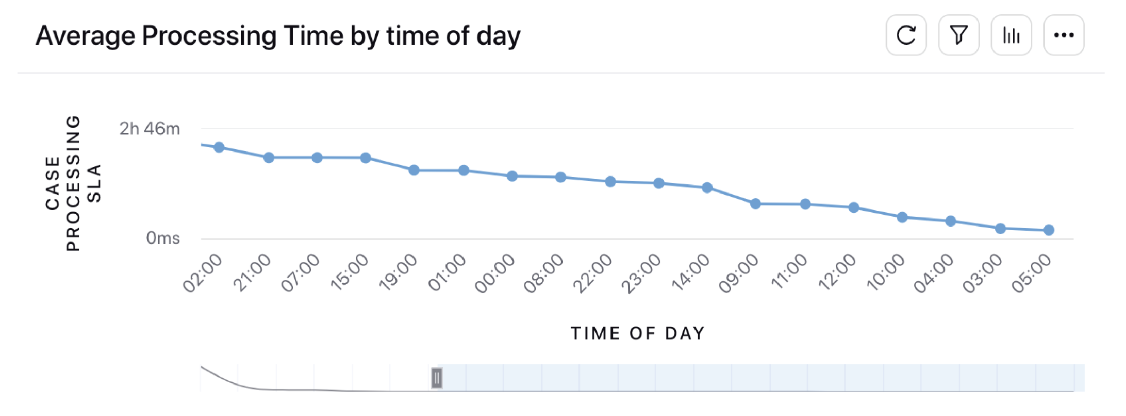
Case Handle Time (Variant 2)
Average Processing Time - By Team/Account/Channel - Average time agents spend viewing a case w.r.t. Team/Account/Channel.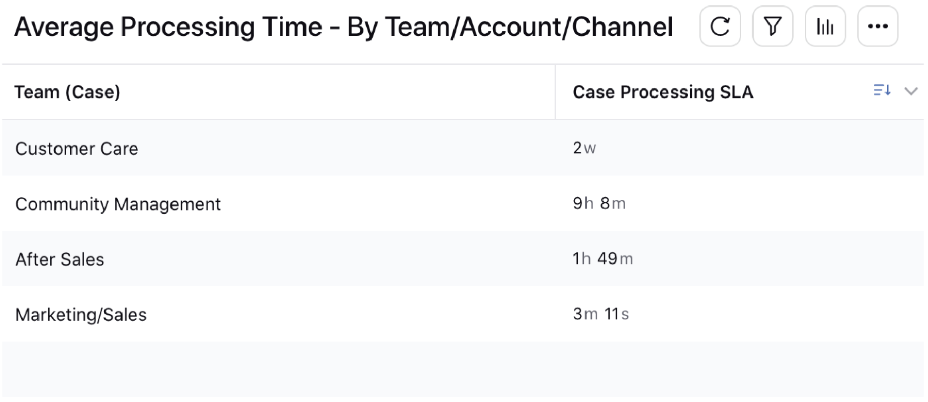
Case Handle Time - Assignment to Brand Response - Average time taken by the Agent handling the case - from assignment to Brand Response.
It measures the time difference between Assignment Time and Brand Response.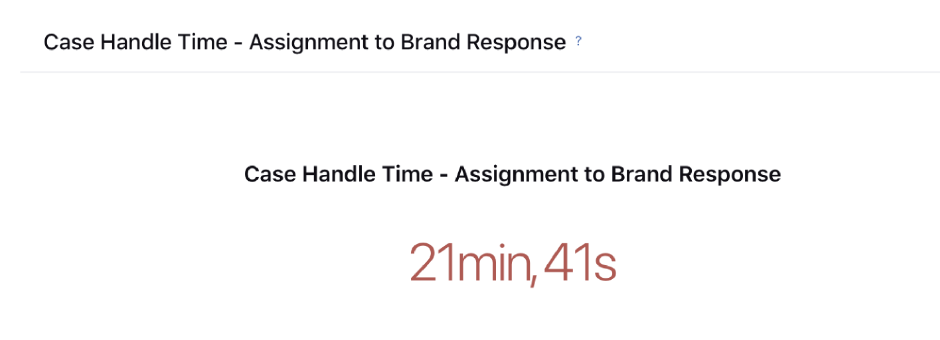
Case Handle Time - Team Performance/ Channel/ Account- Brand Response - Average time taken from assignment to response w.r.t. Team/Account/Channel.
Team/Account/Region Performance w.r.t to Case Processing Time.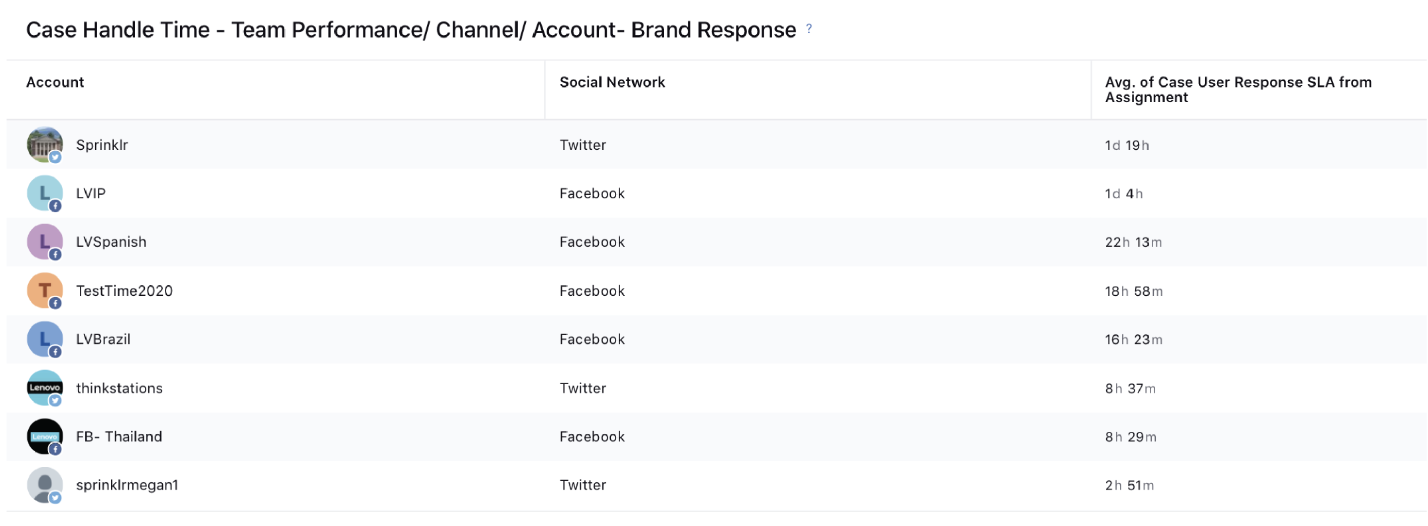
Average total case handling time - Brand Response - Average time spend between assignment to response on daily basis.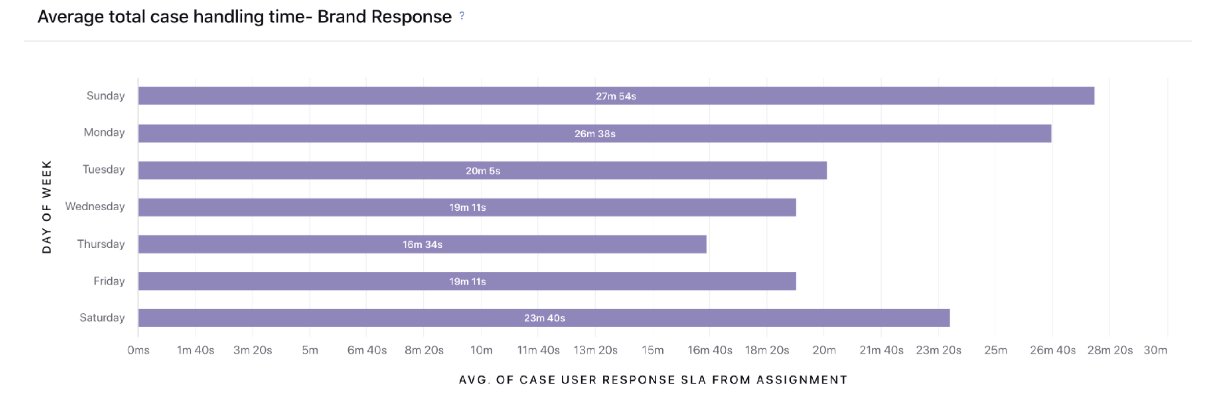
Case Handle Time (Variant 3)
Case Handle Time - Assignment to Unassignment - Average time taken from assignment to Unassignment.
It measures the avg. time b/w assignment to the un assignment on a case.
Case Handle Time - Team Performance Unassignment - Average time taken from assignment to Un-Assignment corresponding to the Team.
Team/Account/Region Performance w.r.t to Case Handling Time Assignment to Un-assignment.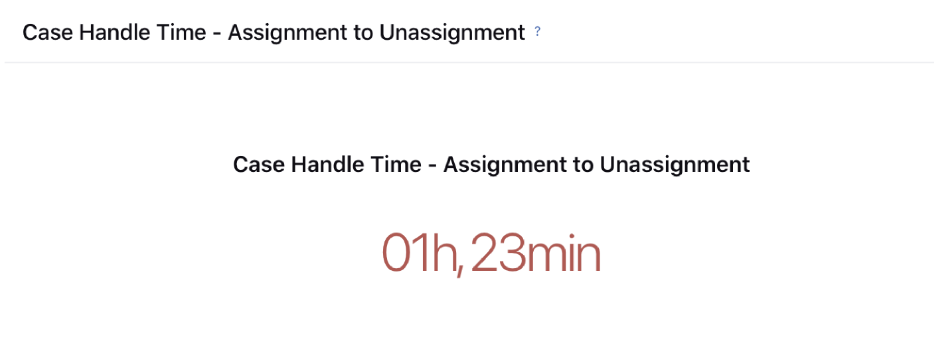
Average total case handling per day - Unassignment - Average time between the Assignment and Un-assignment on daily basis.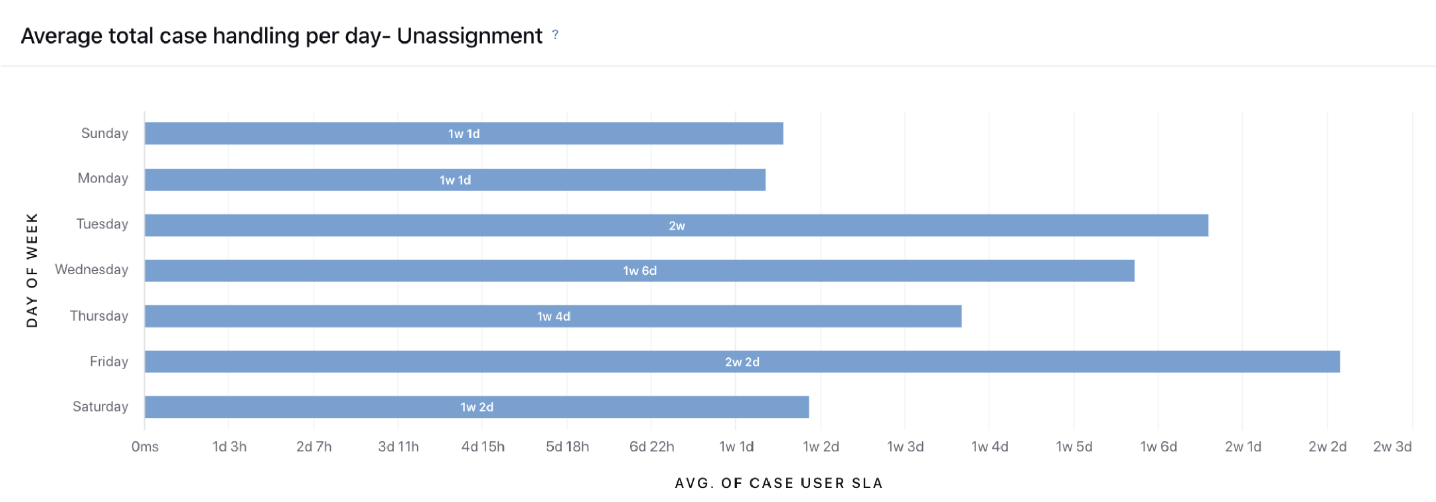
Case Queue SLA
This section gives you insight on waiting time in various Queues including Awaiting Assignment, Assigned Queue, Escalation Queue, Internal Hold Queue.
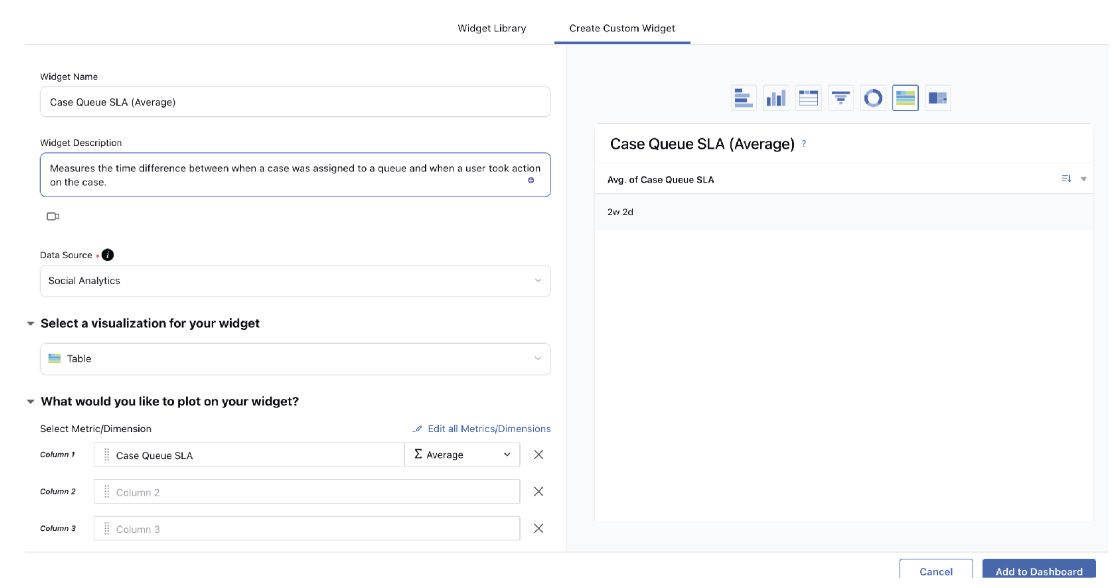
Case Queue SLA (Average): Measures the time difference between when a case was assigned to a queue and when a user took action on the case. Use this metric in conjunction with the Case Action Type filter which can be Brand Response, Queue Removal, etc. Broken down by average.
Awaiting Assignment - Queues for cases in which Agent is yet to be assigned.
Escalation Queue - Queue for Escalated Cases.
Internal Hold Queue - Queue for cases that Agents put on hold.
Awaiting Assignment - Average time spent by a case in Awaiting Assignment queue.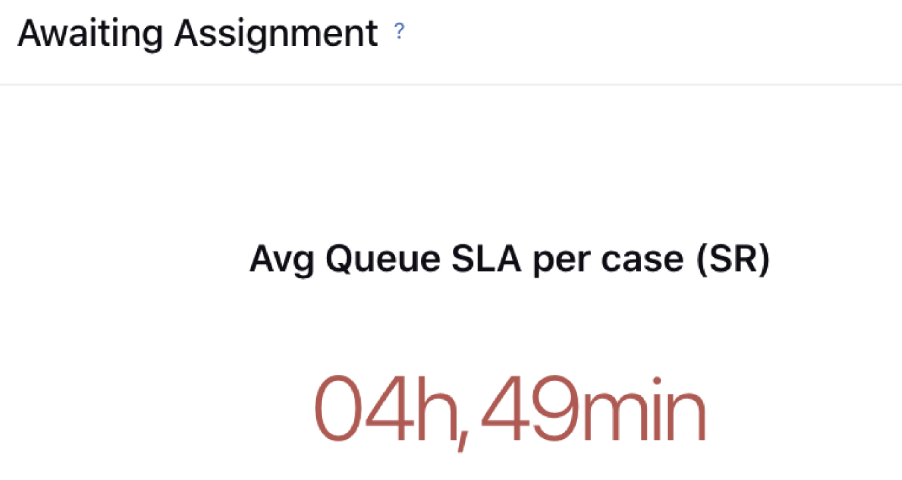
Escalated Queue - Average time spent by a case in Escalated queue. 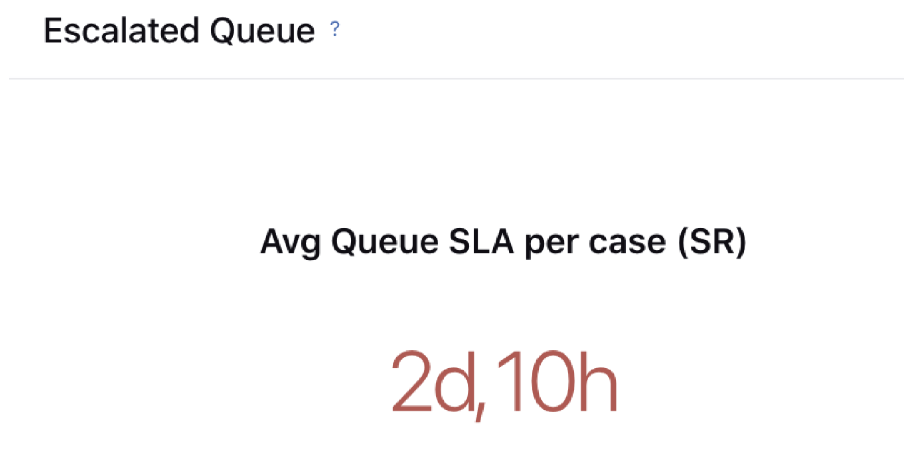
Internal Hold Queue - Average time spent by a case in Internal Hold queue.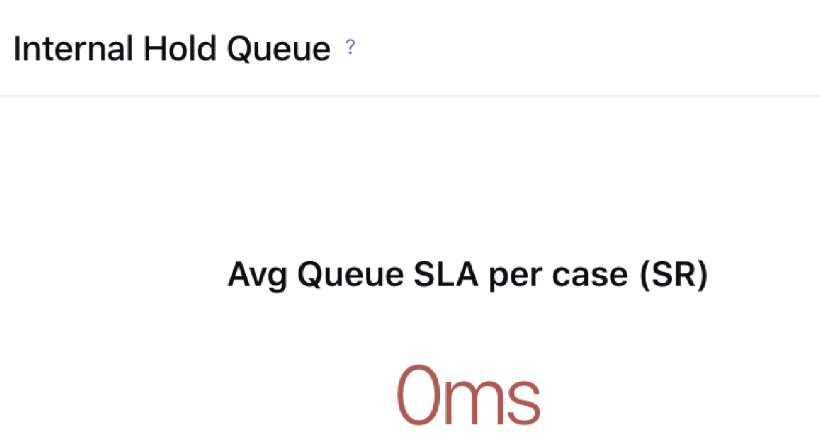
Case Macro SLA
Macro Application SLA by Macro type - from Assignment - It represents the total number of times a macro was applied to a case. Avg. time to apply macro represents the time taken to apply macro from assignment time. If the case was not assigned when the macro was applied it will consider from case creation time.
Macro: Name of the Macro used.
Case Macro Usage Count (SUM): The number of times a macro was applied to a case.
Avg. Time to Apply Macro: Time taken to apply macro from assignment time. If the case was not assigned when the macro was applied, it will consider the case creation time.
Case Macro SLA from Assignment (Case): Average Time Taken to apply a macro on a case. If the same macro is applied multiple times on a case, it gives an average of the time to apply that macro from assignment.
For eg. - If Awaiting Response Macro is applied after 10 mins, then again it is applied after 20 min from case assignment, then Case Macro SLA from Assignment (Case) will show 15 mins.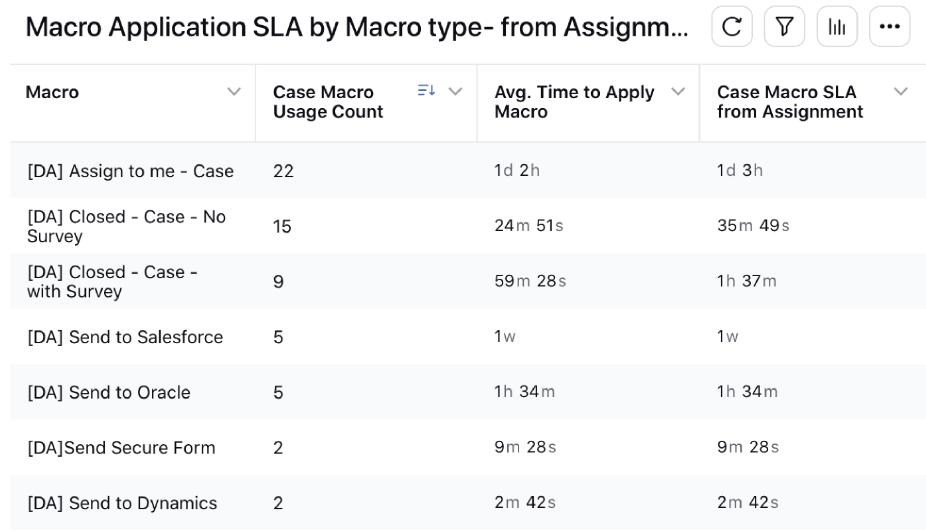
Macro Application SLA by Macro type - Team - from Assignment - It represents the total number of times a macro was applied to a case. Avg. time to apply macro represents the time taken to apply macro from assignment time. If the case was not assigned when the macro was applied it will consider from case creation time.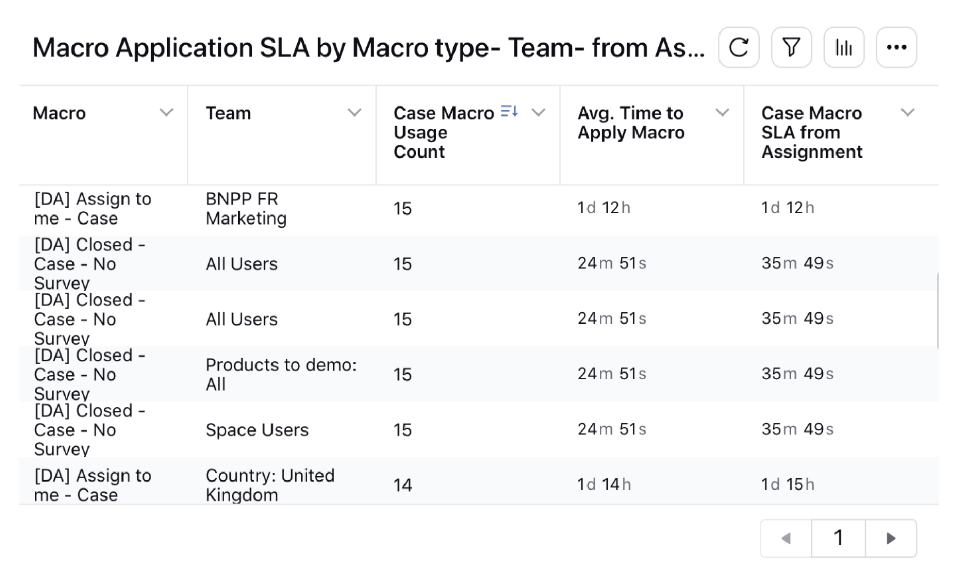
Macro Application SLA by Case Assignment - Time taken to apply macro from Case Creation.
Agent Performance
The standard widgets available in the Agent Performance tab are:
Case Metrics
Agents in Different Status - Total number of agents in different statuses.
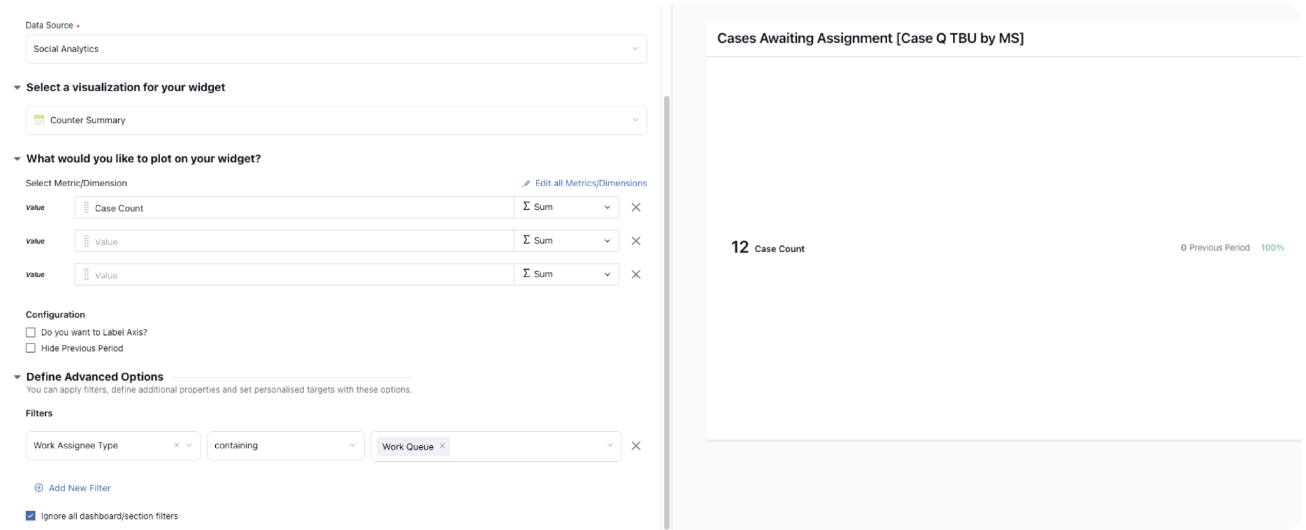
Cases Awaiting Assignment - Cases waiting in the queue for agent assignment.
Current Assigned Cases - Total cases currently assigned to agents.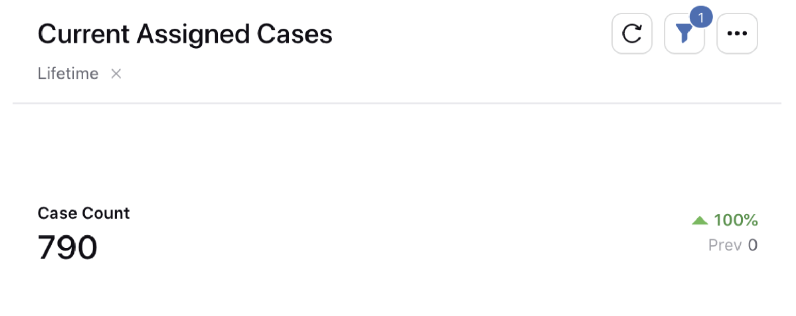
Measures the total cases currently assigned to an agent.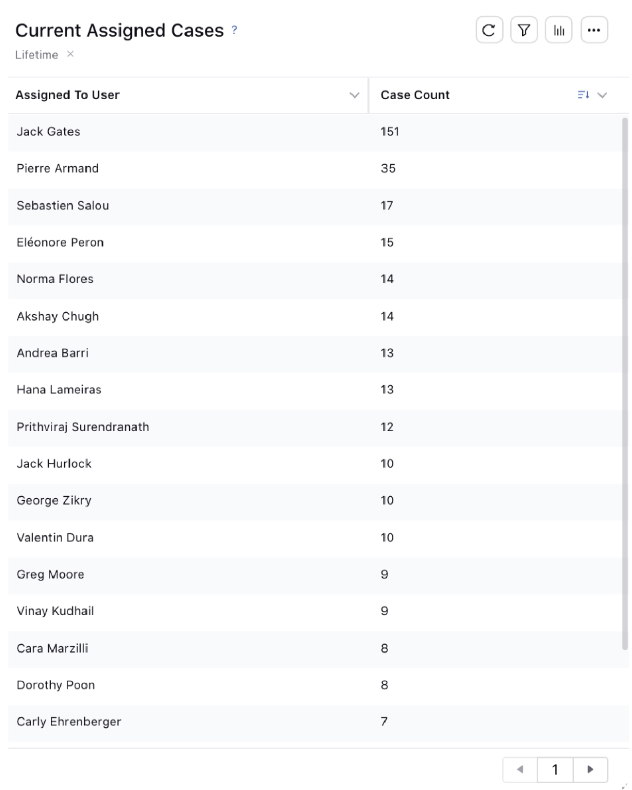
Average Case Wait Time - How long case rests in Awaiting Assignment queue.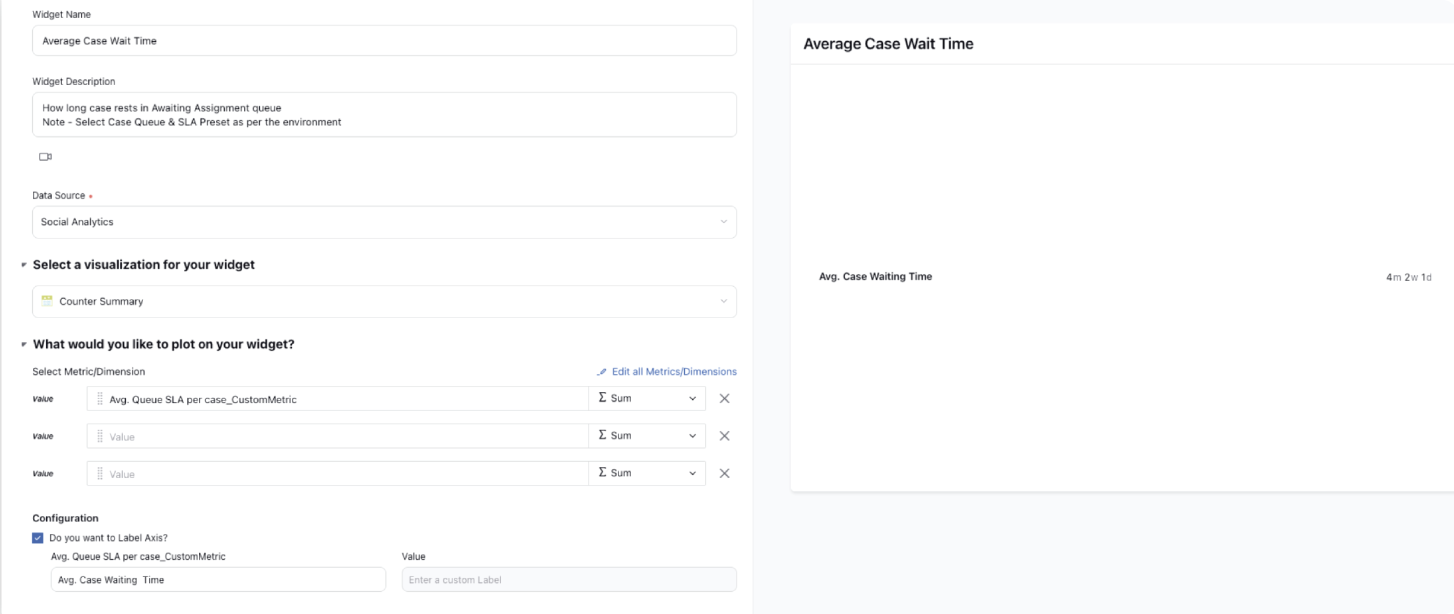
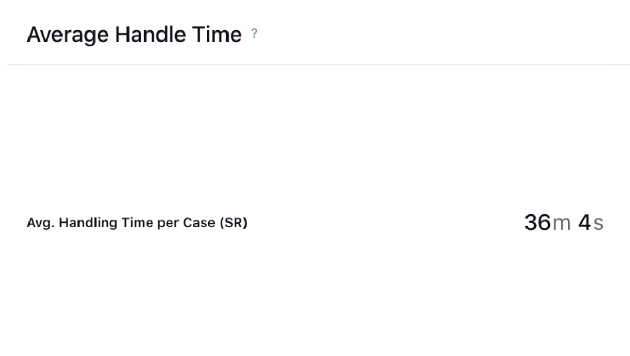
Average Handle Time - How long an agent was working on the case i.e. how long the processing clock was running.
Total Case Assignments - Measures the total cases (created in the time filter) assigned to a user.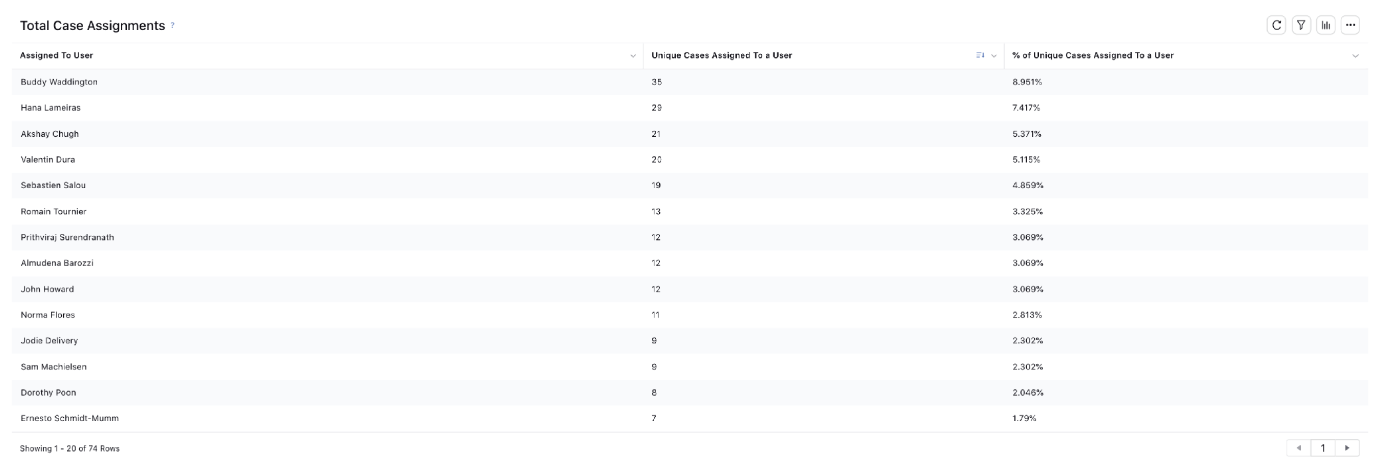
Agent Performance
Top Agents by Reply Time - List of agents sorted by minimum reply time.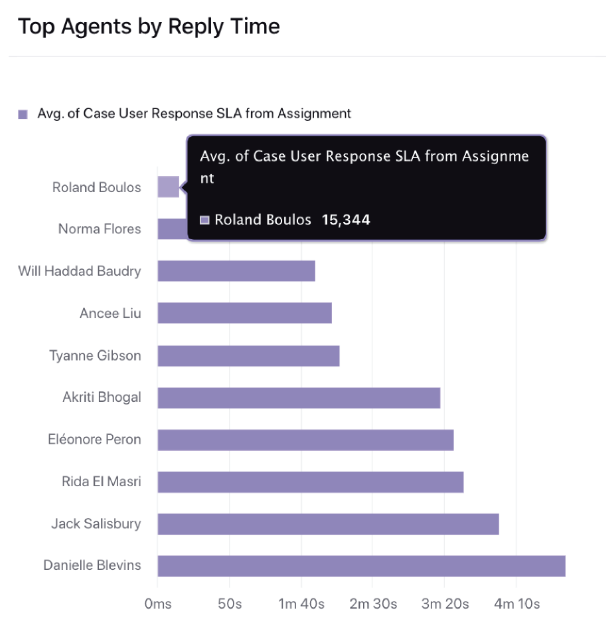
Top Agents by Case Macro count - List of agents sorted by macro usage count.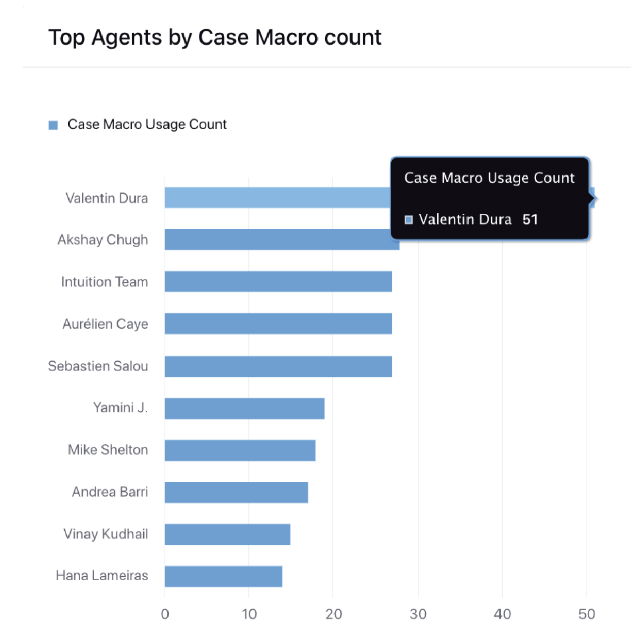
Top Agents by No. of Replies - List of agents sorted by max number of replies.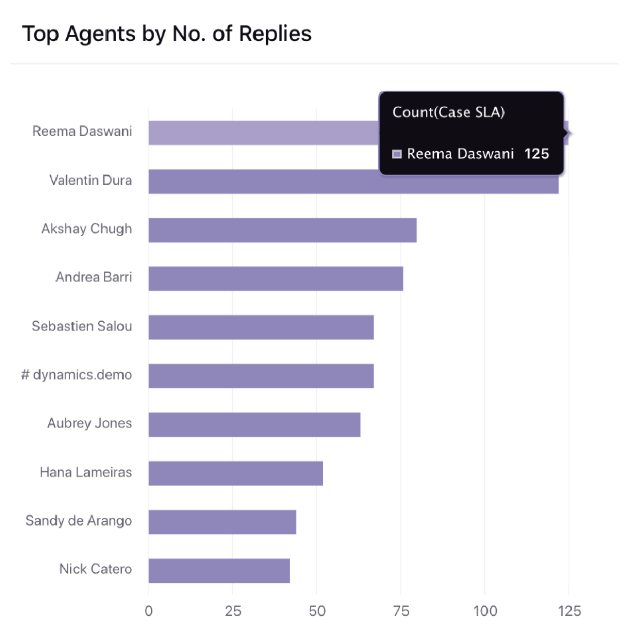
Worst Agents by Case Hold Up time in Queue (Max Time to Macro) - Avg. time taken by an agent to apply Macro from case assignment.
Agent Productivity (w/ Availability and Case Assignments) - This widget differs from "Agent Productivity" widgets; it takes into account the amount of time an agent spent in "Available" status, in addition to Case Count and Macro Application.
Unique Macro Usage Count - Unique number of Macros applied by Agent/Agent Group.
Case Macro Usage Count - Number of Macros applied by Agent/Agent Group.
No. of replies made by User - Number of replies made by Agent/Agent Group.
Login Time - Total logged-in time of Agent.
Case Assignment duration - Total time for which any case was assigned to an agent.
Agent Productivity - (Case Macro usage Count + No. of replies made by the user)/Case Assignment Duration
Agent Productivity by Team - Agent vs. all the metrics linked to Agent Productivity.
Productivity Macro Usage Count (Visualization/Use Case) - Various macro usage trends over time.

Agent SLA Report - Select the SLA Preset.
Volume of fan messages replied within SLA - Total number of fan messages replied within configured SLA threshold.
Volume of fan messages replied outside SLA - Total number of fan messages replied outside configured SLA threshold.
% Volume of fan messages replied within SLA - % of total fan messages replied within configured SLA threshold.
Volume of private fan messages replied - Total number of private fan messages replied.
Volume of public fan messages - Total number of public fan messages replied.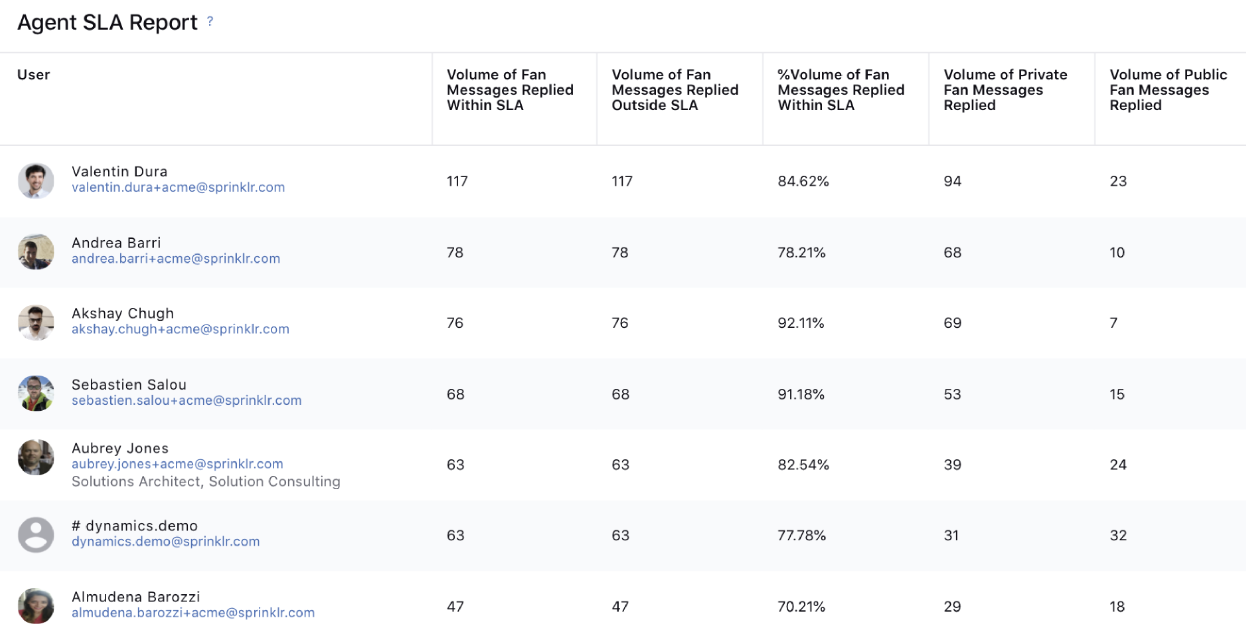
Cases replied within SLA by Agent Group - Use SLA Preset for SLA configurations & filter Agent Group as per requirement.
Agent VS Handling Time per Case - Handling time and number of cases handled by each agent.
Agent Response SLA - Agents and their Case User Response & Case First User Response Time.
Case Response SLA - It measures the time difference between the brand response and the last un-replied fan message.
For example,
Fan: Hi there, I need help (at 16:00)
Brand: What can we do? (at 16:10)
In this case, the Case Response SLA would be 10 minutes.
Let’s take another example,
Fan: Hi there, I need help (at 16:00) - (A)
Brand: What can we do? (at 16:10) - (B)
Fan: I am not able to open your website. (at 16:20) - (C)
Brand: Let me check that quickly for you. (at 16:40) - (D)
In this case, there will be two records that you will get.
10 minutes: (16:10 of message B - 16:00 of message A)
20 minutes: (16:40 of message D - 16:20 of message C)
If you select “Average” of this metric, then the value would be = (10+20)/2 = 15 minutes
Let’s take one more example,
Fan: Hi there, I need help (at 16:00) - (A)
Brand: What can we do? (at 16:10) - (B)
Fan: I am not able to open your website. (at 16:20) - (C)
Brand: Let me check that quickly for you. (at 16:40) - (D)
Fan: Sure (at 16:50) - (E)
Fan: Thanks for this (at 17:00) - (F)
Brand: The website is up now. (at 17:10) - (G)
Fan: Thanks again (at 17:20) - (H)**
Note that message E doesn’t have a brand reply. Brand reply G was sent after E and F. Also, the last fan message H doesn’t have a brand response.
In this case, there will be three records created
10 minutes: (16:10 of message B - 16:00 of message A)
20 minutes: (16:40 of message D - 16:20 of message C)
20 minutes: (17:10 of message G - 16:50 of message E)*
* Here, for brand response G, the last un-replied fan message was E, not F. Hence, it is 17:10 - 16:50, instead of 17:10 - 17:00.
** For last message H, there is no brand response so this message is excluded from Case Response SLA calculation.
Case First Response SLA - It measures the time difference between the first fan message and the first brand message.
For example,
Fan: Hi there, I need help (at 16:00)
Brand: What can we do? (at 16:10)
In this case, the Case First Response SLA would be 10 minutes.
Tips
Use the "Brand Response by User" dimension to check SLA per user.
Use the "Brand Response by User" not containing System User/Moderation User to exclude auto-responses.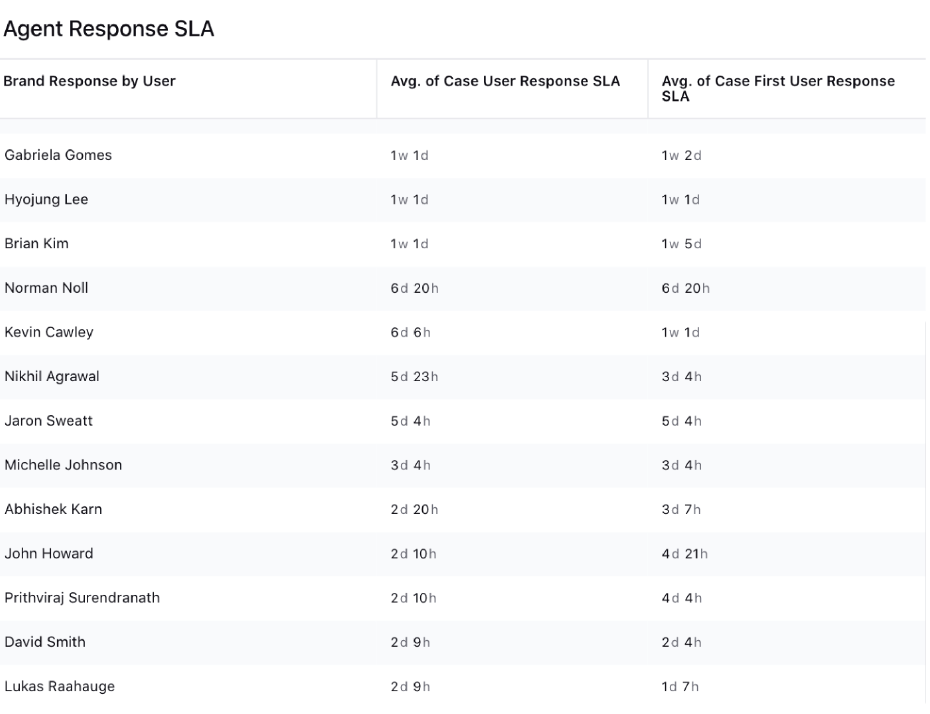
Time Spent Without Case Assignments - It gives details about Agent's productive and non-productive hours, total time in login, time in available with any case assigned & idle time (time spent without any case assigned).
Survey VS Survey Sent and Completed Count - Survey and its sent and completed count by customers.
Agent Availability
Note - On multiple widgets, where you see a date mentioned at the top of the widget, we have applied a Time Filter for due to which you will not be able to apply the dashboard filter on them. Remove the Time Filter to apply the dashboard filter or change it to view data for other dates.
Click the Options icon in the top right corner of the widget and select Time and Time Zone Filter. Next, select the desired Date Range and click Apply.
The standard widgets available in the Agent Availability tab are:
Agents in Different Status - Count of agents in different statuses.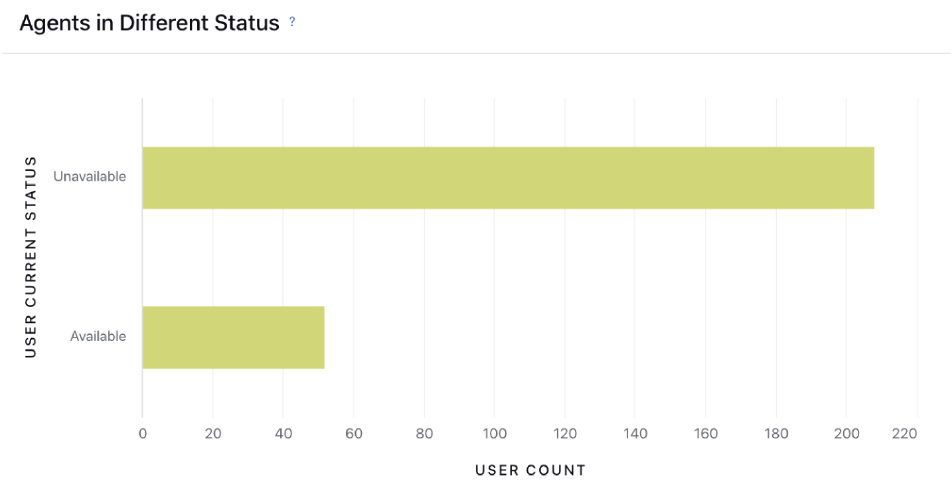
% Time Spent in Different Status - The percentage distribution of agents' time spent in different statuses.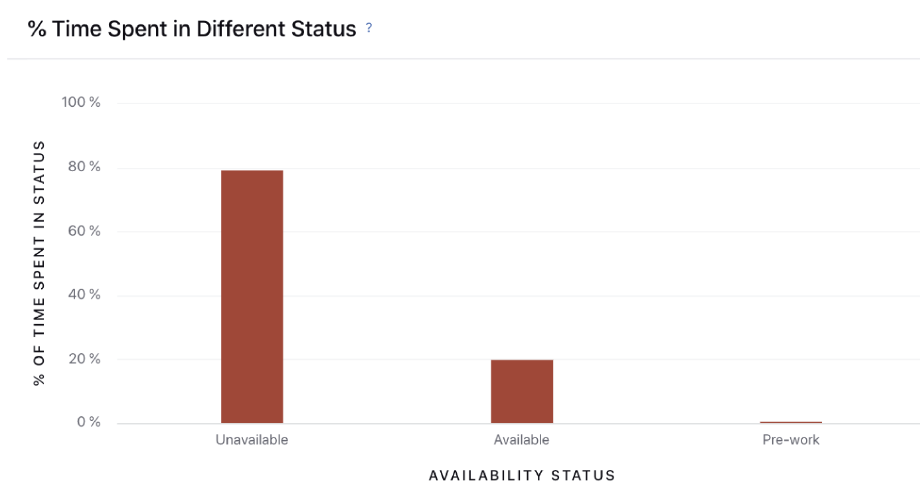
Agent Availability Status Logs - The time spent by agents in different statuses with the status assignment and removal time. 
Time in status - Time spent by agents in different statuses.
Agent Login-Logout Time History - Login-Logout history of agents. Note that if an agent logins multiple times in a day then multiple records will be created for that day.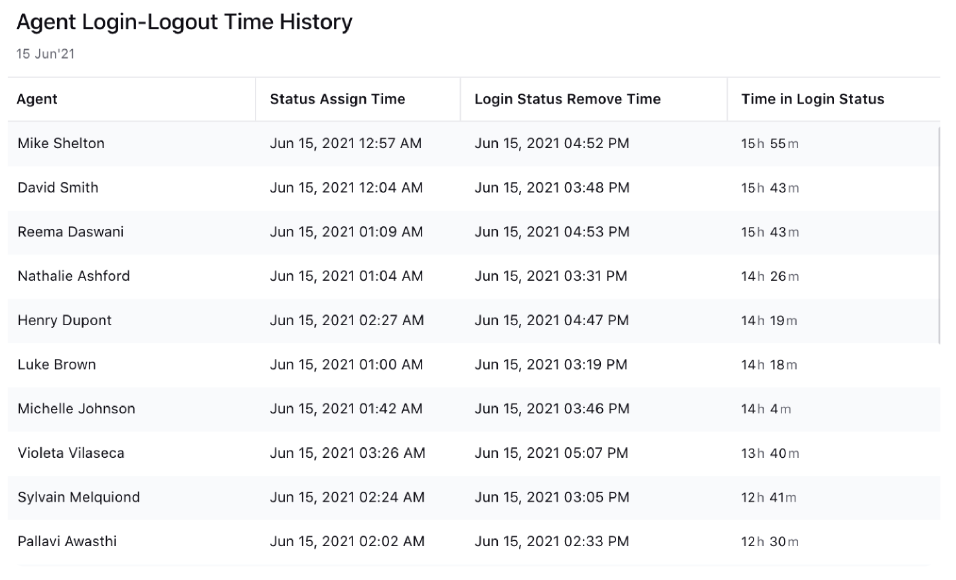
Logged in/ Logged out status - Total time spent by an agent in logged in and logged out status. If an agent logins multiple times in a day, it will show the sum of total time spent in all the sessions.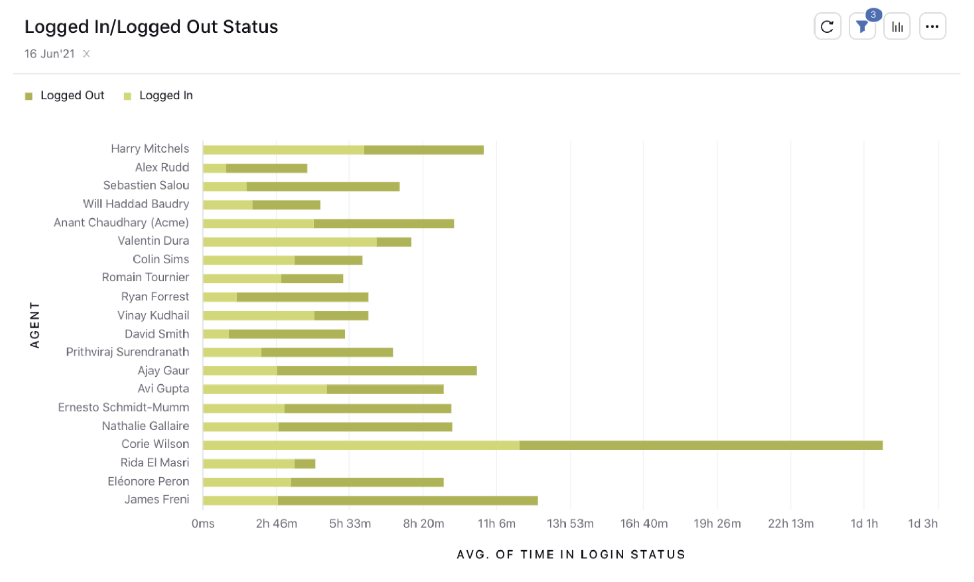
Agent VS % Occupancy & % Availability
% Occupancy - Gives productive hours of agents (Time spent with any case assigned/Time for which an agent was in Available state).
% Availability - Time for which an agent was in Available state/Total logged in time.
Agent Availability over time - Average number of agents available at different hours during the day.
FAQs
Q1. How to get Standard Care dashboards added for any Partner?
Ans. You need to raise a request to the support team via Success Manager or Managed Services team.
Q2.Are these widgets ready to use or do the Standard Care dashboards need any customization?
Ans. Most of the widgets are ready to use, but some widgets need to be customized based on the workflow such as queues and macros specific to the partner. You can edit the widgets within the dashboard as per your requirements.
Q3. Can we add more widgets or take some widgets from the standard care dashboards and add them to existing dashboards?
Ans. Yes, the standard care dashboard can serve as a reference or can be built upon.
