Creating Custom Metrics in Reporting
Updated
Similar to the standard metrics used in reporting Widgets, you can create your own metrics across all reporting dashboards within Sprinklr. You can use these metrics to collect and analyze data that reporting doesn't automatically track. Custom metrics offer much more dynamic reporting capabilities such as non-standard engagement calculations, cross-channel metrics, and more. In this article, we will be explaining how to manage custom metrics in Reporting.
Custom Metric Examples
Custom Metric | Metric |
Average Case Handle Time | Case Processing SLA / Unique Processing Case Count |
Call Answer Rate | Number of calls taken / Number of calls offered |
Average Macro used per case | Case Macro Usage Count / Unique Case Macro Usage Count |
To Create a Custom Metric
Click the New Tab icon '+' . Under the Sprinklr Service tab, click Reporting within Analyze.
On the Reporting Dashboard window, click the Settings icon at the top and choose Custom Metrics.
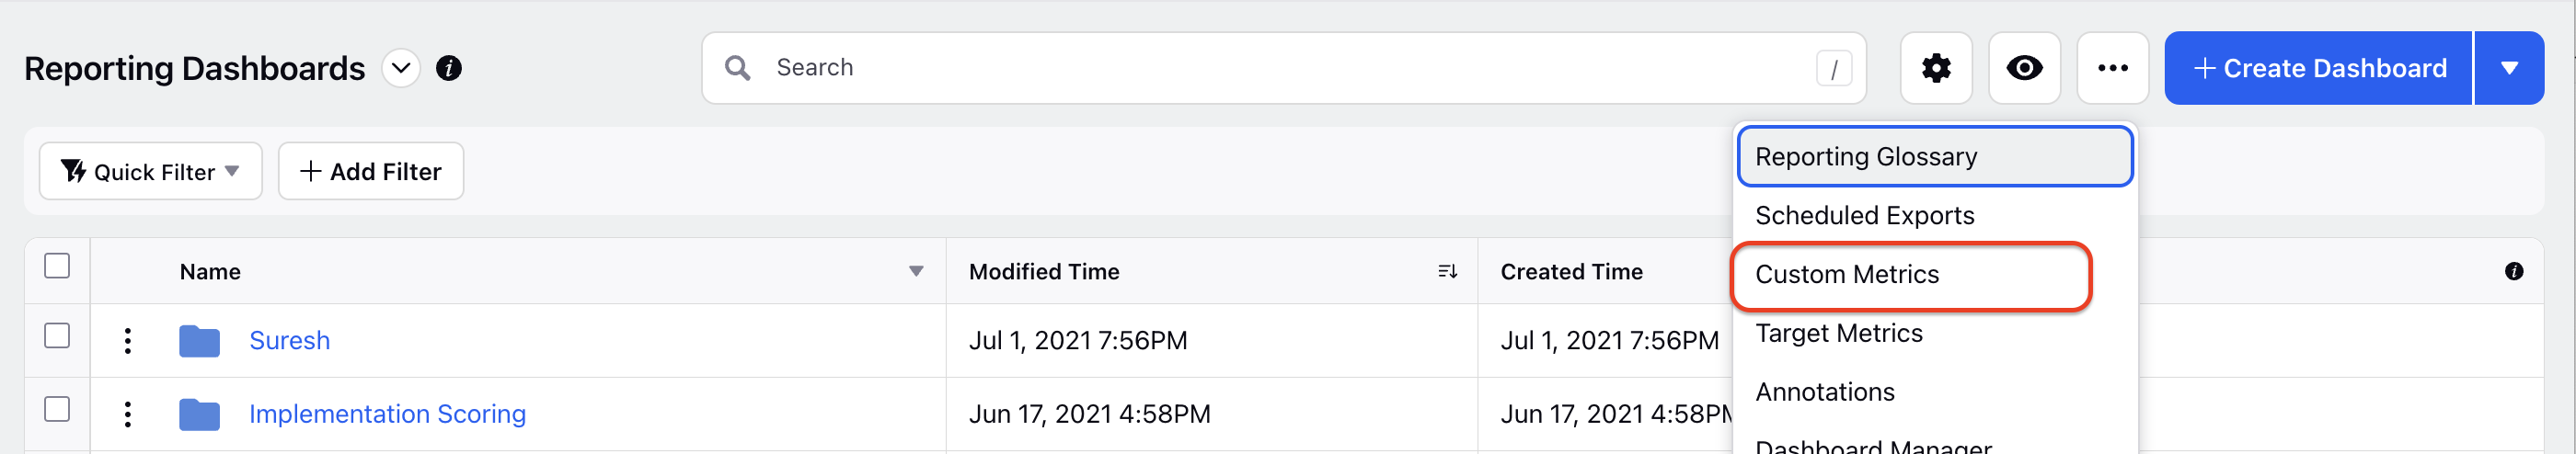
On the Custom Metrics window, click Add Custom Metric in the top right corner. If this is your first custom metric, then you will have an option to click Create Now at the center of the Custom Metrics window.
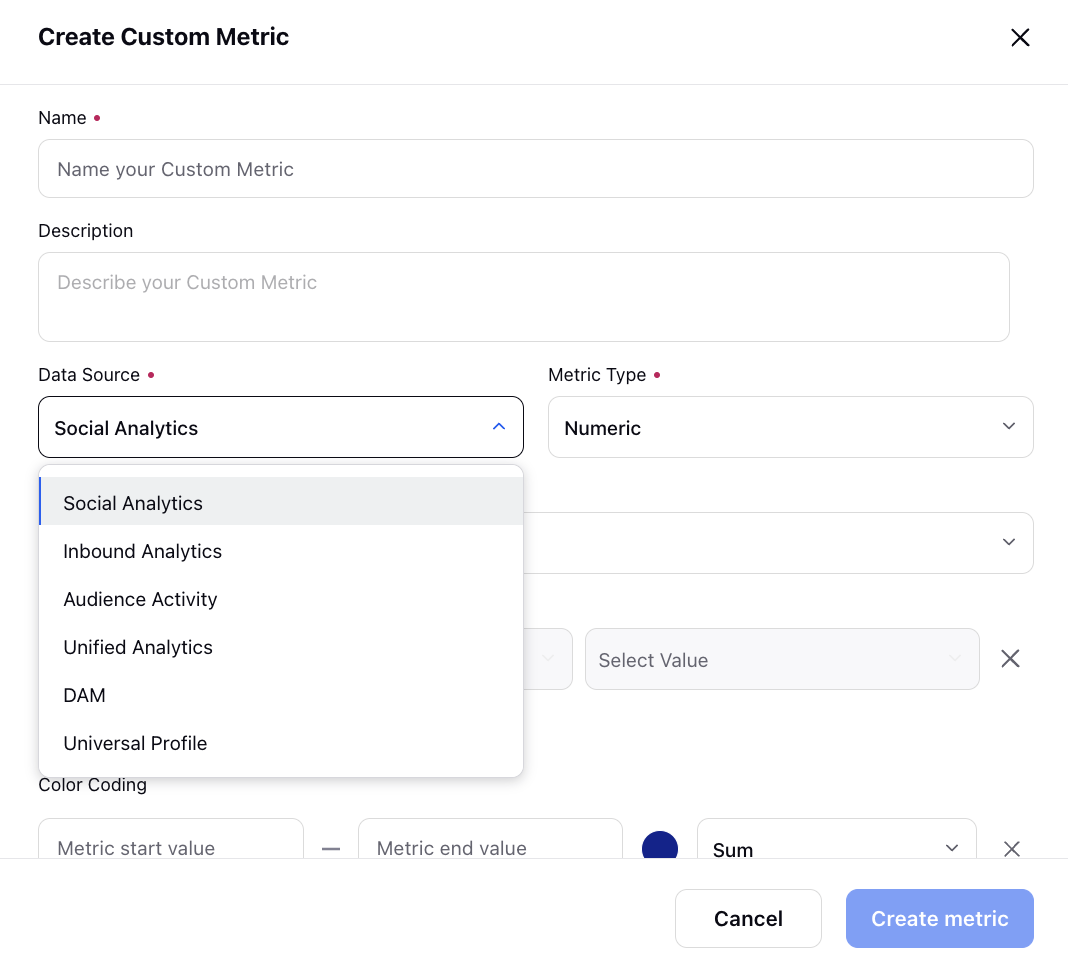
Enter the Custom Metric details and click Create. For more information, see Custom Metrics — Field Descriptions.
Custom Metrics — Field Descriptions
Term | Description |
Name | Enter a name for the metric. |
Description | Enter a description of the metric that you want to create. |
Data Source | Select the Data Source from which you want to use Metrics and Dimensions to create the Custom Metric.
|
Metric | Select the metric from the list. These metrics are fetched from the social APIs. You can select a numeric operator from the list and add another metric. You can create a custom metric from an existing custom metric. For Example, if you have created a metric named Average Macro used per case, where the metric is 'Case Macro Usage Count / Unique Case Macro Usage Count', you can create another custom metric with Average Macro used per case as one of the metrics in the metric field.
|
Metric Type | Select the desired metric type. Metric type is the unit in which the data count gets reflected. You may select from the following metric types:
|
Use Case | Select the Report Group and the relevant Report from which you want to use Metrics and Dimensions to create the Custom Metric.
|
Filters | Add dimensions, filter type, and select values. |
Color Coding | Define the desired value ranges and associated colors. These will be reflected in Table , Counter(the numeric value would change the color), Counter Summary(the icon will change the color) and Cross-Tab (Listening) widgets where the metric is used. |
Note:
|
To Manage Custom Metrics in Reporting Home
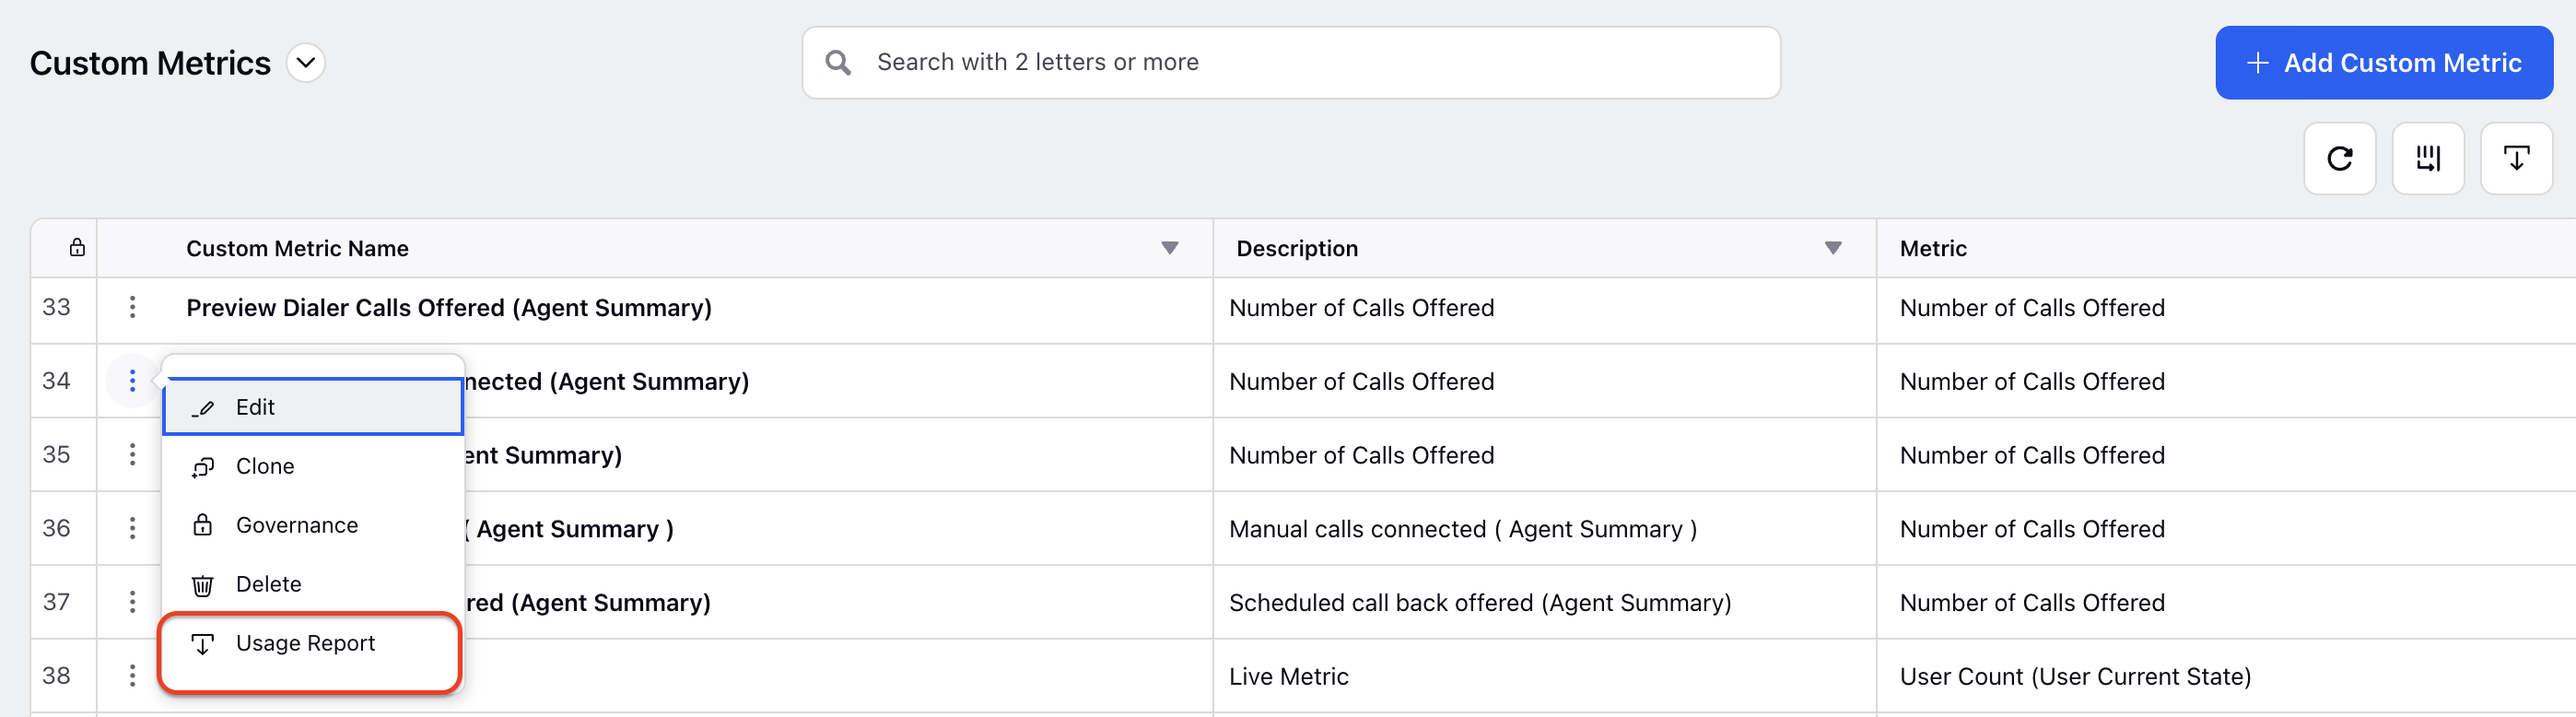
In the Custom Metrics window, hover the Options icon to Edit, Governance (Share), Delete, or export Usage Report of your custom metric.

Custom Metrics Options — Field Descriptions
Term | Description |
Edit | Select to edit the desired custom metric. |
Clone | Make a copy of the custom metric. |
Share | Select to share the custom metric with all or specific Workspace(s) and/or User(s)/User Group(s). |
Activity | Access the change log for custom metrics, where you can view updates to the formula, filters, conditional formatting, description, name, and type.
|
Delete | Select to delete the desired custom metric. |
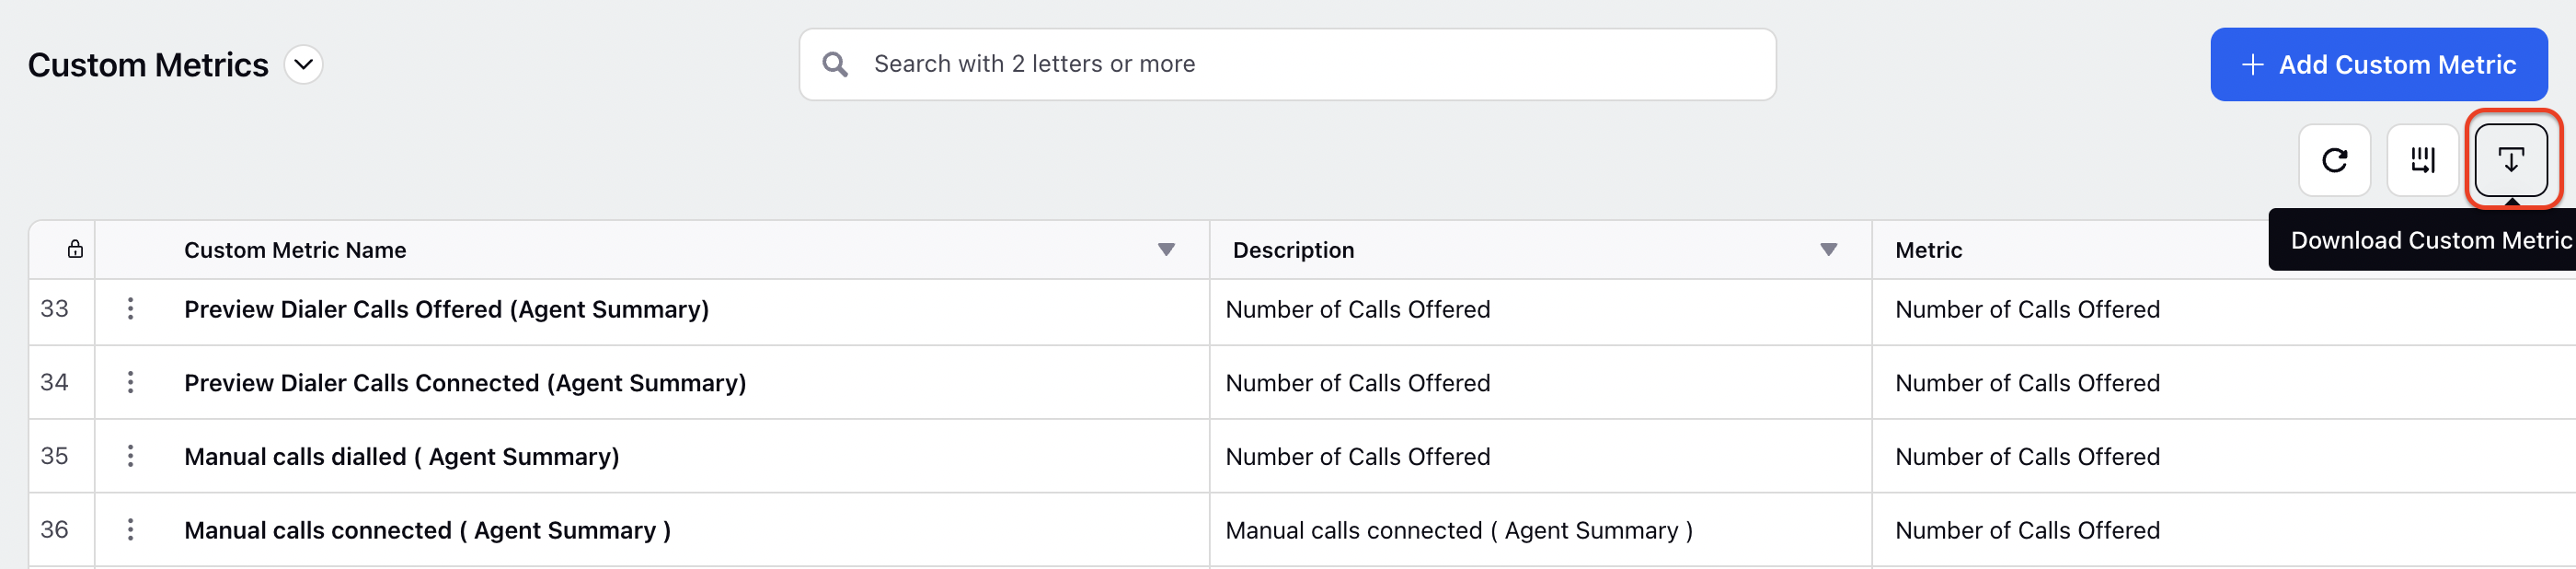
Usage Report | Select to export the report on the custom metric usage. At Dashboard Level To export a cumulative report on all the custom metrics usage, in the top right corner of the Custom Metrics window, click the Download Custom Metric Usage Report icon. At Metric Level On the Custom Metrics window, hover over the Options icon on the left side of the desired custom metric. Click Usage Report to export a cumulative report on all the custom metrics usage. |

Custom Metrics as Filters in Reporting Widgets
You can use custom metrics as filters in reporting widgets, providing greater flexibility in data analysis. This feature allows you to apply custom metrics to refine the data displayed in widgets, enabling more tailored and precise reporting.
Enablement note: To learn more about getting this capability enabled in your environment, please work with your Success Manager. |