Widget Configuration in Reporting
Updated
Reporting in Sprinklr centralizes data from all digital and voice channels and accounts. In Reporting, you can customize, expand, and drill into metrics by creating dashboards and widgets.
Sprinklr’s Dashboard creation flow and widget library make report creation easy and quick. Creating reports is now simpler, as you no longer need to remember thousands of metrics from various channels. Metrics and Dimensions are organized into groups, making it easy to identify the relevant ones.
Note:
The maximum threshold for display on Reports in Sprinklr is 300 per page and 5000 overall for a Table Widget.
You can review monthly, quarterly, or yearly business performance using the "Month of year" Dimension or by toggling the Widget aggregation between a monthly or quarterly basis for better decision-making.
You can also access the Widget Library to easily customize and add the widget templates to your dashboard. It will help you reduce the learning curve needed to create insightful reports. Logically grouped data points, system-guided chart selection, and widget library, ensure quick and accurate report creation.
Admin Set-up: You must have the Widget Editor permission in Reporting permissions to access the Widget Editor and Library. You can learn more about Roles and Permissions.
Create a Reporting Widget
Prerequisites for creating Widgets:
Create permission under the Dashboard section in the Reporting module.
Existing Reporting Dashboard and access to it.
Follow these steps to create a Reporting Widget:
Go to Care Reporting in the Analyze column on the Launchpad. This will open the Reporting Dashboards Record Manager.

Open the Dashboard on the Record Manager, where the Widget must be created. If the Dashboard is inside a folder, open the folder and open the Dashboard.
Click the Add Widget button at the top right of the page to open the Widget Builder page.
Enter the following details regarding the Widget:
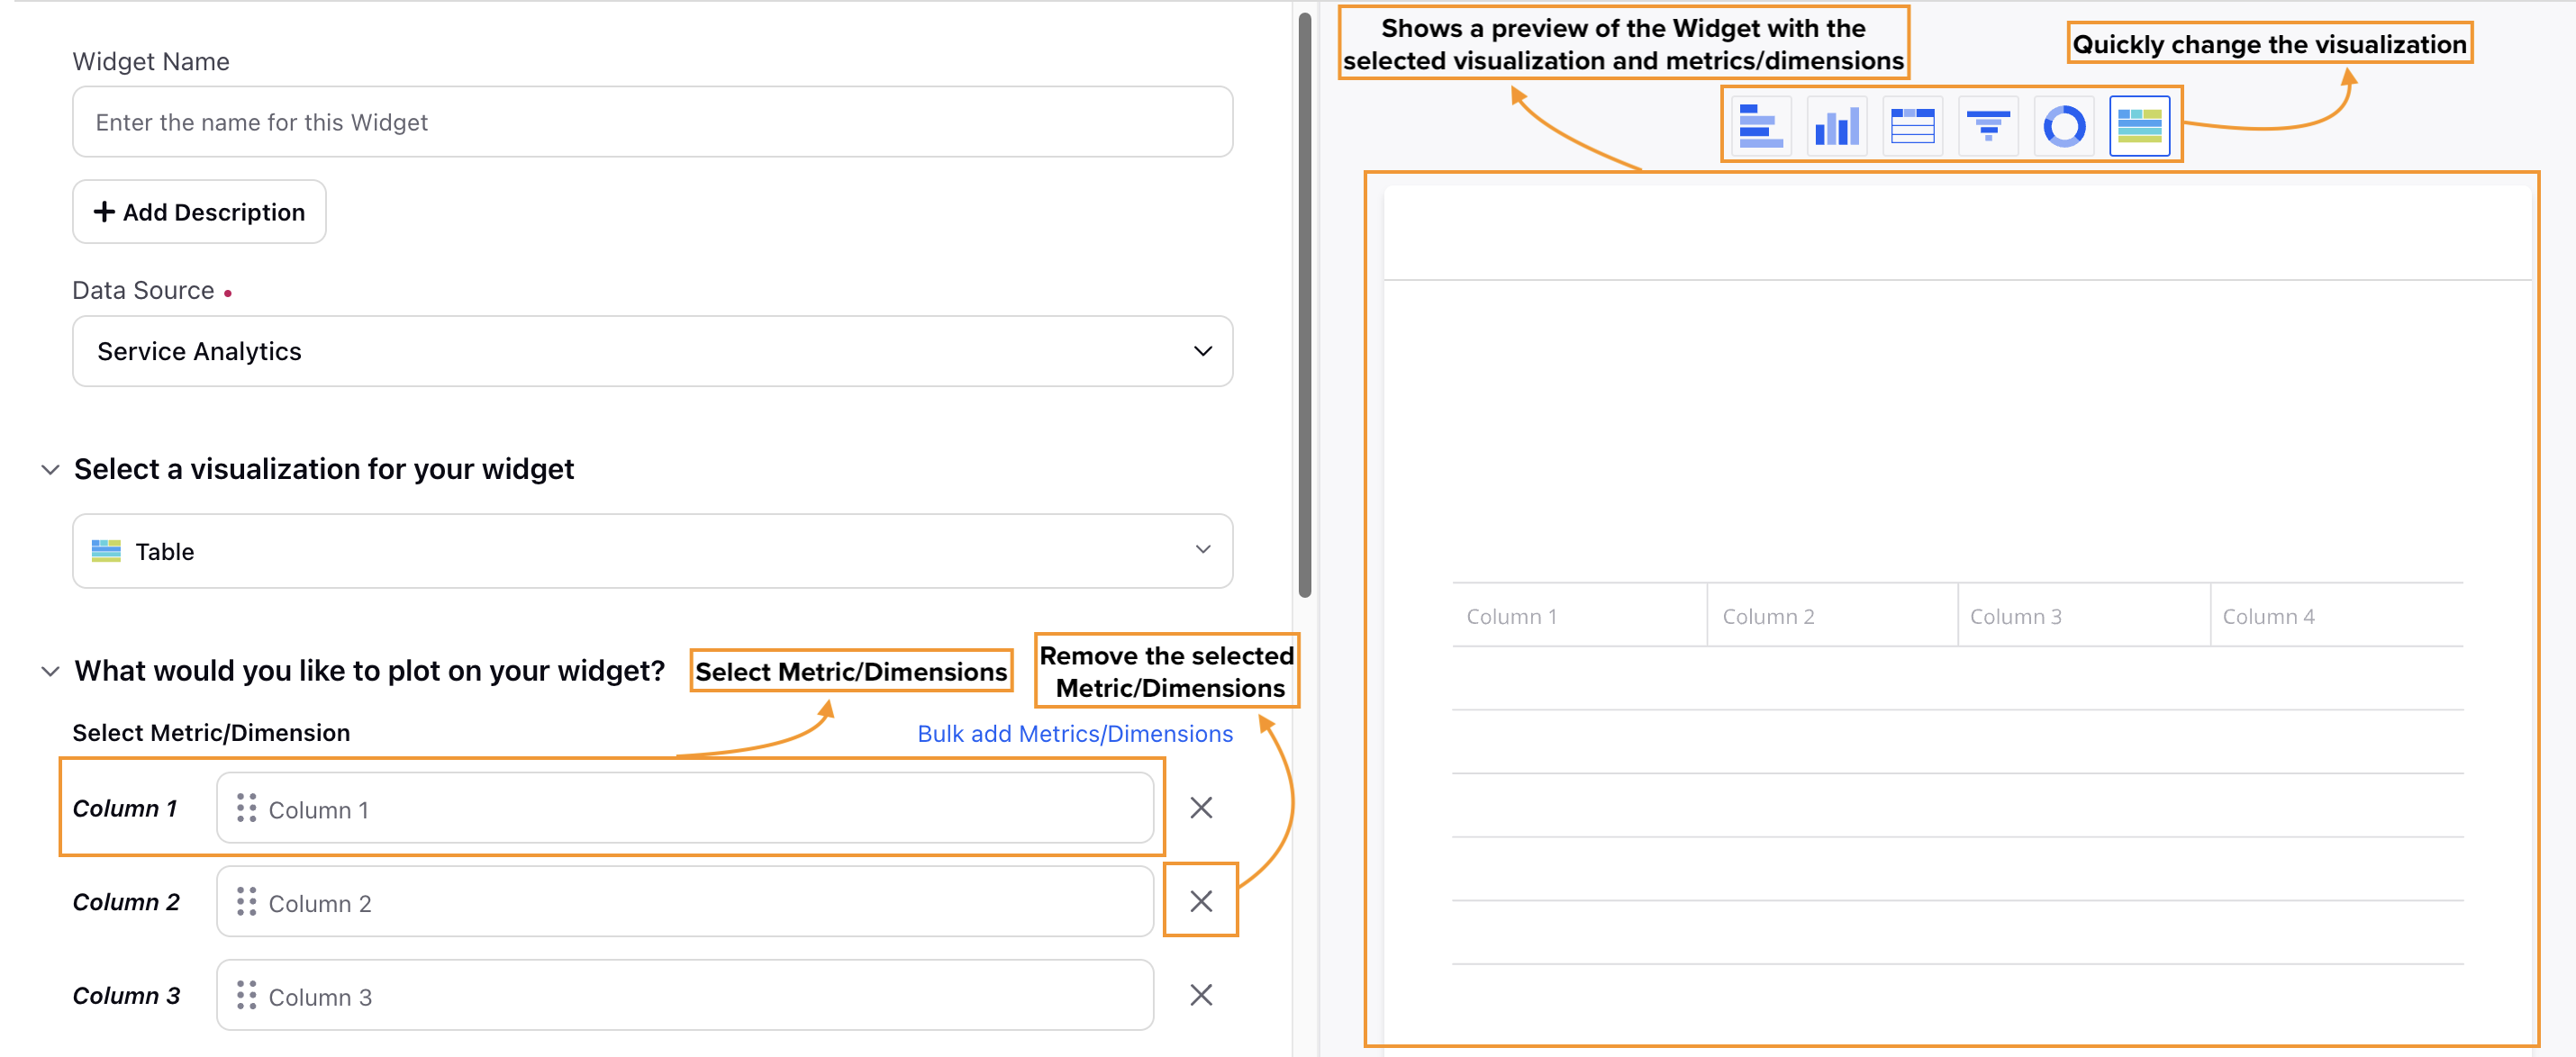
Widget Name: Enter the name of the Widget for identification.
Add Description: Click this button to display a field where you can briefly describe the Widget’s purpose and functionality. This description will be visible when you hover over the “?” sign on the Widget in the Dashboard.
Add Tutorial: Click this button to attach a tutorial video using the Media Uploader. This tutorial video will be visible when you hover over the “?” sign on the Widget in the Dashboard.

Note: The Add Tutorial button will be visible only after you click the Add Description button.
Data Source: Select the Data Source to be used for the Widget. (Required)
Refer to this page to explore the various Data Sources available in Sprinklr Service Reporting and Analytics.
Select the visualization you want to use from the list in the Select a visualization for your widget section. Table, Pie, Spline, and Bubble are some of the available visualization options. Explore available visualizations.
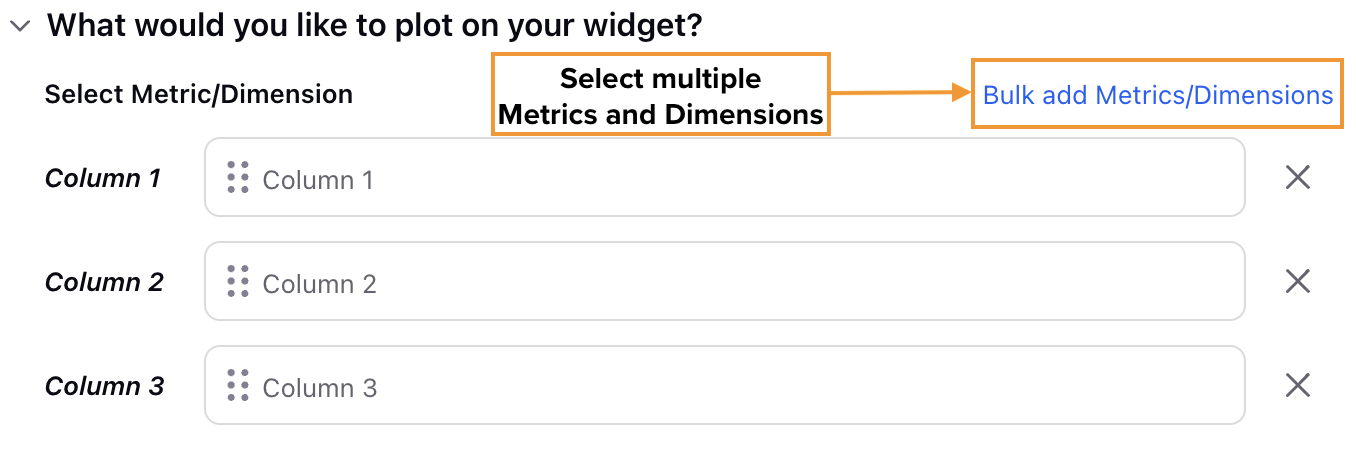
Select the Metric(s) and Dimension(s) to be plotted in the What would you like to plot on your widget? section. Click the Bulk add Metrics/Dimensions option to select multiple compatible Metrics and Dimensions. Refer to the Selecting Metrics and Dimensions section below for further details.
When selecting a Metric, the following operators are available for your data:
Note: The selected visualization determines the fields available in this section. For example, choosing the Table visualization displays fields like Column 1, Column 2, and so on, while selecting the Column visualization shows fields like X-Axis and Y-Axis.
When selecting a Metric, the following operators are available for your data:
Select the appropriate Configuration options for the visualization.
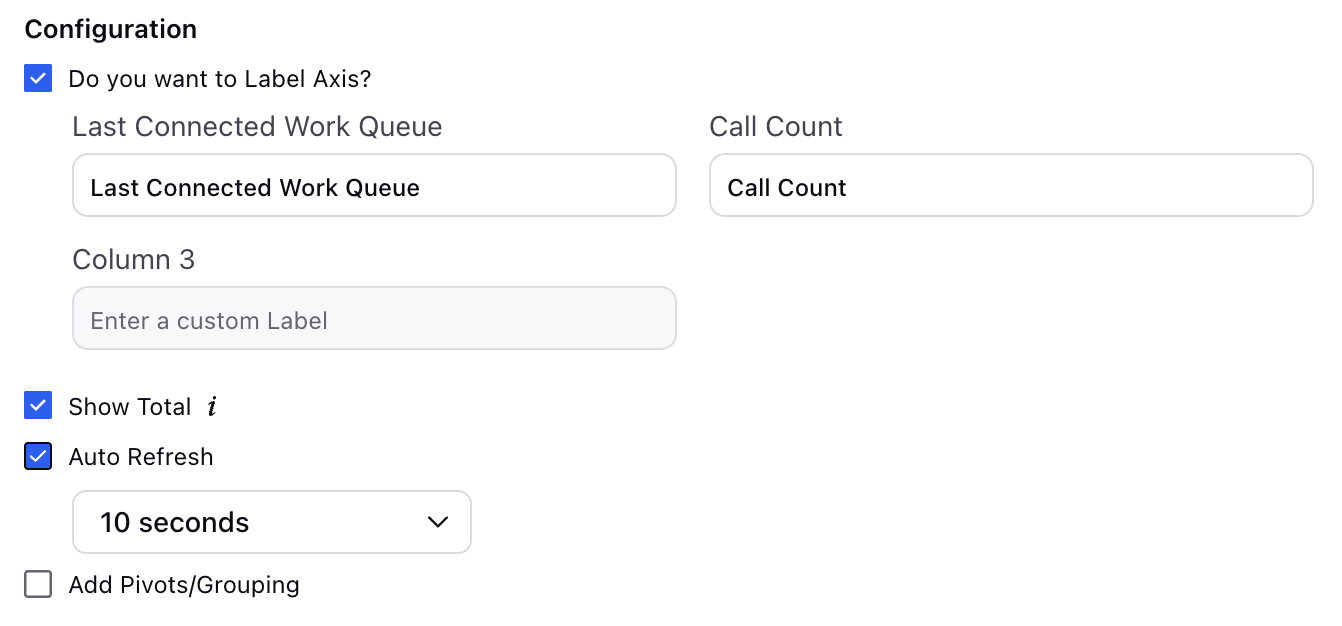
Note: The selected visualization determines the fields available in this section. For example, the Table visualization displays the Add Pivots/Grouping field, which won’t be present if Pie visualization is selected.
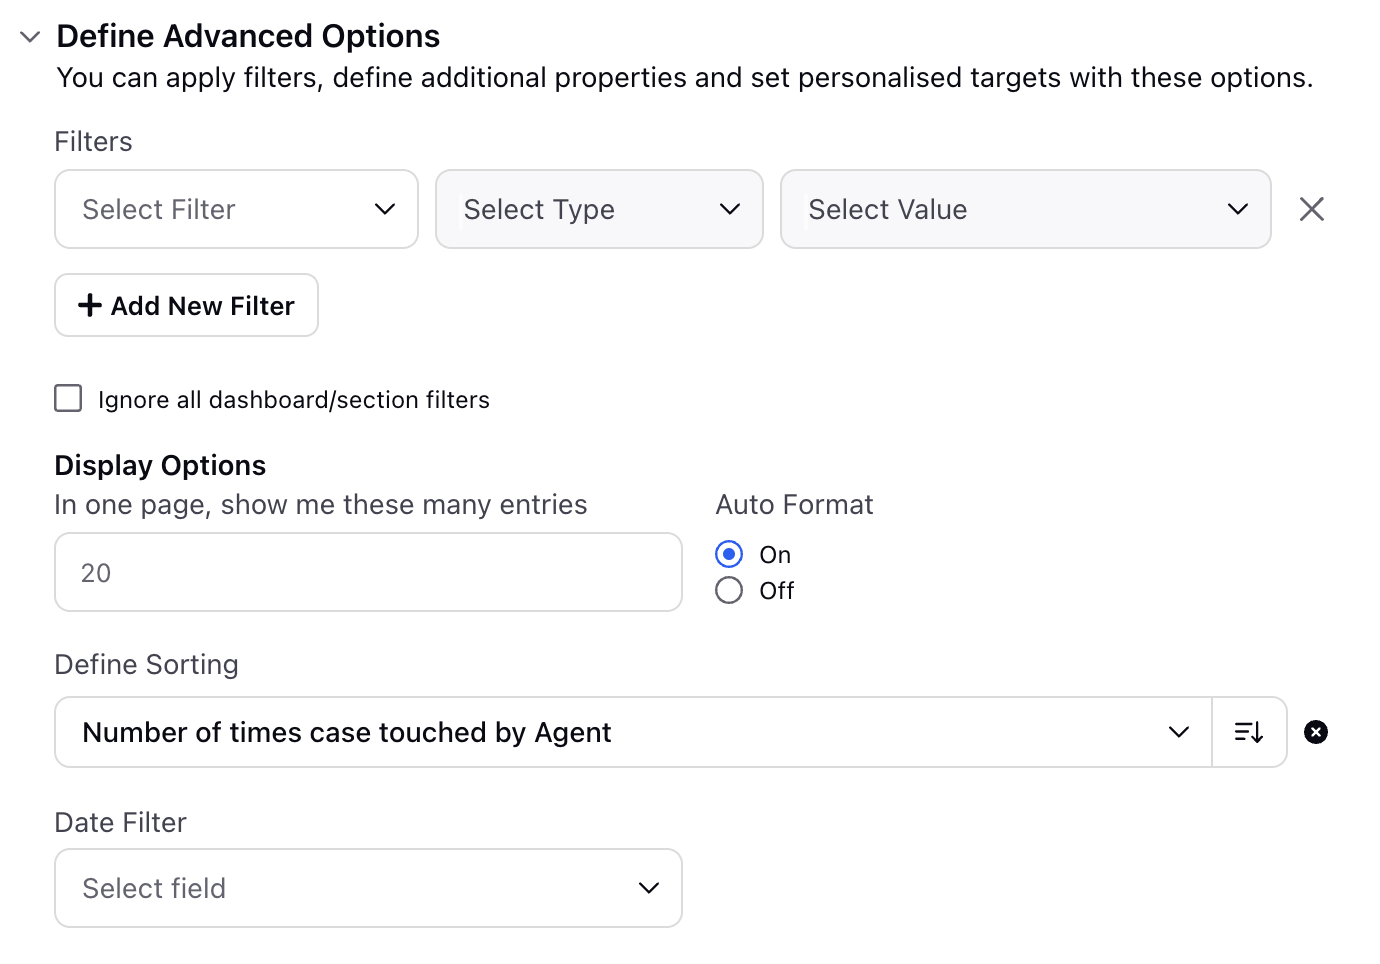
In the Define Advanced Options section, you can select Filters, define additional properties, modify display options, and more.
Applying Filters
Select Filter: Choose the type of filter you want to apply. It determines the category or attribute of the data that will be filtered.
Select Type: Select the operator to define how the filter will be applied to the value. The available operators are:
Containing: Shows records where the specified field includes the given value.
Not Containing: Shows records where the specified field does not include the given value.
Exists: Shows records where the specified field is present and has a value.
Select Value: Enter the value(s) that will be checked against the selected filter type using the chosen operator. The value(s) entered here will be used to match records based on the criteria defined by the filter type and operator.
Click the Add New Filter button to add more Filters.
Select the Ignore all dashboard/section filters checkbox if you want the selected Filter(s) to override any existing Dashboard-level or Section-level Filters.
Display Options
Enter the number of entries to be visualized on a page.
Auto Format: Auto Format determines the number of decimal points for data visualization. When Auto Format is enabled, data is displayed with 2 decimal points (1.23, 0.24, 4.02, and so forth). Turning Off Auto Format allows you to choose the number of decimal points, ranging from 0 to 5. Selecting 0 decimal points will display data as whole numbers (2,6, 45, 49, and so on).
Define Sorting: This field allows you to choose how to sort the data in the visualization. To sort the data, select the Dimension or Metric for sorting, then choose Ascending or Descending order. Ascending order will display the lowest value of the selected metric or dimension at the top while Descending order will show the highest value at the top.
Note: Only the Metrics and Dimensions that are used to plot the Widget can be utilized to sort the data.
The Drilldown section allows you to get further analytics on the Metrics used in the Widget. Select a Drilldown Lens in the Select Drilldown Lens field. Additionally, click the +Metric Drilldown button to a Metric for the Drilldown in the Metrics field and then select the appropriate Drilldown Lens in the Explore Lens field.
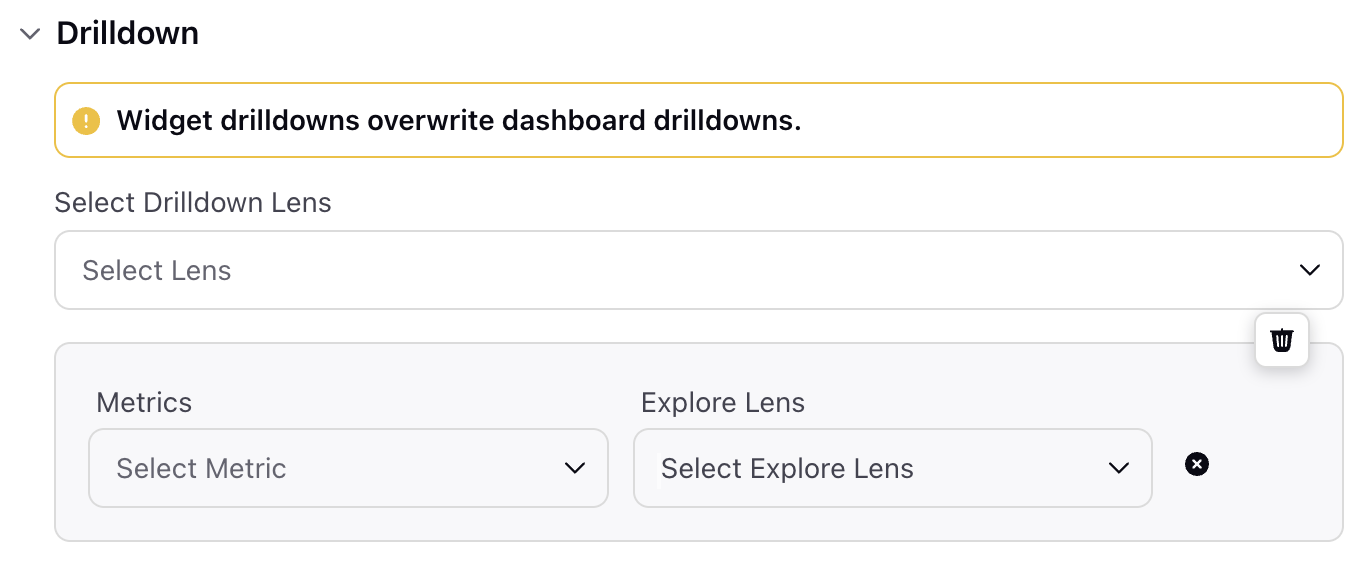
Note: The total number of Metrics that can be selected in this section equals the number of Metrics used to create the Widget.
Click the Add to Dashboard button at the bottom right of the page to create and add this Widget to the Dashboard.
Create a Reporting Widget using Widget Library
Click the New Tab icon '+' . Under the Sprinklr Service tab, click Reporting within Analyze.
Click the Dashboard Menu icon in the top left corner of the Dashboard and select the desired reporting dashboard.
Next, click Add Widget in the top right corner of the desired reporting dashboard.
In the Create Custom Widget window, click Widget Library from the section bar.
In the Widget Library window, hover over to the desired widget and click Add to Dashboard to add your widget to the Reporting Dashboard. You can also make the desired changes to the widget by selecting the Customize Widget.
The remaining steps are similar to Creating a Custom Widget in Reporting.