Location Insights: Custom dashboard
Updated
Users can create a customized Location Insights dashboard to suit their specific requirements. Select any desired widget type and add the required metrics and dimensions to create your own widgets for your custom dashboard.
Benefits of using a custom dashboard
The custom dashboard is not just aligned to a single use case for a client like other dashboards available could be. It gives you an overview of Business Locations monitoring.
Various sections and parts of the dashboards can be customized as per the needs and use cases of the user.
To create a custom dashboard
Log in to the Sprinklr platform using your credentials.
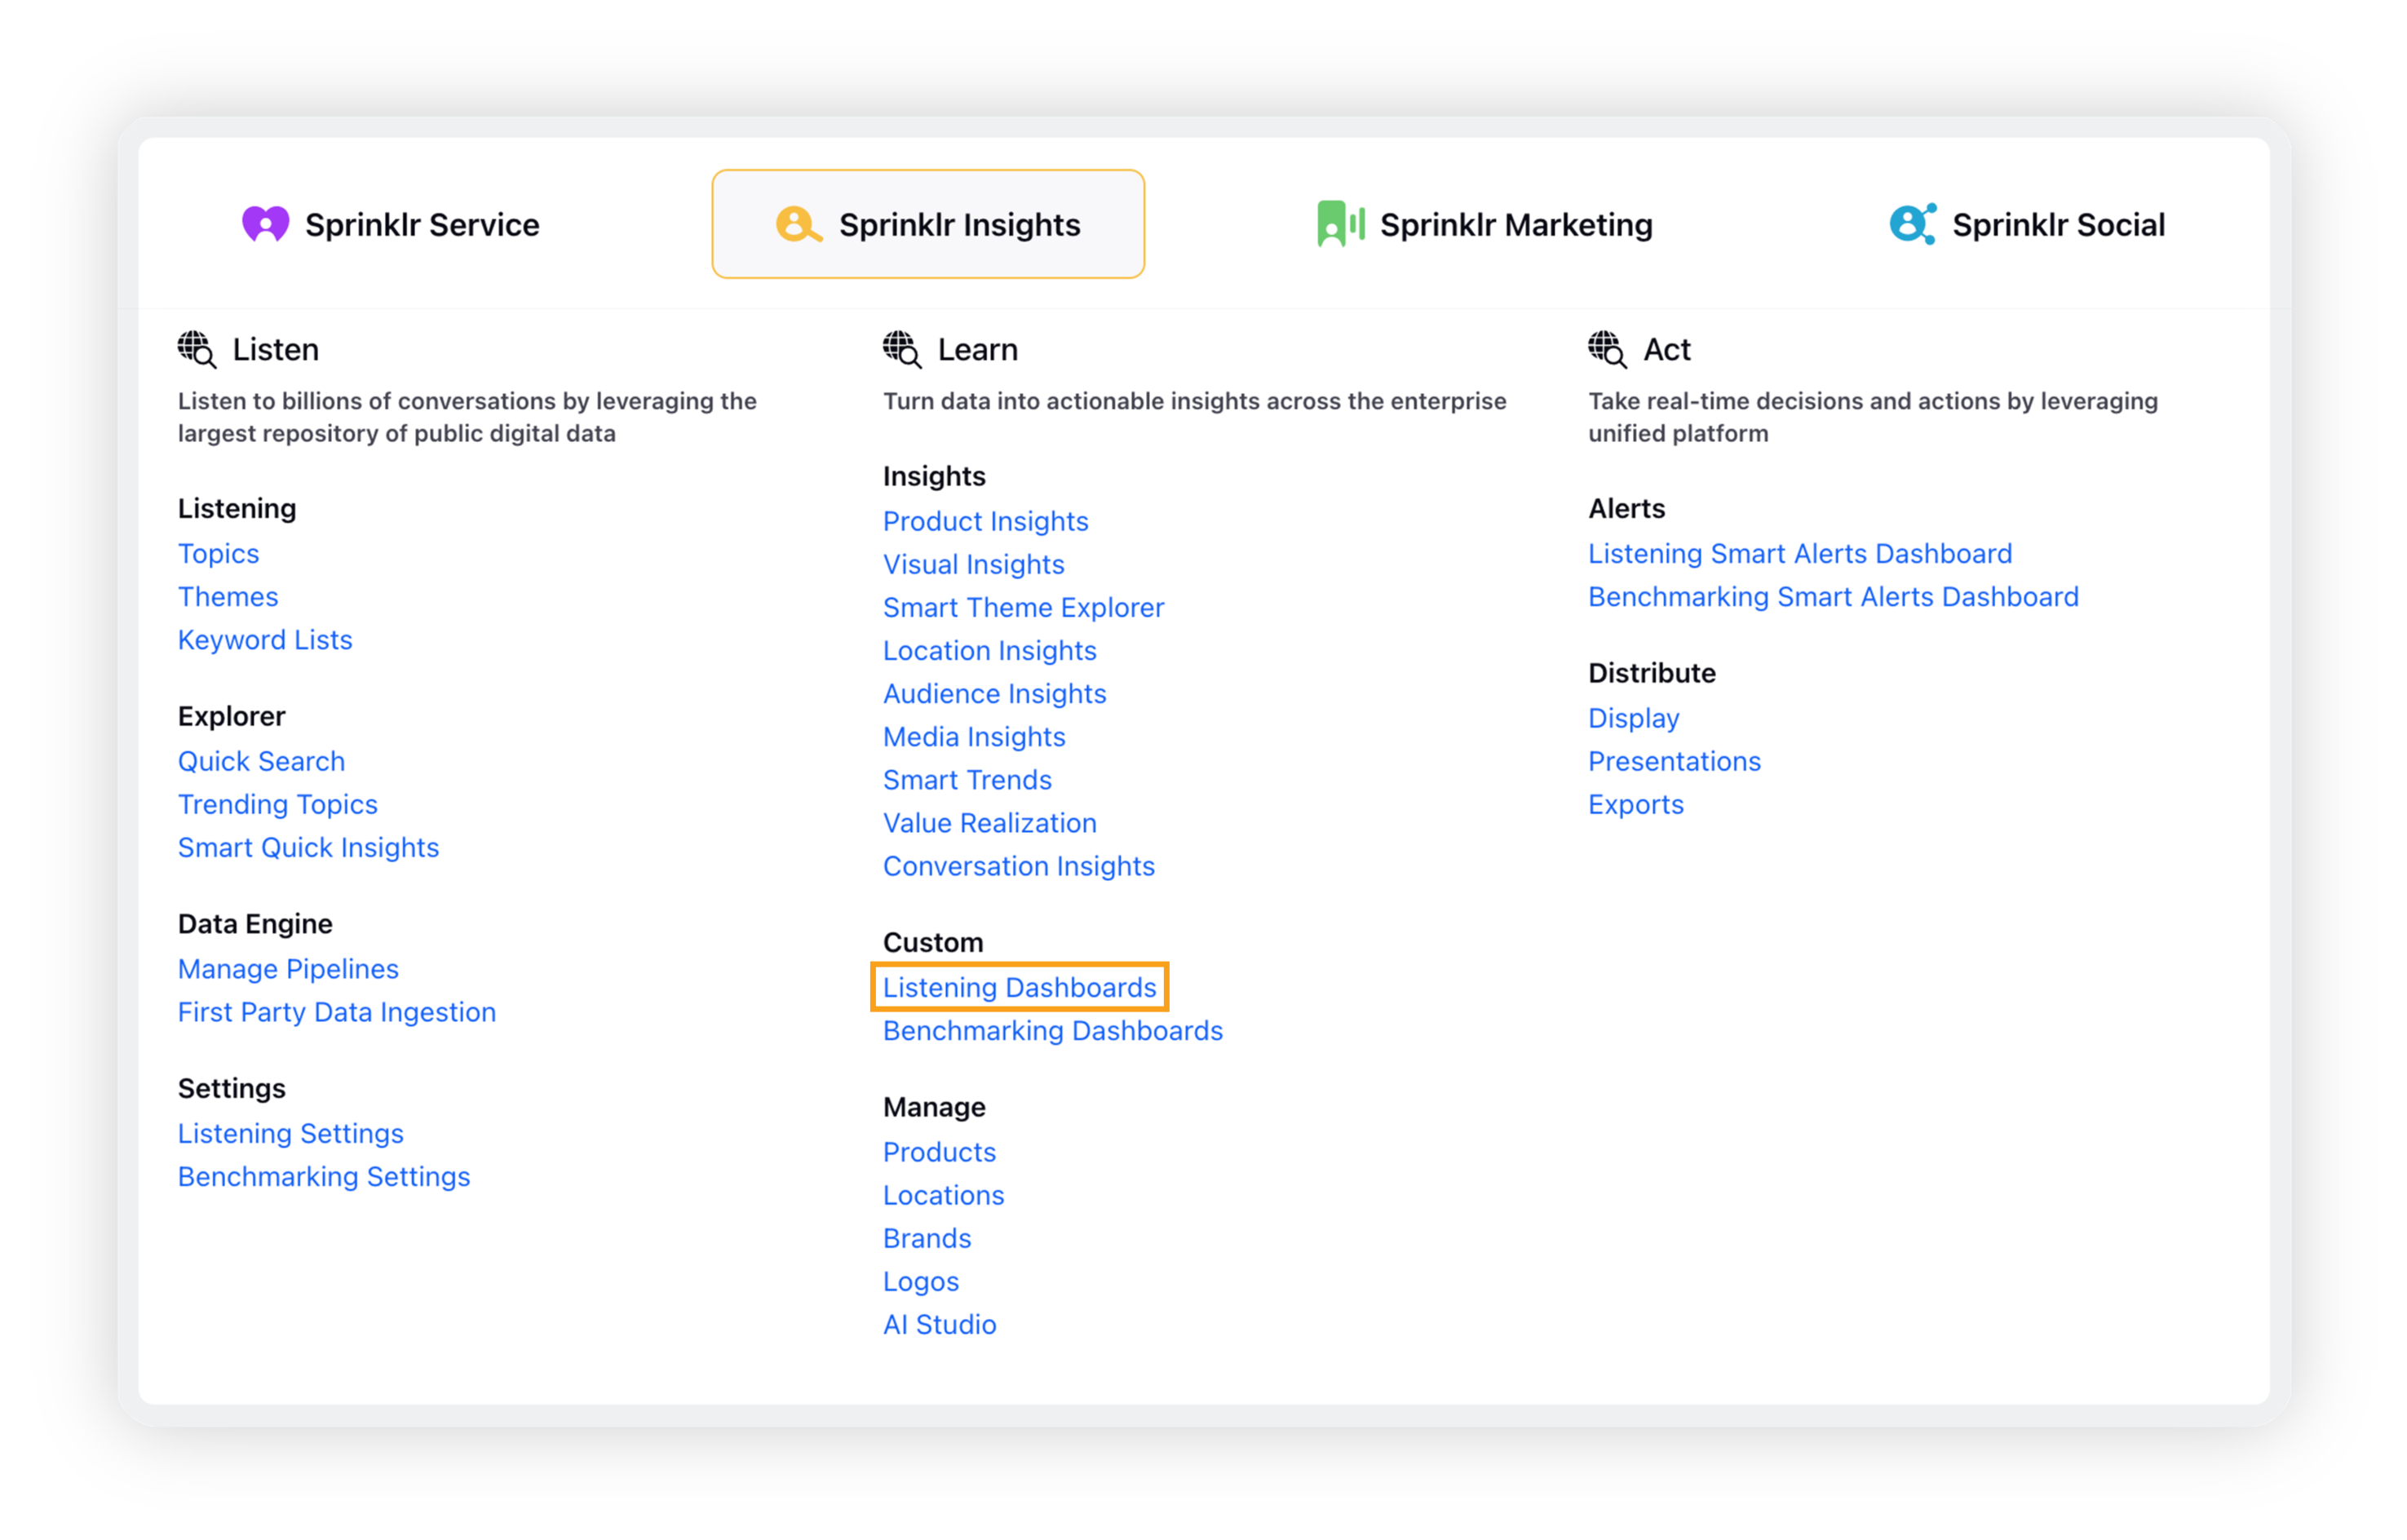
Click on the launch pad icon in the top right corner to open the launchpad or click on the ➕ icon in the top left corner to open a new tab, which automatically opens the launchpad.
The launchpad contains all the products and services that Sprinklr provides.
Under Sprinklr Insights, click Listening Dashboards within Learn.
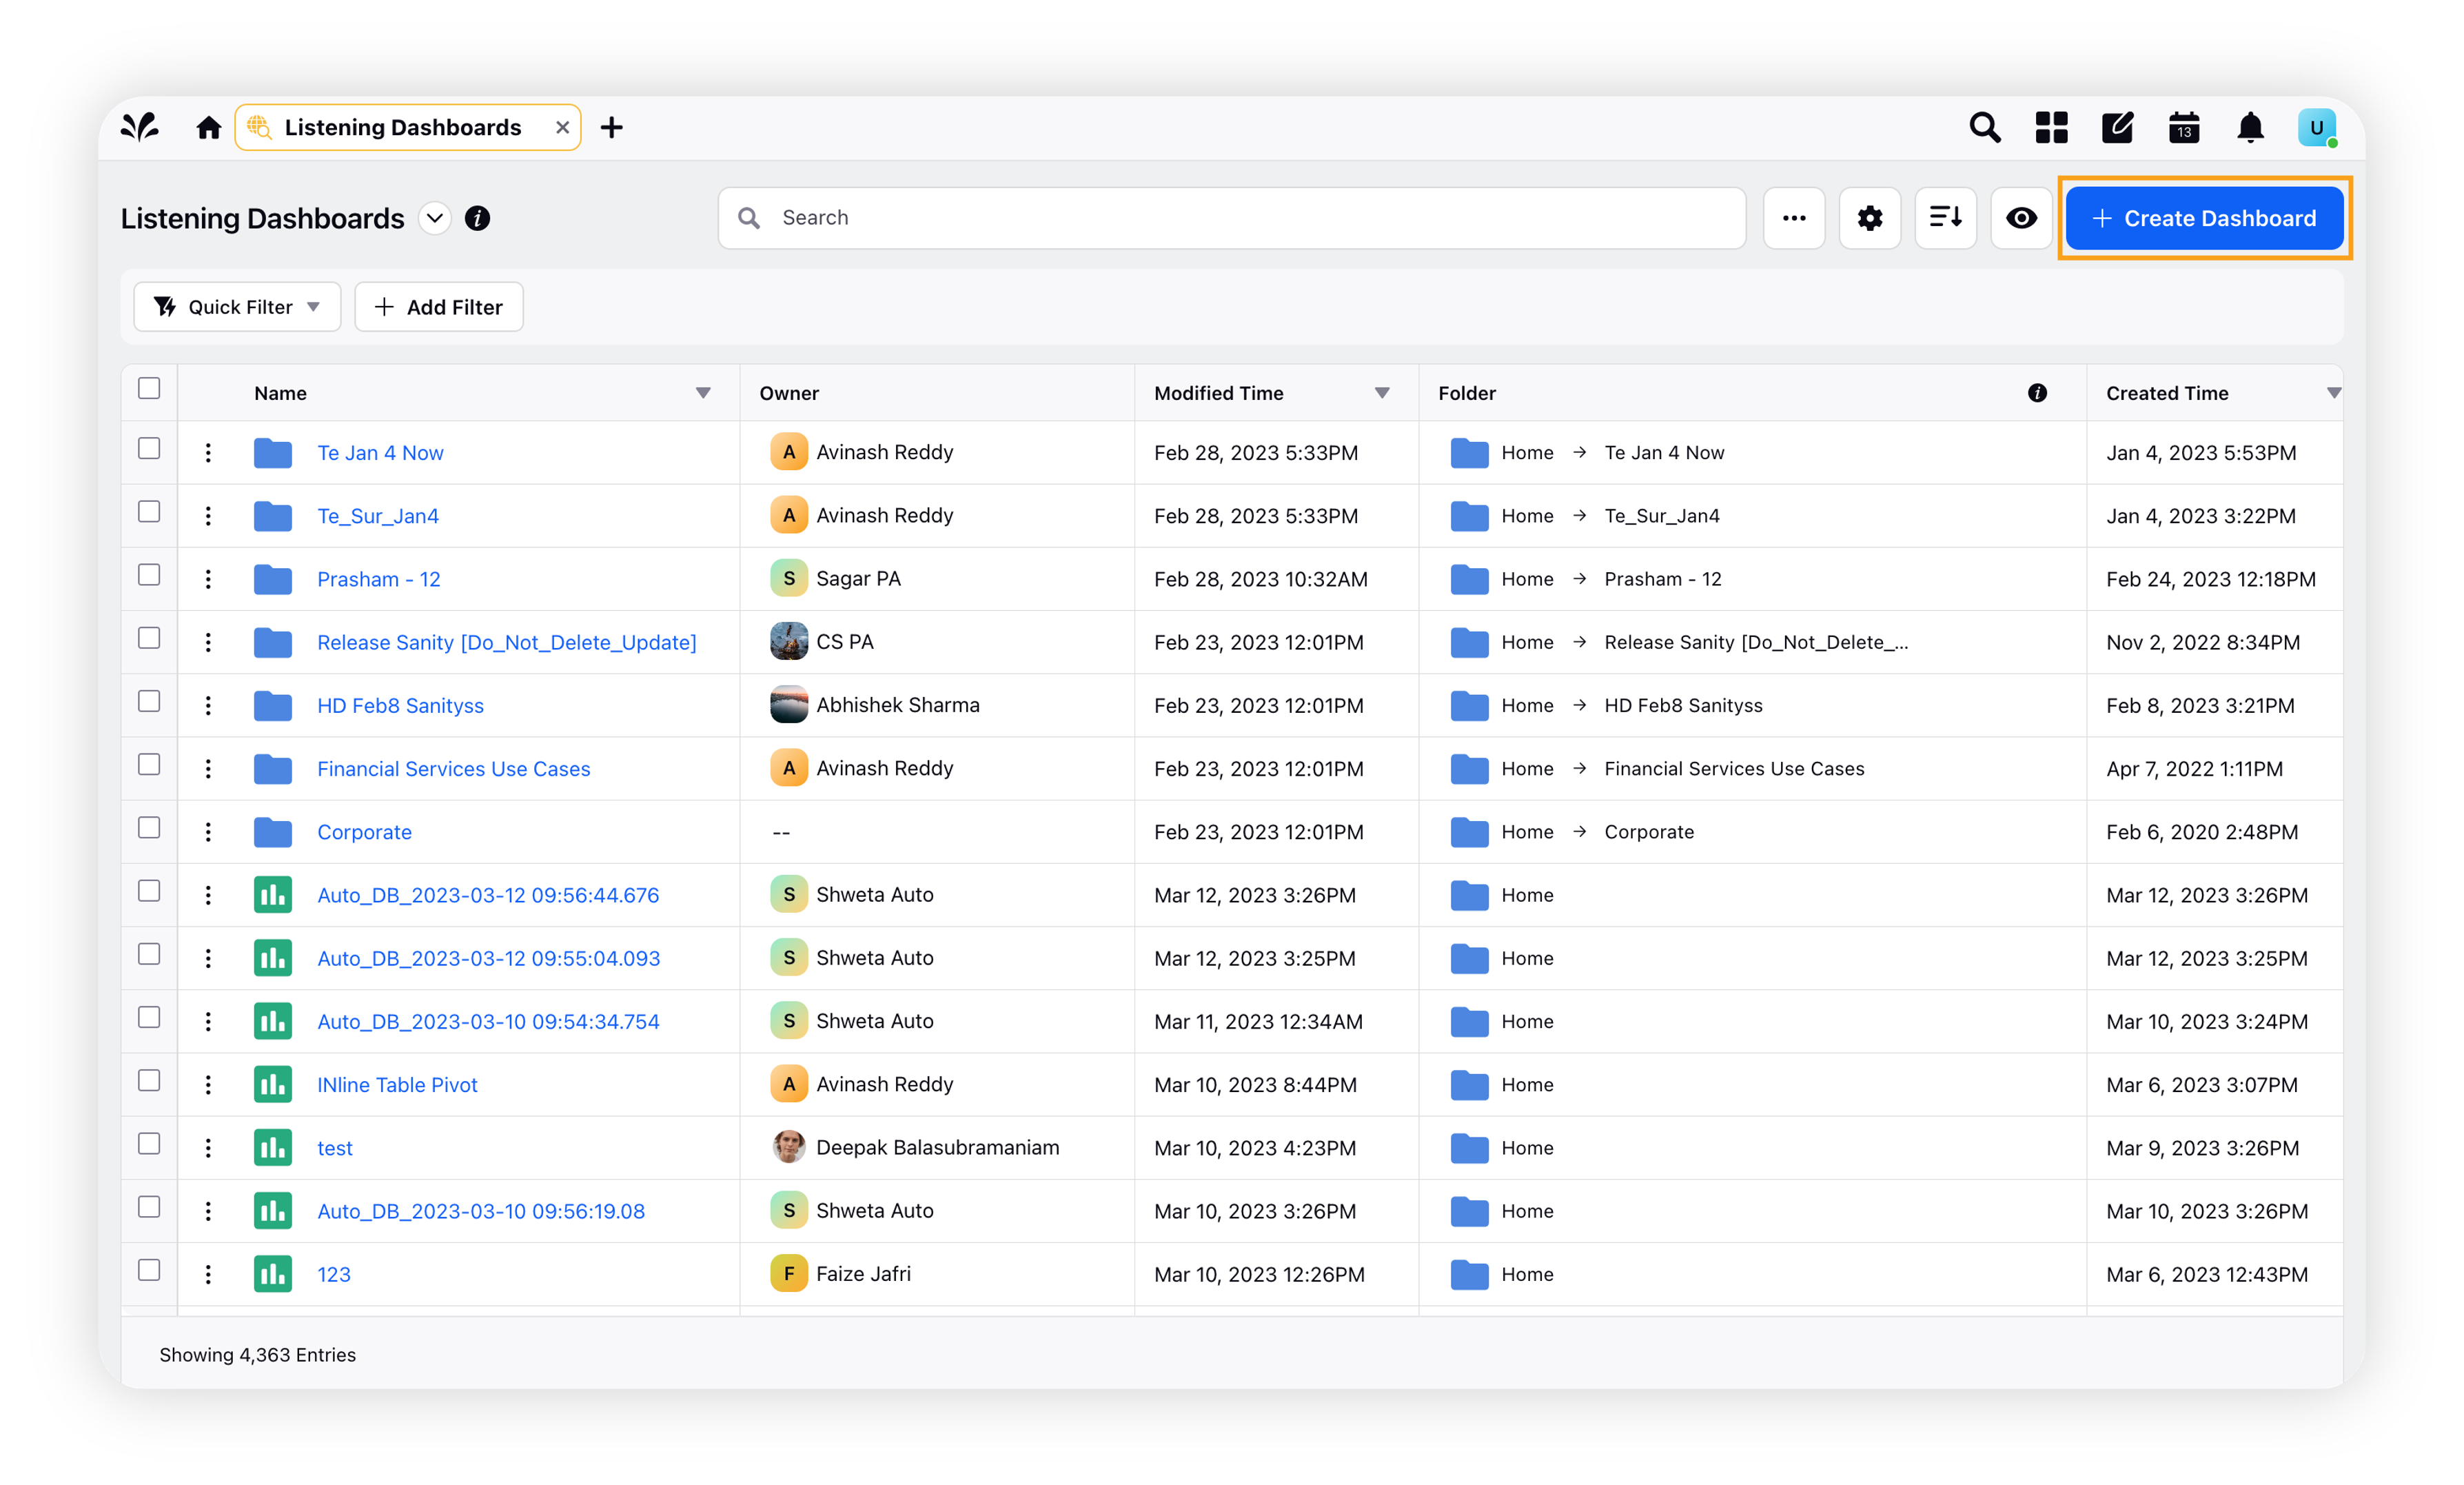
On the Listening Dashboards homepage, click on Create Dashboard in the top right corner.
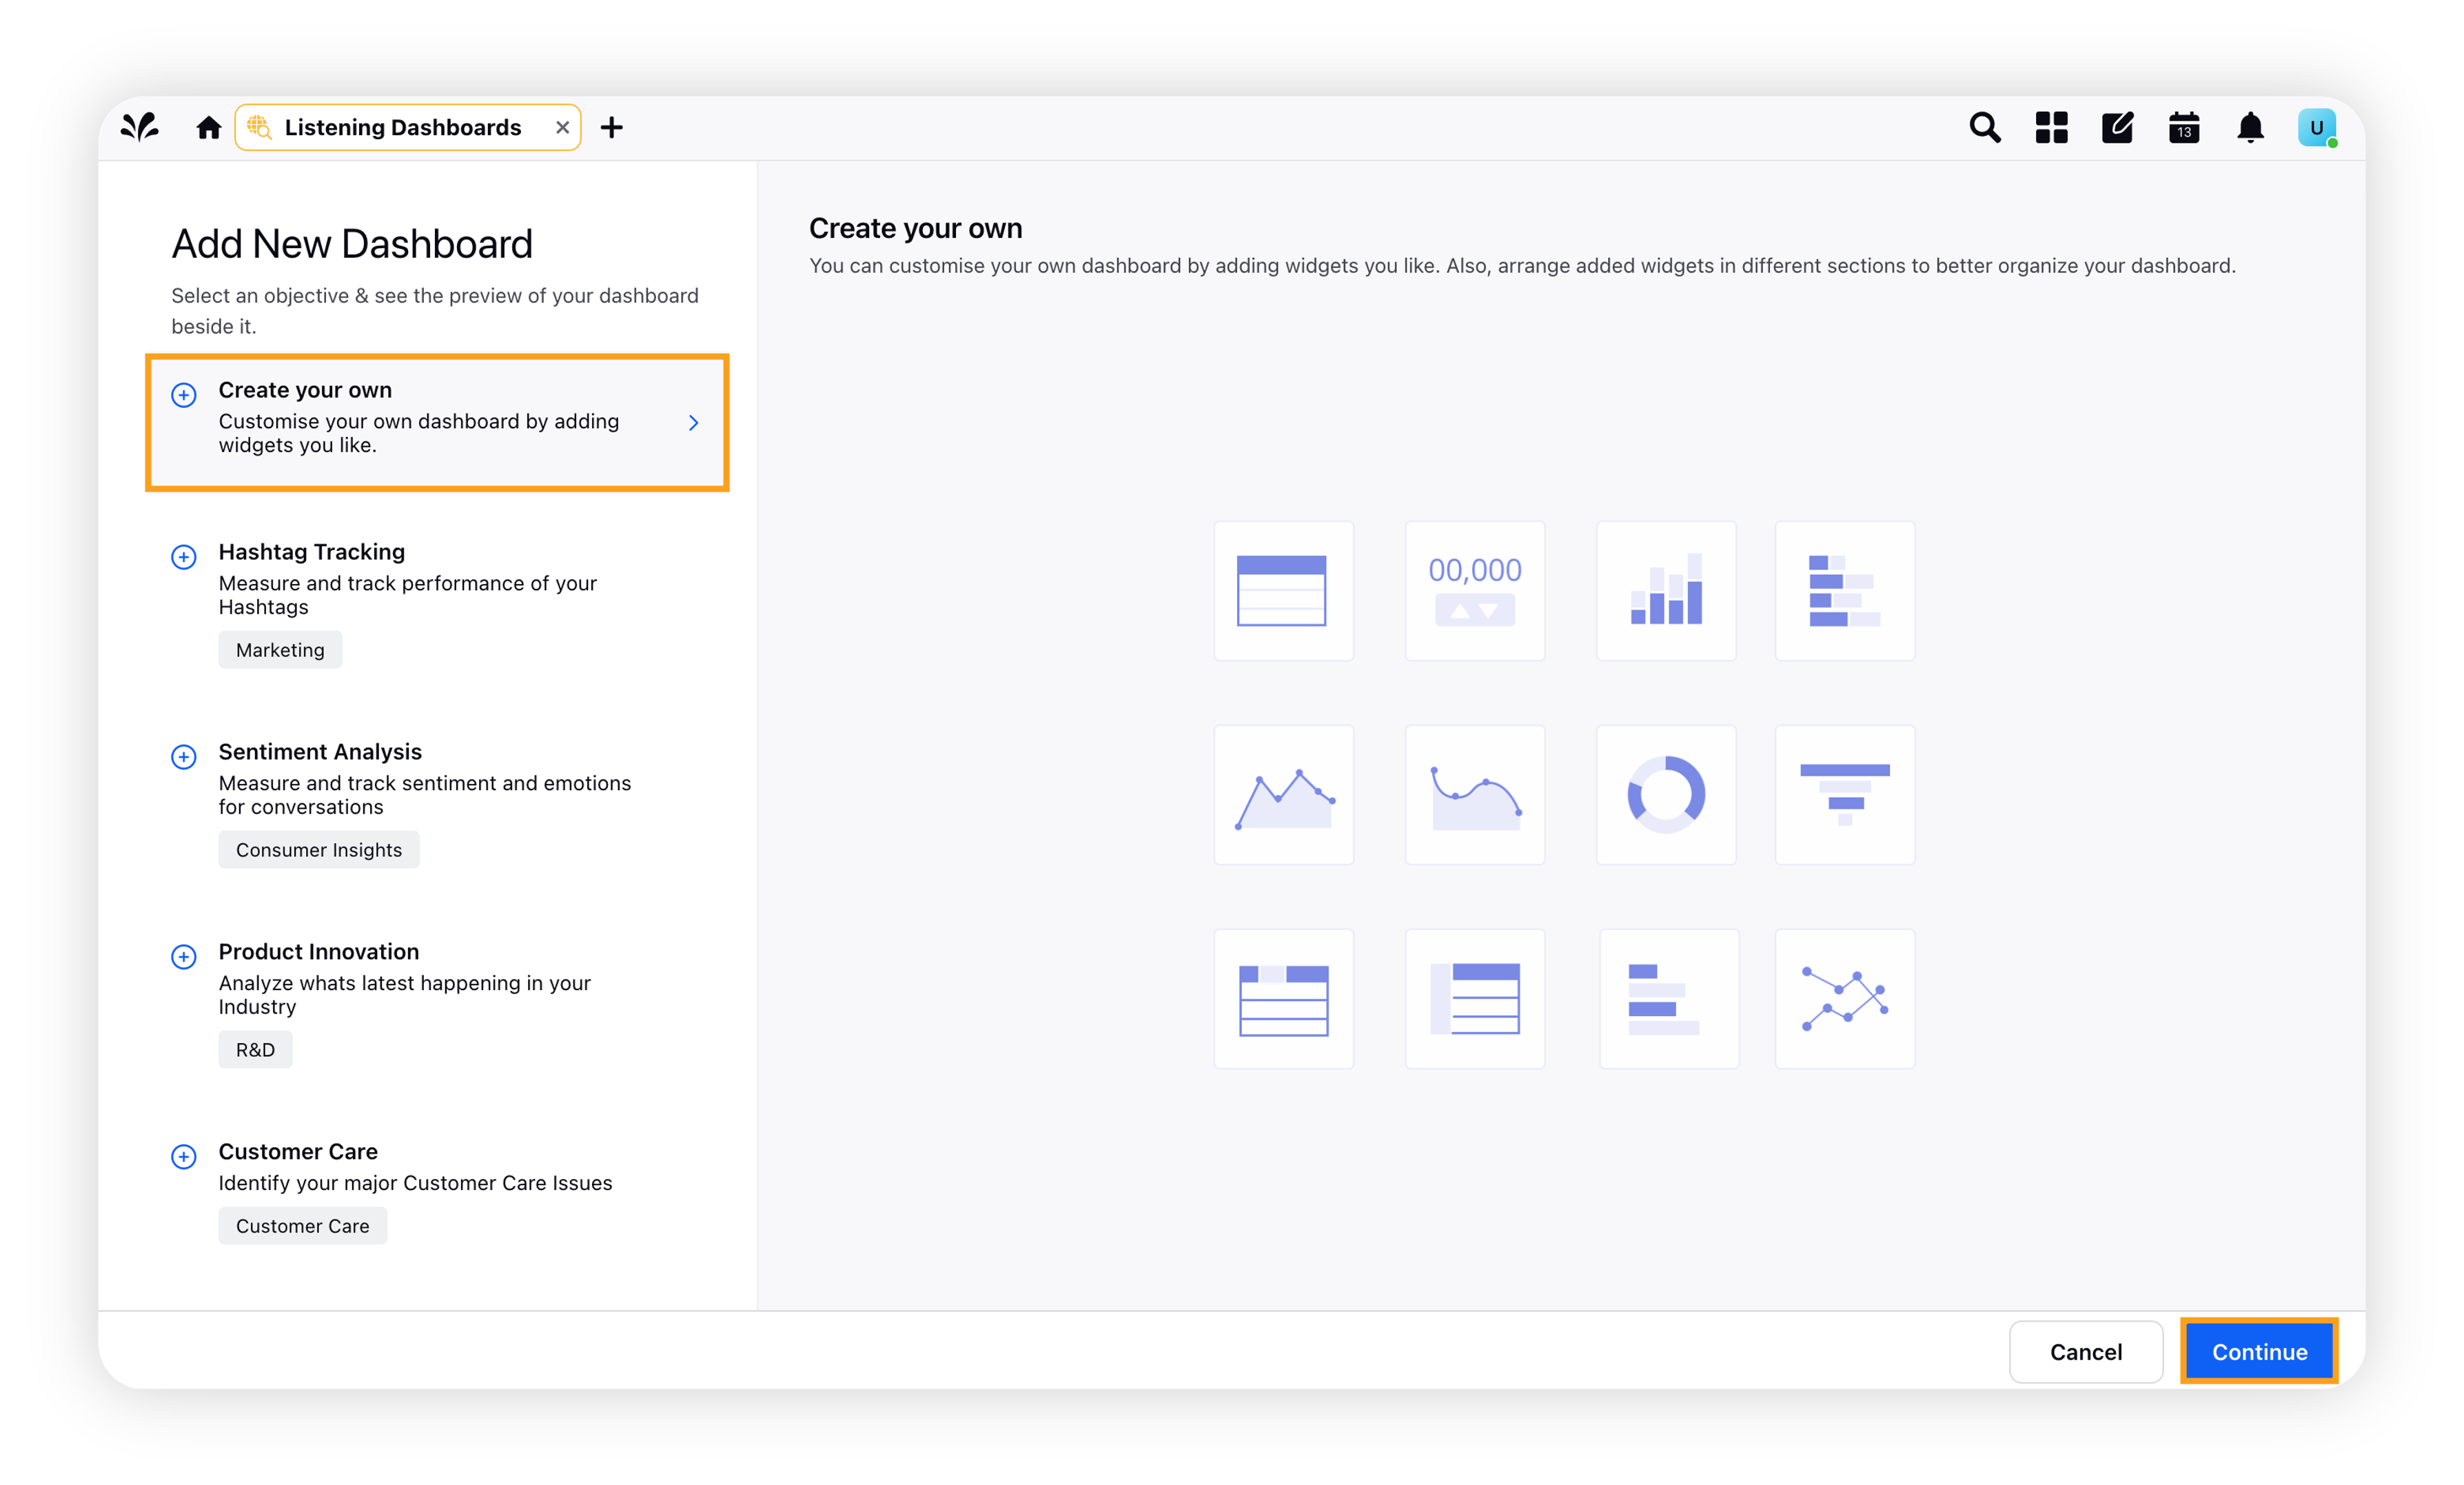
This will open the Add New Dashboard screen from where you can Create your own dashboard or choose from the pre-added dashboards available there.
Click on Continue in the bottom right corner of the screen.
On the Create your own popup window, enter the basic details. For more information, refer to the Create Your Own section.
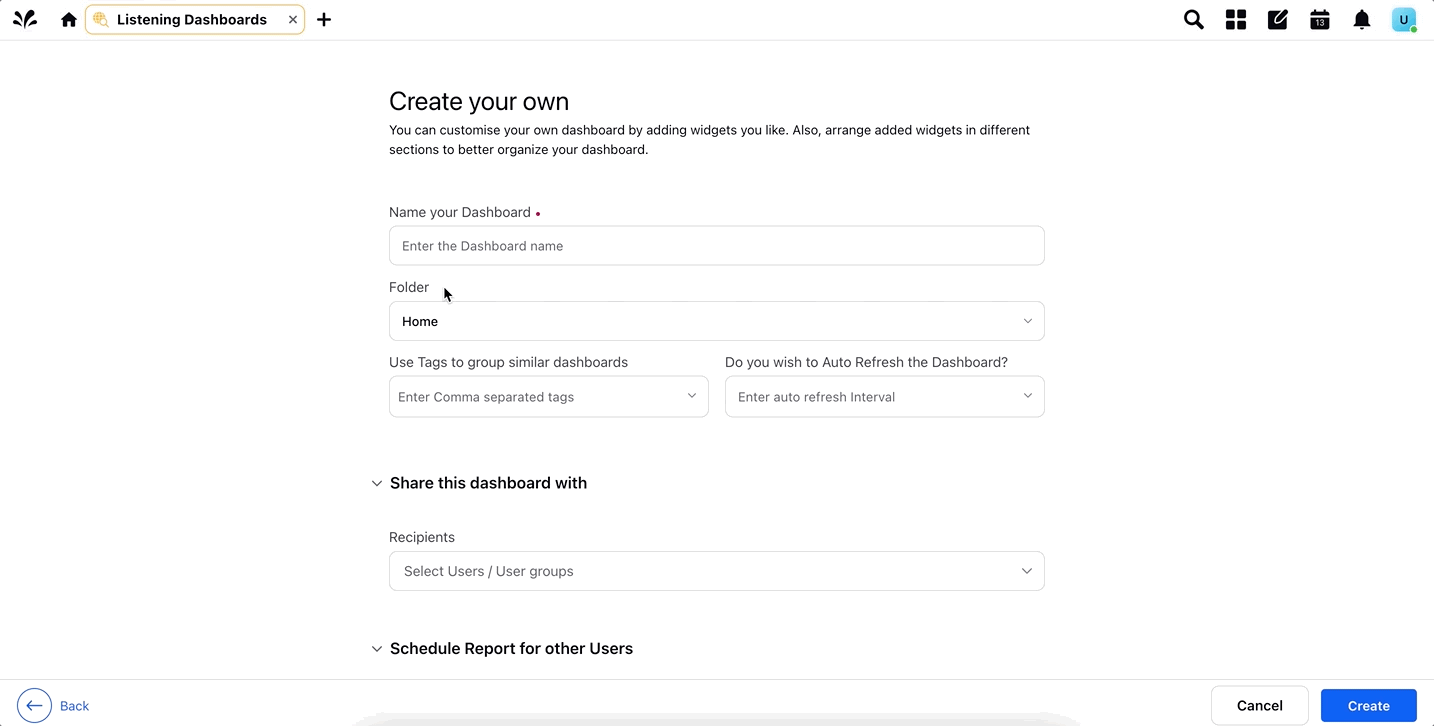
Click Create in the bottom right corner of the screen.
Once the dashboard is successfully created, it will be opened as a blank dashboard. You have to add widgets to it to view data. To do that, click on Add Widget in the top right corner of the screen or in the middle of the screen.
All the standard widgets in the standard Location Insights dashboard along with a number of other custom widgets are available under Select a visualization. You can select any of the visualizations and plot necessary dimensions and metrics to view and analyze the data.
Create your own dashboard – Fields & description
Field | Description |
Name your Dashboard | Enter a name for your dashboard. |
Folder | Select the desired folder into which you want to place the dashboard. By default, it is Home. |
Use Tags to group similar dashboards | Enter or select tags for your dashboard. |
Do you wish to Auto Refresh the Dashboard? | Use this feature to refresh your dashboard automatically. Enter the auto refresh interval like 10 seconds, 15 seconds, etc. |
Share this dashboard with | Select the recipients which whom you want to share this dashboard. You can select multiple users and/or user groups. |
Scheduled report for other users |
|
Difference between standard and custom dashboards
There are two types of Location Insights dashboards available for users – standard dashboards and custom dashboards. Although both the dashboard types serve the same purpose, i.e. helping you gain actionable insights through AI-driven analytics, there is a major difference between these two dashboard types. A standard Location Insights dashboard comes as a pre-built dashboard that will have a number of pre-added widgets. You cannot add a widget to the standard dashboard.
On the other hand, the custom Location Insights dashboard, as the name suggests, is a custom dashboard created by users. Unlike a standard dashboard, a customer dashboard does not have pre-added widgets so users have to add widgets manually, depending on their requirements. The rest of the features and functionalities remain the same in both the dashboards.