Explore Option in Reporting Widgets in the Mobile App
Updated
From Reporting in the Sprinklr Mobile App, you are able to drill-down into widget data for further analysis.
Enhancement in Reporting in the Mobile App
Sprinklr has reimagined and redesigned the analytics suite experience on the mobile application for next-generation smart users.
You will get insights about your most important metrics at your fingertips which can be narrowed down with relevant filters, time ranges and drill-in based on your needs.
You can open all your exported reports sent via emails in the mobile app to leverage the full power of reporting.
You will get addicted to playful modern interactions, thus empowering you to analyse data with lightning speed.
Additional capabilities include quick snapshot view of the full chart, minified chart views, more powerful data drill-in, support of new widgets like dual-axis, summary, multi-counters and much more.
To Explore into a Widget's Data
Login to Mobile app and tap the Menu icon in the bottom right corner. Then tap Reporting under Sprinklr Social to open the Reporting Dashboards.
If you wish, in the top of the screen tap dashboard drop-down icon to switch to the desired dashboards.
Tap on the desired widget.
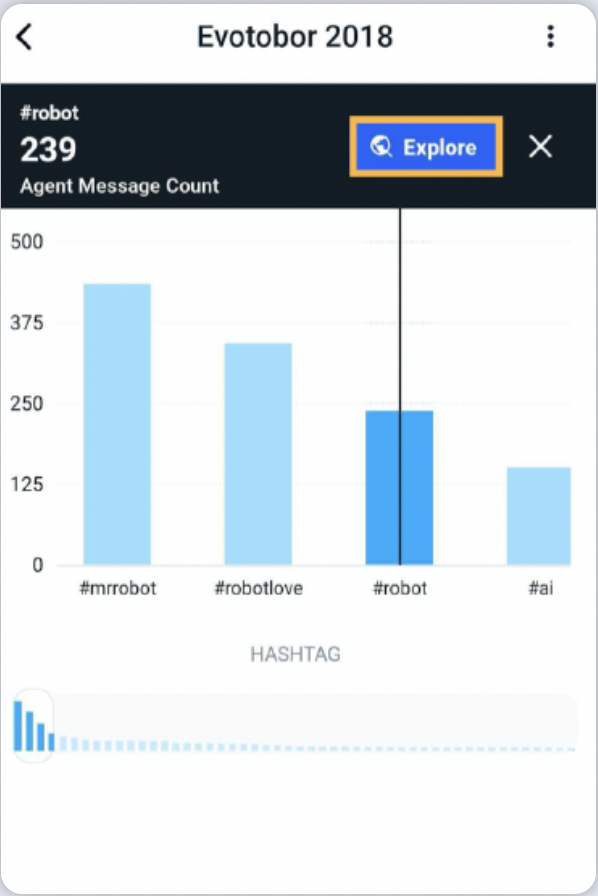
Tap on any data point in the widget, then tap Explore in the top of the screen.
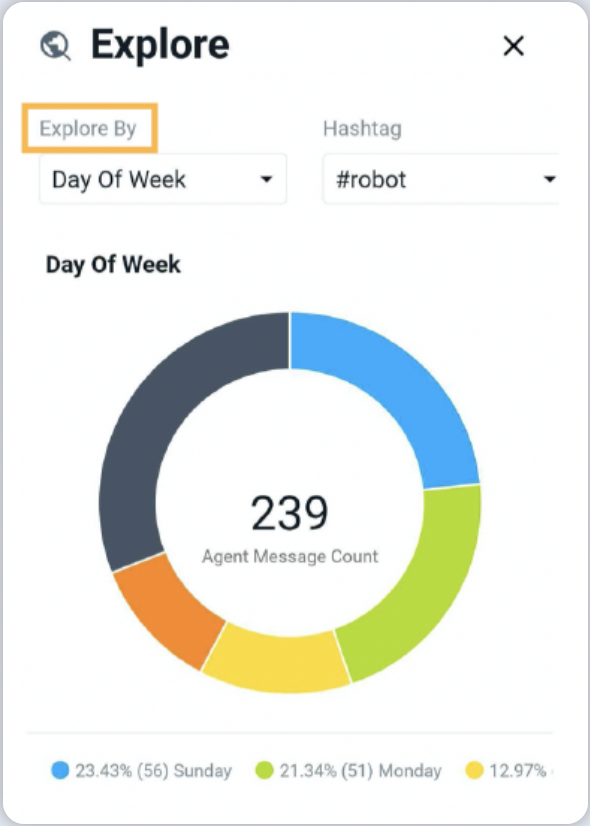
In the Explore screen, tap on the Explore By option to select the desired dimensions and metrics from the drop-down menu and further analyze your Reporting data.
In the Explore screen, you can compare the explore chart with the original chart on the same screen.
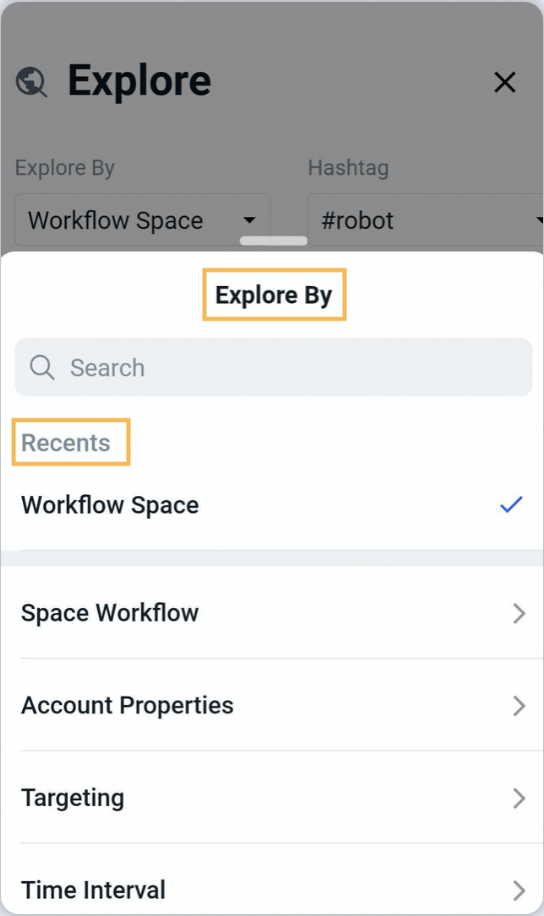
In the Explore pop-up screen, tap Search to search and select your preferred option or select your preferred option.
Additionally, you will get the list of all the recent dimensions and metrics you had access in the Recent section.